[Preprint]. 2023 Feb 22:2023.02.21.529458.
doi: 10.1101/2023.02.21.529458.

A role for fibroblast-derived SASP factors in the activation of pyroptotic cell death in mammary epithelial cells

Affiliations

A role for fibroblast-derived SASP factors in the activation of pyroptotic cell death in mammary epithelial cells

Lisa M Hom et al. bioRxiv. .

Update in

Abstract

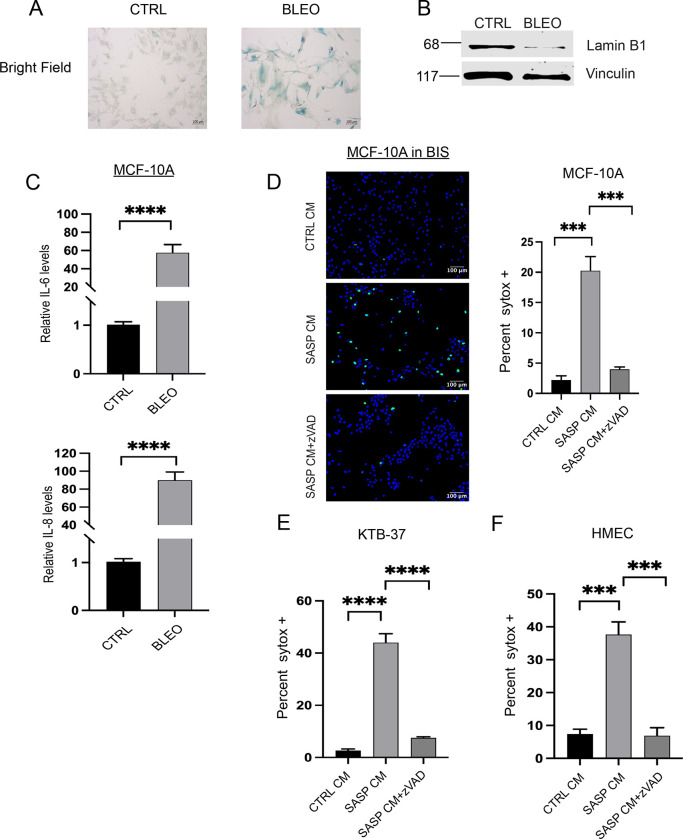
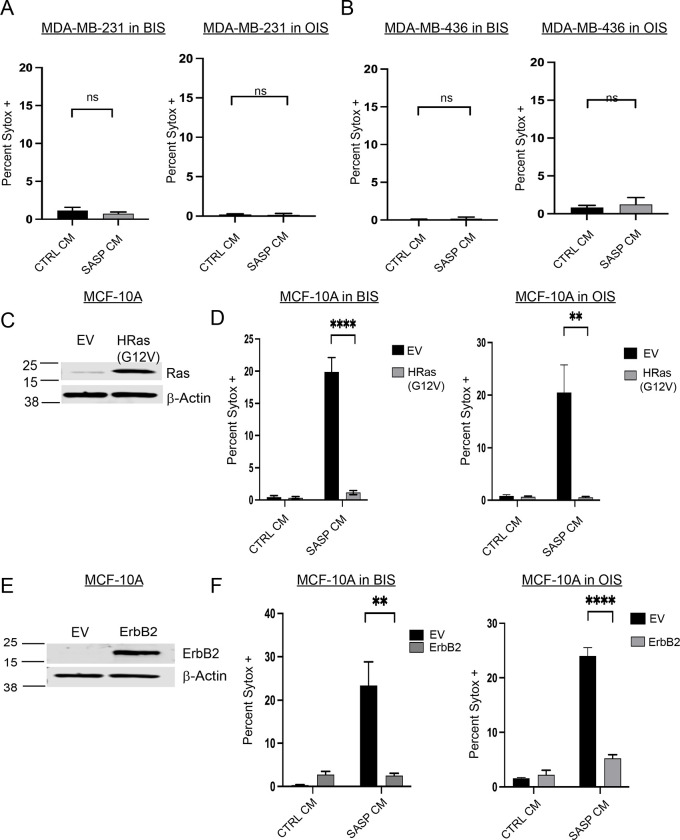
In normal tissue homeostasis, bidirectional communication between different cell types can shape numerous biological outcomes. Many studies have documented instances of reciprocal communication between fibroblasts and cancer cells that functionally change cancer cell behavior. However, less is known about how these heterotypic interactions shape epithelial cell function in the absence of oncogenic transformation. Furthermore, fibroblasts are prone to undergo senescence, which is typified by an irreversible cell cycle arrest. Senescent fibroblasts are also known to secrete various cytokines into the extracellular space; a phenomenon that is termed the senescence-associated secretory phenotype (SASP). While the role of fibroblast derived SASP factors on cancer cells has been well studied, the impact of these factors on normal epithelial cells remains poorly understood. We discovered that treatment of normal mammary epithelial cells with conditioned media (CM) from senescent fibroblasts (SASP CM) results in a caspase-dependent cell death. This capacity of SASP CM to cause cell death is maintained across multiple senescence-inducing stimuli. However, the activation of oncogenic signaling in mammary epithelial cells mitigates the ability of SASP CM to induce cell death. Despite the reliance of this cell death on caspase activation, we discovered that SASP CM does not cause cell death by the extrinsic or intrinsic apoptotic pathway. Instead, these cells die by an NLRP3, caspase-1, and gasdermin D (GSDMD)-dependent induction of pyroptosis. Taken together, our findings reveal that senescent fibroblasts can cause pyroptosis in neighboring mammary epithelial cells, which has implications for therapeutic strategies that perturb the behavior of senescent cells.


Conflict of interest statement

Conflict of interest

The authors declare that they have no conflicts of interest with the contents of this article.

Figures

Figure 1:
Figure 1:. SASP CM from BIS fibroblasts causes cell death in normal mammary epithelial cells.
(A) BJ fibroblasts were stained for Senescence-Associated β-Galactosidase (SA-β-Gal) activity to confirm the induction of senescence in BJ fibroblasts treated with DMSO or bleomycin. Images were taken at 10X in brightfield. Scale bar 100μm. (B) Cell lysates from BJ fibroblasts treated with DMSO or bleomycin were immunoblotted for lamin B1 protein levels as a marker for senescence induction. (C) qRT-PCR was performed to measure the relative mRNA levels of IL-6 and IL-8 in BJ fibroblasts treated with either DMSO or bleomycin to validate SASP induction. n=3 (D) (Left) Representative immunofluorescence images of MCF-10A cells treated with CTRL or SASP conditioned media (CM) from bleomycin induced senescent (BIS) fibroblasts and stained with Hoechst and SYTOX Green. Images were taken at 10X and scale bar is 100μm. z-VAD-fmk treatment was included to assess the impact of caspase activation on the abundance of SYTOX Green positive cells. (Right) Quantification of images represented as the percentage of SYTOX Green positive cells out of the total number of cells was depicted. (E) KTB-37 cells were treated with CTRL, SASP CM or SASP CM+z-VAD-fmk collected from BIS BJ fibroblasts. Quantification represented as the percentage of SYTOX Green positive cells out of the total number of cells was depicted. (F) HMEC cells were treated with CTRL, SASP CM or SASP CM+z-VAD-fmk collected from BIS BJ fibroblasts. Quantification represented as the percentage of SYTOX Green positive cells out of the total number of cells was depicted. Unpaired two-tail t-test was performed for qRT-PCR data where * p<0.05, ****p<.0001, ***p<.001. Data are presented as mean +/− SEM. SYTOX data was analyzed by one-way ANOVA followed by Tukey comparison test. Graphs are representative data collected from a minimum of three biological replicates.
Figure 2:
Figure 2:. SASP CM from OIS fibroblasts causes cell death in normal mammary epithelial cells.
(A) BJ fibroblasts were stained for SA-β-Gal activity to confirm the induction of senescence in BJ fibroblasts engineered to undergo oncogene-induced senescence (OIS) through overexpression of HRas (G12V). Empty vector (EV) control is also included. Representative images were taken at 10X in brightfield and scale bar is 100μm. (B) Cell lysates from BJ fibroblasts with EV or HRas (G12V) were immunoblotted for Ras or lamin B1 protein levels as a marker for senescence induction. (C) qRT-PCR was performed to measure the relative mRNA levels of IL-6 and IL-8 in BJ fibroblasts engineered to overexpress EV or HRas (G12V). n=3 (D) Representative immunofluorescence images of MCF-10A cells treated with CTRL or SASP conditioned media (CM) from OIS fibroblasts stained with Hoechst and SYTOX green. Images were taken at 10X and the scale bar is 100μm. Quantification of images represented as the percentage of SYTOX Green positive cells out of the total number of cells was depicted. (E) KTB-37 cells treated with CTRL or SASP conditioned media (CM) from OIS were stained with Hoechst and SYTOX Green. Quantification of images represented as the percentage of SYTOX Green positive cells out of the total number of cells was depicted. (F) HMEC cells treated with CTRL or SASP conditioned media (CM) from OIS stained with Hoechst and SYTOX Green. Quantification of images represented as the percentage of SYTOX Green positive cells out of the total number of cells was depicted. Unpaired two-tail t-test was performed for qRT-PCR data where ns is no statistical significance, * p<0.05, ** p<0.01, ****p<.0001 and ***p<.001. Data are presented as mean +/− SEM. Sytox data was analyzed by one-way ANOVA followed by Tukey comparison test. Graphs are representative data collected from a minimum of three biological replicates.
Figure 3:
Figure 3:. Breast cancer cells are resistant to SASP CM induced cell death.
(A,B) MDA-MB-231 (A) and MDA-MB-436 (B) breast cancer cell lines were treated with CTRL or SASP CM collected from BIS or OIS fibroblasts and imaged using immunofluorescence microscopy. Cells were stained with Hoechst and SYTOX Green. Quantification of the percentage of SYTOX Green positive cells out of the total number of cells was depicted. (C) MCF-10A cells were engineered to overexpress either empty vector (EV) or the oncogene HRas (G12V). Overexpression was validated by immunoblot. (D) MCF-10A EV and HRas (G12V) overexpressing cells were treated with CTRL or SASP CM collected from BIS or OIS fibroblasts and imaged using immunofluorescence microscopy. Cells were stained with Hoechst and SYTOX Green. Quantification of the percentage of SYTOX Green positive cells out of the total number of cells was depicted. (E) MCF-10A cells were engineered to overexpress either EV or the oncogene ErbB2. Overexpression was validated by immunoblot. (F) MCF-10A EV and ErbB2 overexpressing cells were treated with CTRL or SASP CM collected from BIS or OIS fibroblasts and imaged using immunofluorescence microscopy. Cells were stained with Hoechst and SYTOX Green. Quantification of the percentage of SYTOX Green positive cells out of the total number of cells was depicted. SYTOX data were analyzed by one-way ANOVA followed by Tukey comparison test where ns is so statistical significance, * p<0.05, ** p<0.01, *** p<0.001 and **** p<0.0001. Data are presented as mean +/− SEM. Graphs are representative data collected from a minimum of three biological replicates. Isogenic manipulations were analyzed by two-way ANOVA followed by Tukey comparison test. Data are presented as mean +/− SEM. Graphs are representative data collected from a minimum of three biological replicates.
Figure 4:
Figure 4:. SASP CM-induced cell death is independent of the intrinsic and extrinsic apoptotic pathways
(A) MCF-10A cells were engineered to express EV or Bcl-2. 10A-EV and 10A-Bcl-2 cell lysates were immunoblotted to validate Bcl-2 overexpression. To confirm that the Bcl-2 overexpression is functional, both 10A-EV and 10A-Bcl-2 cells were treated with the staurosporine (STS) and probed for the cleavage of PARP, a marker of apoptosis. (B) 10A-EV and 10A-Bcl-2 cells were treated with CTRL or SASP CM collected from BIS or OIS fibroblasts were imaged using immunofluorescence microscopy. Cells were stained with Hoechst and SYTOX Green. Quantification of the percentage of SYTOX Green positive cells out of the total number of cells was depicted. (C) MCF-10A cells were engineered with shRNA against caspase-8 and immunoblotted to validate the reduction in caspase-8 protein. (D) Control or caspase-8 shRNA transduced cells were treated with CTRL or SASP CM from BIS or OIS and imaged using immunofluorescence microscopy. Cells were stained with Hoechst and SYTOX Green. Quantification of the percentage of SYTOX Green positive cells out of the total number of cells was depicted. SYTOX data were analyzed by two-way ANOVA followed by Tukey comparison test where ns is no statistical significance, * p<.05, ** p<0.01, *** p<0.001 and **** p<0.0001. Data are presented as mean +/− SEM. Graphs are representative data collected from a minimum of three biological replicates.
Figure 5:
Figure 5:. SASP CM causes cell death by pyroptosis
(A) MCF-10A cells were treated with CTRL or SASP CM collected from BIS or OIS fibroblasts with or without MCC950 (10uM), an NLRP3 inhibitor. Cells were imaged using immunofluorescence microscopy. Images were taken at 10X and the scale bar is 100μm. Cells were stained with Hoechst and SYTOX Green. Quantification of the percentage of SYTOX Green positive cells out of the total number of cells was depicted. (B) MCF-10A cells were engineered using shRNA against caspase-1 and immunoblotted to validate the reduction in caspase-1 protein. (C) EV Control or caspase-1 shRNA transduced cells were treated with CTRL or SASP CM from BIS or OIS and imaged using immunofluorescence microscopy. Cells were stained with Hoechst and SYTOX Green. Quantification of the percentage of SYTOX Green positive cells out of the total number of cells was depicted. (D) MCF-10A cells were engineered using shRNA against GSDMD and immunoblotted to validate the reduction in GSDMD protein. (E) EV Control or GSDMD shRNA transduced cells were treated with CTRL or SASP CM from BIS or OIS and imaged using immunofluorescence microscopy. Cells were stained with Hoechst and SYTOX Green. Quantification of the percentage of SYTOX Green positive cells out of the total number of cells was depicted. Sytox data was analyzed by two-way ANOVA followed by Tukey comparison test where ns is no statistical significance, * p<.05, ** p<0.01, *** p<0.001 and **** p<0.0001. Data are presented as mean +/− SEM. Graphs are representative data collected from a minimum of three biological replicates.

References

    1. Buess M., Nuyten D. S., Hastie T., Nielsen T., Pesich R., and Brown P. O. (2007) Characterization of heterotypic interaction effects in vitro to deconvolute global gene expression profiles in cancer. Genome Biol 8, R191. - PMC - PubMed
    1. Song L., Yan Y., Marzano M., and Li Y. (2019) Studying Heterotypic Cell−Cell Interactions in the Human Brain Using Pluripotent Stem Cell Models for Neurodegeneration. Cells 8 - PMC - PubMed
    1. Armingol E., Officer A., Harismendy O., and Lewis N. E. (2021) Deciphering cell-cell interactions and communication from gene expression. Nat Rev Genet 22, 71–88 - PMC - PubMed
    1. Parrinello S., Noon L. A., Harrisingh M. C., Wingfield Digby P., Rosenberg L. H., Cremona C. A., Echave P., Flanagan A. M., Parada L. F., and Lloyd A. C. (2008) NF1 loss disrupts Schwann cell-axonal interactions: a novel role for semaphorin 4F. Genes Dev 22, 3335–3348 - PMC - PubMed
    1. Szekanecz Z., and Koch A. E. (2016) Successes and failures of chemokine-pathway targeting in rheumatoid arthritis. Nat Rev Rheumatol 12, 5–13 - PubMed

Publication types