

This is a preprint.
Differentially Expressed Heterogeneous Overdispersion Genes Testing for Count Data
- PMID: 36865247
- PMCID: PMC9980115
- DOI: 10.1101/2023.02.21.529455
Differentially Expressed Heterogeneous Overdispersion Genes Testing for Count Data
Update in
-
Differentially expressed heterogeneous overdispersion genes testing for count data.PLoS One. 2024 Jul 17;19(7):e0300565. doi: 10.1371/journal.pone.0300565. eCollection 2024. PLoS One. 2024. PMID: 39018275 Free PMC article.
Abstract
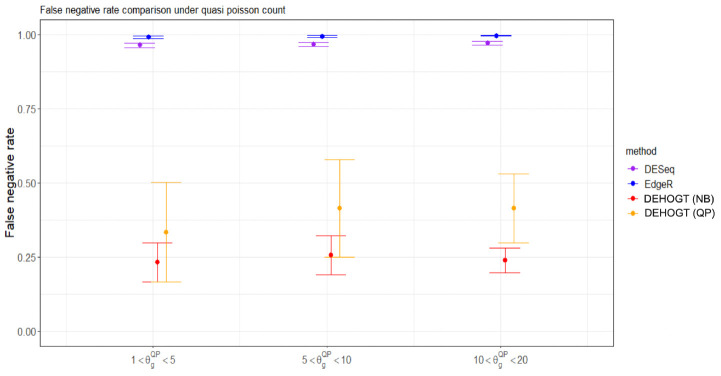
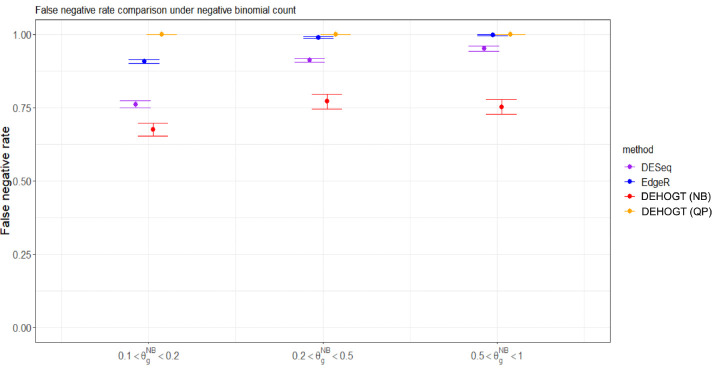
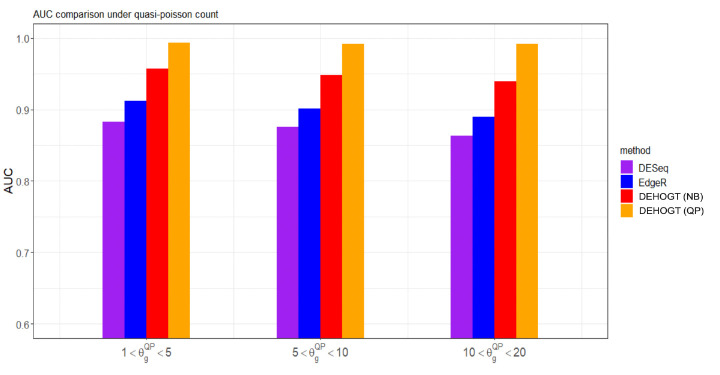
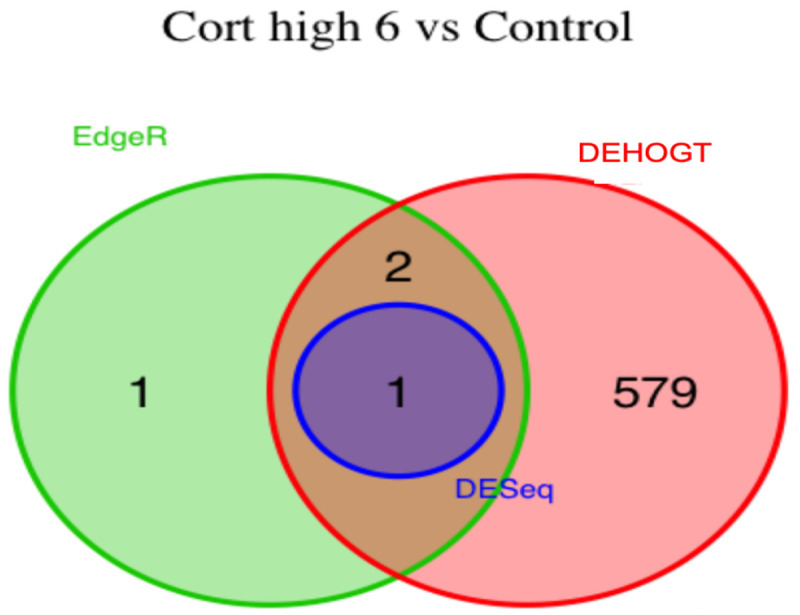
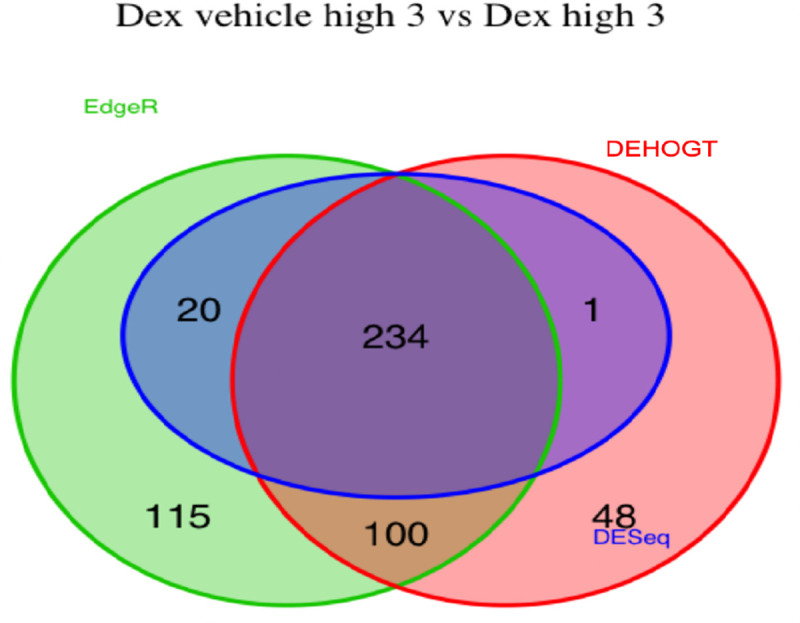
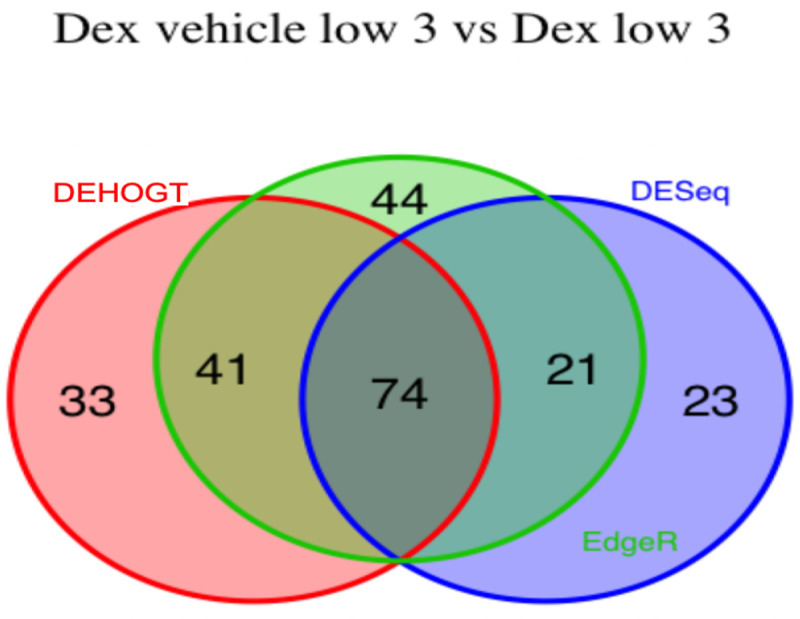
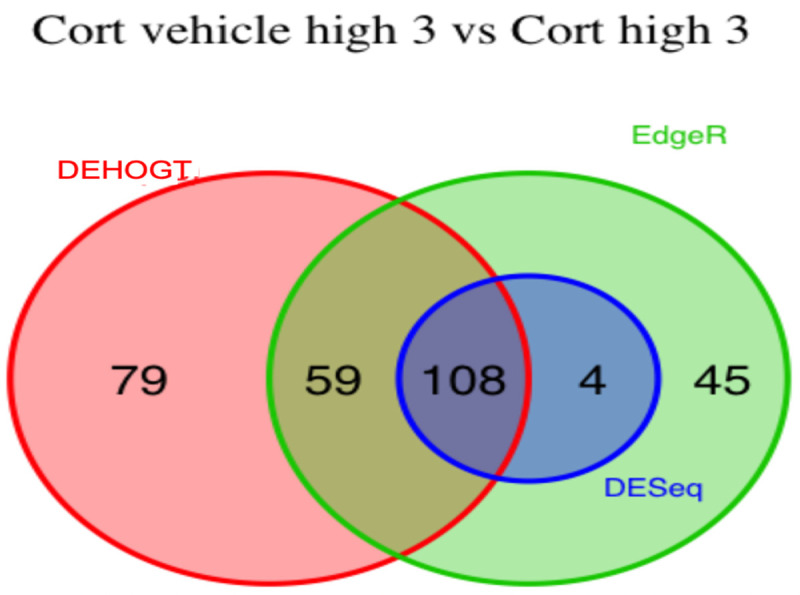
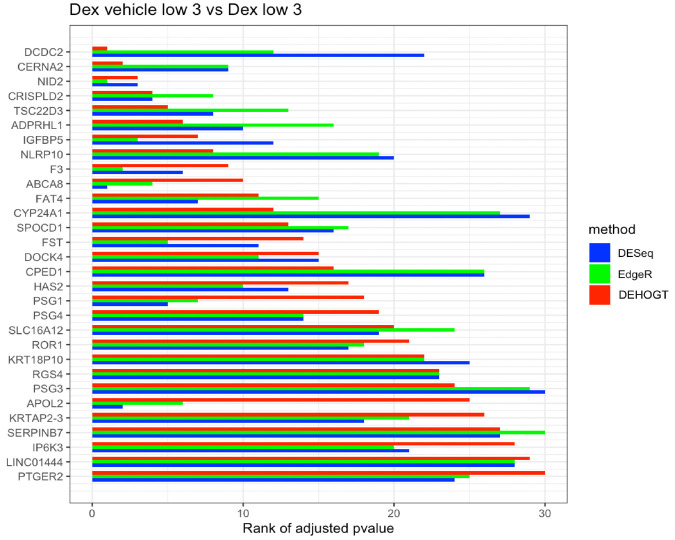
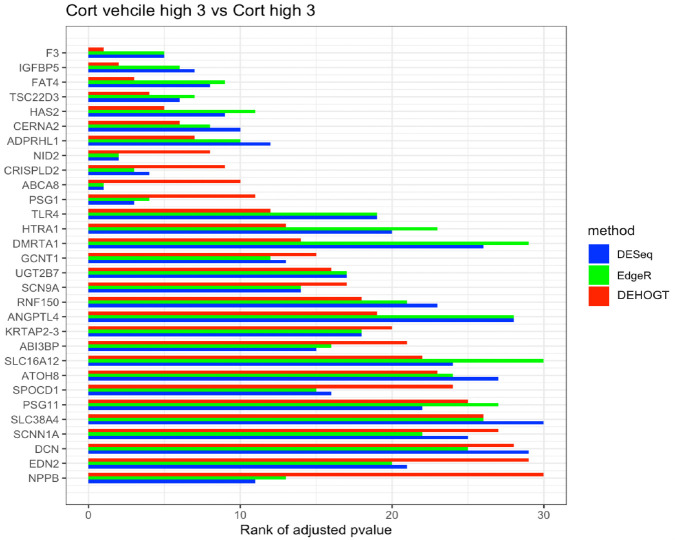
The mRNA-seq data analysis is a powerful technology for inferring information from biological systems of interest. Specifically, the sequenced RNA fragments are aligned with genomic reference sequences, and we count the number of sequence fragments corresponding to each gene for each condition. A gene is identified as differentially expressed (DE) if the difference in its count numbers between conditions is statistically significant. Several statistical analysis methods have been developed to detect DE genes based on RNA-seq data. However, the existing methods could suffer decreasing power to identify DE genes arising from overdispersion and limited sample size. We propose a new differential expression analysis procedure: heterogeneous overdispersion genes testing (DEHOGT) based on heterogeneous overdispersion modeling and a post-hoc inference procedure. DEHOGT integrates sample information from all conditions and provides a more flexible and adaptive overdispersion modeling for the RNA-seq read count. DEHOGT adopts a gene-wise estimation scheme to enhance the detection power of differentially expressed genes. DEHOGT is tested on the synthetic RNA-seq read count data and outperforms two popular existing methods, DESeq and EdgeR, in detecting DE genes. We apply the proposed method to a test dataset using RNAseq data from microglial cells. DEHOGT tends to detect more differently expressed genes potentially related to microglial cells under different stress hormones treatments.
Keywords: Differential expression; Gene expression; Generalized linear modeling; RNA-Seq data.
Figures


Similar articles
-
Differentially expressed heterogeneous overdispersion genes testing for count data.PLoS One. 2024 Jul 17;19(7):e0300565. doi: 10.1371/journal.pone.0300565. eCollection 2024. PLoS One. 2024. PMID: 39018275 Free PMC article.
-
Comparison of normalization and differential expression analyses using RNA-Seq data from 726 individual Drosophila melanogaster.BMC Genomics. 2016 Jan 5;17:28. doi: 10.1186/s12864-015-2353-z. BMC Genomics. 2016. PMID: 26732976 Free PMC article.
-
Getting the most out of RNA-seq data analysis.PeerJ. 2015 Oct 29;3:e1360. doi: 10.7717/peerj.1360. eCollection 2015. PeerJ. 2015. PMID: 26539333 Free PMC article.
-
A comparison of statistical methods for detecting differentially expressed genes from RNA-seq data.Am J Bot. 2012 Feb;99(2):248-56. doi: 10.3732/ajb.1100340. Epub 2012 Jan 20. Am J Bot. 2012. PMID: 22268221 Review.
-
Statistical detection of differentially expressed genes based on RNA-seq: from biological to phylogenetic replicates.Brief Bioinform. 2016 Mar;17(2):243-8. doi: 10.1093/bib/bbv035. Epub 2015 Jun 24. Brief Bioinform. 2016. PMID: 26108230 Review.
References
-
- Appel K., Schwahn C., Mahler J., Schulz A., Spitzer C., Fenske K., Stender J., Barnow S., John U., Teumer A., et al. (2011). Moderation of adult depression by a polymorphism in the FKBP5 gene and childhood physical abuse in the general population. Neuropsychopharmacology, 36(10):1982–1991. - PMC - PubMed
-
- Benjamini Y. and Hochberg Y. (1995). Controlling the false discovery rate: a practical and powerful approach to multiple testing. Journal of the Royal statistical society: series B (Methodological), 57(1):289–300.
-
- Binder E. B. (2009). The role of FKBP5, a co-chaperone of the glucocorticoid receptor in the pathogenesis and therapy of affective and anxiety disorders. Psychoneuroendocrinology, 34:S186–S195. - PubMed
-
- Blois S. M., Sulkowski G., Tirado-González I., Warren J., Freitag N., Klapp B. F., Rifkin D., Fuss I., Strober W., and Dveksler G. S. (2014). Pregnancy-specific glycoprotein 1 (PSG1) activates TGF-β and prevents dextran sodium sulfate (DSS)-induced colitis in mice. Mucosal Immunology, 7(2):348–358. - PMC - PubMed
Publication types
Grants and funding
LinkOut - more resources
Full Text Sources