[Preprint]. 2023 Dec 23:2023.02.22.529531.
doi: 10.1101/2023.02.22.529531.

A latent clinical-anatomical dimension relating metabolic syndrome to brain structure and cognition

Affiliations

A latent clinical-anatomical dimension relating metabolic syndrome to brain structure and cognition

Marvin Petersen et al. bioRxiv. .

Update in

Abstract

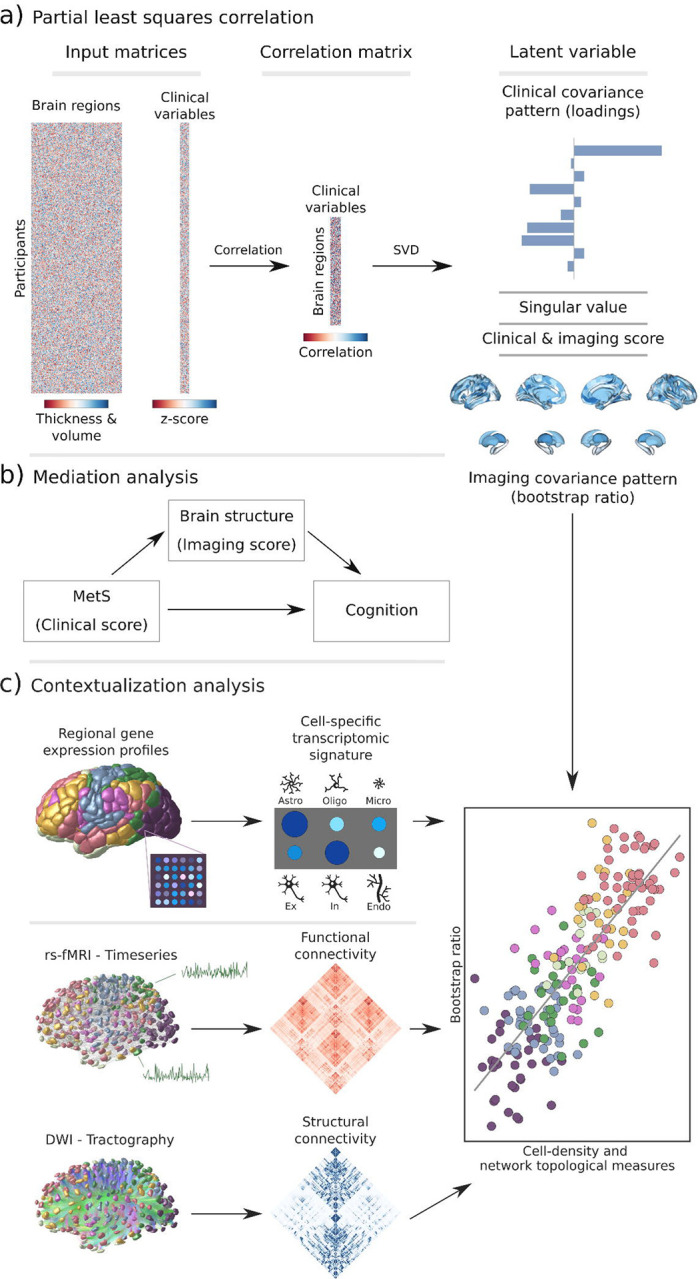
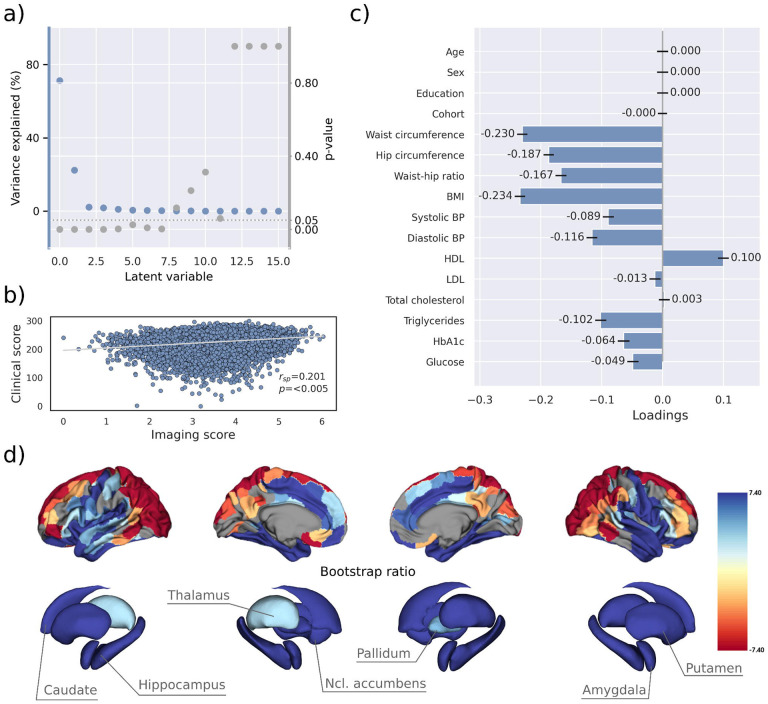
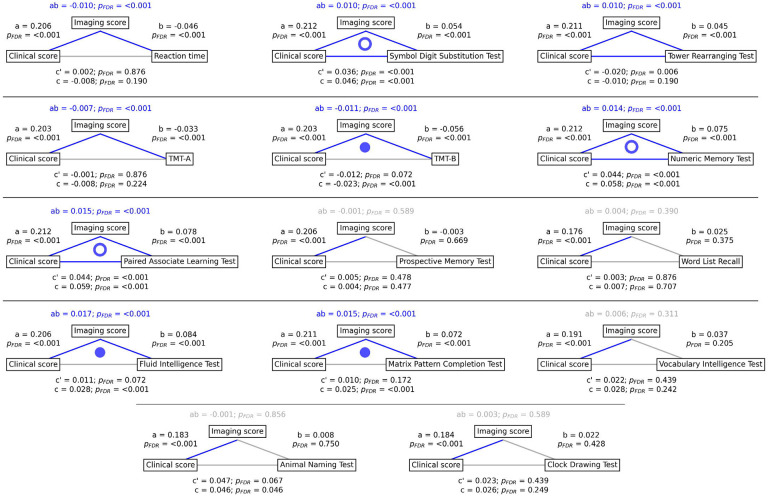
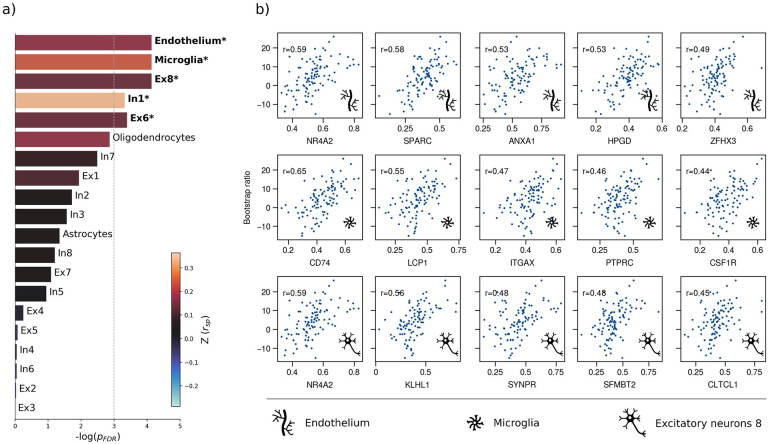
The link between metabolic syndrome (MetS) and neurodegenerative as well cerebrovascular conditions holds substantial implications for brain health in at-risk populations. This study elucidates the complex relationship between MetS and brain health by conducting a comprehensive examination of cardiometabolic risk factors, cortical morphology, and cognitive function in 40,087 individuals. Multivariate, data-driven statistics identified a latent dimension linking more severe MetS to widespread brain morphological abnormalities, accounting for up to 71% of shared variance in the data. This dimension was replicable across sub-samples. In a mediation analysis we could demonstrate that MetS-related brain morphological abnormalities mediated the link between MetS severity and cognitive performance in multiple domains. Employing imaging transcriptomics and connectomics, our results also suggest that MetS-related morphological abnormalities are linked to the regional cellular composition and macroscopic brain network organization. By leveraging extensive, multi-domain data combined with a dimensional stratification approach, our analysis provides profound insights into the association of MetS and brain health. These findings can inform effective therapeutic and risk mitigation strategies aimed at maintaining brain integrity.


Conflict of interest statement

JG has received speaker fees from Lundbeck, Janssen-Cilag, Lilly, Otsuka and Boehringer outside the submitted work. JF reported receiving personal fees from Acandis, Cerenovus, Microvention, Medtronic, Phenox, and Penumbra; receiving grants from Stryker and Route 92; being managing director of eppdata; and owning shares in Tegus and Vastrax; all outside the submitted work. GT has received fees as consultant or lecturer from Acandis, Alexion, Amarin, Bayer, Boehringer Ingelheim, BristolMyersSquibb/Pfizer, Daichi Sankyo, Portola, and Stryker outside the submitted work. TZ and RT are listed as co-inventors of an international patent on the use of a computing device to estimate the probability of myocardial infarction (PCT/EP2021/073193, International Publication Number WO2022043229A1). TZ and RT are shareholders of the company ART-EMIS GmbH Hamburg. The remaining authors declare no conflicts of interest.

Figures

Figure 1.
Figure 1.. Methodology.
a) Illustration of the partial least squares correlation analysis. Starting from two input matrices containing per-subject information of regional morphological measures as well as clinical data (demographic and MetS-related risk factors) a correlation matrix is computed. This matrix is subsequently subjected to singular value decomposition resulting in a set of mutually orthogonal latent variables. Latent variables each consist of a left singular vector (here, clinical covariance profile), singular value and right singular vector (here, imaging covariance profile). In addition, subject-specific clinical and imaging scores are computed. b) The interplay between MetS, brain structure and cognition was investigated in a post-hoc mediation analysis. We tested whether the relationship between the clinical score, representing MetS severity, and different cognitive test performances was statistically mediated by the imaging score. c) Contextualization analysis. Upper row: based on microarray gene expression data, the densities of different cell populations across the cortex were quantified. Middle and lower row: based on functional and structural group-consensus connectomes based on data from the Human Connectome Project, metrics of functional and structural brain network topology were derived. Cell density as well as connectomic measures were related to the bootstrap ratio via spatial correlations. Modified from Petersen et al. and Zeighami et al. [33,82]. Abbreviations: Astro – astrocytes; DWI – diffusion-weighted magnetic resonance imaging; Endo – endothelial cells; Ex – excitatory neuron populations (Ex1–8); In – inhibitory neuron populations (In1–8); Micro – microglia; Oligo – oligodendrocytes; rs-fMRI – resting-state functional magnetic resonance imaging; SVD – singular value decomposition.
Figure 2.
Figure 2.. Partial least squares (PLS) analysis.
a) Explained variance and p-values of latent variables. b) Scatter plot relating subject-specific clinical and imaging PLS scores. Higher scores indicate higher adherence to the respective covariance profile. c) Clinical covariance profile. 95% confidence intervals were calculated via bootstrap resampling. Note that confound removal for age, sex, education and cohort was performed prior to the PLS. d) Imaging covariance profile represented by bootstrap ratio. A high positive or negative bootstrap ratio indicates high contribution of a brain region to the overall covariance profile. Vertices with a significant bootstrap ratio (> 1.96 or < −1.96) are highlighted by colors. Abbreviations: - Spearman correlation coefficient.
Figure 3.
Figure 3.. Mediation analysis results.
Mediation effects of subject-specific imaging PLS scores on the relationship between MetS represented by the clinical PLS score and cognitive test performances. Path plots display standardized effects and p-values: (a) clinical score to imaging score, (b) imaging score to cognitive score, (ab) indirect effect (c’) direct effect and (c) total effect. Significant paths are highlighted in blue; non-significant in light gray. If the indirect effect ab was significant, the text for ab is highlighted in blue. A blue dot in the path plot indicates if a relationship is significantly mediated, i.e., the indirect effect ab was significant and the direct effect c’ was reduced or non-significant compared to the total effect c. An empty dot indicates a partial mediation, a full dot indicates a full mediation. Abbreviations: - false discovery rate-corrected p-values; PLS – partial least squares correlation; TMT-A – Trail Making Test A; TMT-B – Trail Making Test B.
Figure 4.
Figure 4.. Virtual histology analysis.
The correspondence between MetS effects (bootstrap ratio) and cell type-specific gene expression profiles was examined via an ensemble-based gene category enrichment analysis. a) Barplot displaying spatial correlation results. The bar height displays the significance level. Colors encode the aggregate z-transformed Spearman correlation coefficient relating the Schaefer100-parcellated bootstrap ratio and respective cell population densities. Asterisks indicate statistical significance. The significance threshold of <.05 is highlighted by a vertical dashed line. b) Scatter plots illustrating spatial correlations between MetS effects and exemplary cortical gene expression profiles per cell population significantly associated across analyses – i.e., endothelium, microglia and excitatory neurons type 8. Top 5 genes most strongly correlating with the bootstrap ratio map were visualized for each of these cell populations. Icons in the bottom right of each scatter plot indicate the corresponding cell type. A legend explaining the icons is provided at the bottom. First row: endothelium; second row: microglia; third row: excitatory neurons type 8. Virtual histology analysis results for the bootstrap ratios of latent variables 2 and 3 are shown in supplementary figure S21. A corresponding plot illustrating the contextualization of the t-statistic derived from group statistics is shown in supplementary figure S22. Abbreviations: – log(pFDR) – negative logarithm of the false discovery rate-corrected p-value derived from spatial lag models [36,41]; r – Spearman correlation coeffient. Z(rsp) – aggregate z-transformed Spearman correlation coefficient.
Figure 5.
Figure 5.. Brain network contextualization.
Spatial correlation results derived from relating Schaefer400×7-parcellated maps of MetS effects (bootstrap ratio) to network topological indices (red: functional connectivity, blue: structural connectivity). Scatter plots that illustrate the spatial relationship are supplemented by respective surface plots for anatomical localization. The color coding of cortical regions and associated dots corresponds. a) & b) Functional and structural degree centrality rank. c) & d) Functional and structural neighborhood abnormality. e) & f) Intrinsic functional network hierarchy represented by functional connectivity gradients 1 and 2. Complementary results concerning t-statistic maps derived from group comparisons between MetS subjects and controls are presented in supplementary figure S24. Corresponding results after reperforming the analysis with HCHS derived group-consensus connectomes are presented in supplementary figure S25. Abbreviations: HCHS – Hamburg City Health Study; prewire - p-value derived from network rewiring [47]; psmash - p-value derived from brainSMASH surrogates [46]; pspin - p-value derived from spin permutation results [45]; rsp - Spearman correlation coefficient.

References

    1. Alberti KGMM, Zimmet P, Shaw J. Metabolic syndrome--a new world-wide definition. A Consensus Statement from the International Diabetes Federation. Diabet Med 2006;23:469–80. 10.1111/j.1464-5491.2006.01858.x. - DOI - PubMed
    1. Aguilar M, Bhuket T, Torres S, Liu B, Wong RJ. Prevalence of the metabolic syndrome in the United States, 2003–2012. JAMA 2015;313:1973–4. 10.1001/jama.2015.4260. - DOI - PubMed
    1. Scuteri A, Laurent S, Cucca F, Cockcroft J, Cunha PG, Mañas LR, et al. Metabolic syndrome across Europe: different clusters of risk factors. Eur J Prev Cardiol 2015;22:486–91. 10.1177/2047487314525529. - DOI - PMC - PubMed
    1. Beltrán-Sánchez H, Harhay MO, Harhay MM, McElligott S. Prevalence and trends of metabolic syndrome in the adult U.S. population, 1999–2010. J Am Coll Cardiol 2013;62:697–703. 10.1016/j.jacc.2013.05.064. - DOI - PMC - PubMed
    1. Boden-Albala B, Sacco RL, Lee H-S, Grahame-Clarke C, Rundek T, Elkind MV, et al. Metabolic Syndrome and Ischemic Stroke Risk. Stroke 2008;39:30–5. 10.1161/STROKEAHA.107.496588. - DOI - PMC - PubMed

Publication types