[Preprint]. 2023 Feb 23:2023.02.22.529581.
doi: 10.1101/2023.02.22.529581.

A cell state specific metabolic vulnerability to GPX4-dependent ferroptosis in glioblastoma

Affiliations

A cell state specific metabolic vulnerability to GPX4-dependent ferroptosis in glioblastoma

Matei A Banu et al. bioRxiv. .

Update in

  • A cell state-specific metabolic vulnerability to GPX4-dependent ferroptosis in glioblastoma.
    Banu MA, Dovas A, Argenziano MG, Zhao W, Sperring CP, Cuervo Grajal H, Liu Z, Higgins DM, Amini M, Pereira B, Ye LF, Mahajan A, Humala N, Furnari JL, Upadhyayula PS, Zandkarimi F, Nguyen TT, Teasley D, Wu PB, Hai L, Karan C, Dowdy T, Razavilar A, Siegelin MD, Kitajewski J, Larion M, Bruce JN, Stockwell BR, Sims PA, Canoll P. Banu MA, et al. EMBO J. 2024 Oct;43(20):4492-4521. doi: 10.1038/s44318-024-00176-4. Epub 2024 Aug 27. EMBO J. 2024. PMID: 39192032 Free PMC article.

Abstract

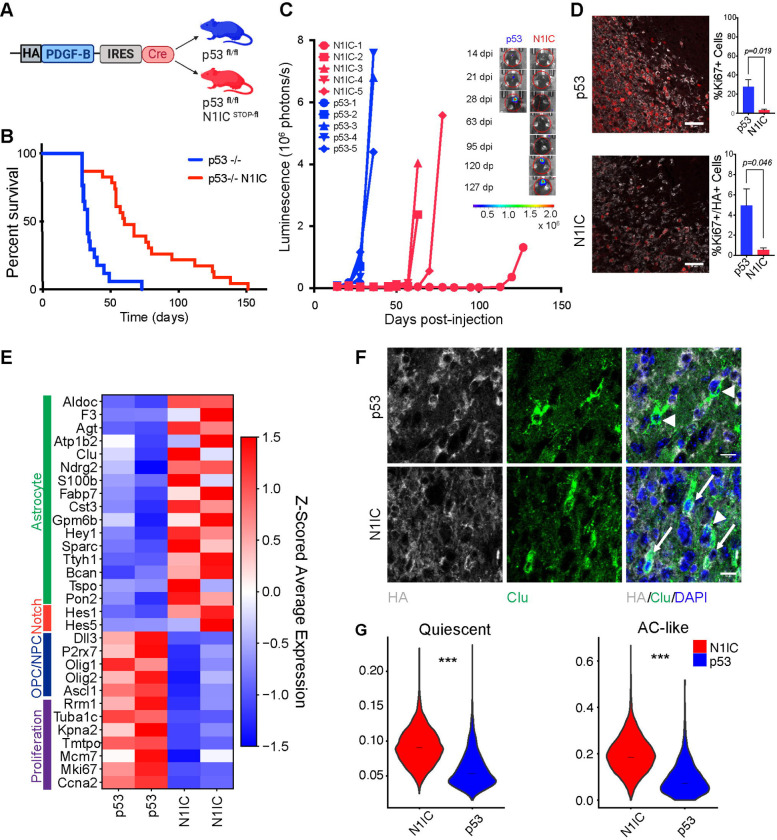
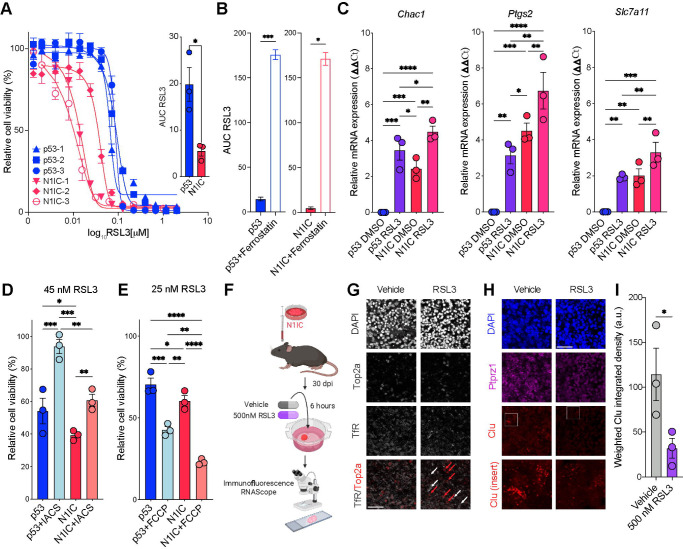
Glioma cells hijack developmental transcriptional programs to control cell state. During neural development, lineage trajectories rely on specialized metabolic pathways. However, the link between tumor cell state and metabolic programs is poorly understood in glioma. Here we uncover a glioma cell state-specific metabolic liability that can be leveraged therapeutically. To model cell state diversity, we generated genetically engineered murine gliomas, induced by deletion of p53 alone (p53) or with constitutively active Notch signaling (N1IC), a pathway critical in controlling cellular fate. N1IC tumors harbored quiescent astrocyte-like transformed cell states while p53 tumors were predominantly comprised of proliferating progenitor-like cell states. N1IC cells exhibit distinct metabolic alterations, with mitochondrial uncoupling and increased ROS production rendering them more sensitive to inhibition of the lipid hydroperoxidase GPX4 and induction of ferroptosis. Importantly, treating patient-derived organotypic slices with a GPX4 inhibitor induced selective depletion of quiescent astrocyte-like glioma cell populations with similar metabolic profiles.

Keywords: Astrocyte; Cell-state; Ferroptosis; Glioblastoma; Metabolism; Quiescent.


Conflict of interest statement

Declaration of interests: The authors declare no competing interests.

Figures

Figure 1:
Figure 1:. Notch-driven murine glioma model of a quiescent astrocyte-like tumor cell state
A. Schematic depicting genetically engineered murine glioma models with or without Notch activation. PDGF-B IRES Cre retrovirus was injected in the corpus callosum of p53fl/fl or p53fl/fl N1ICSTOP-fl mice at 6 weeks. B. Survival curve for the two glioma models. Survival was significantly longer in p53 −/− N1IC mice compared to p53 −/− only mice (p<0.0001 by Mantel Cox Log rank test). Note the significant variability in survival for N1IC mice (29–151 days survival). C. Serial IVIS imaging demonstrating increased latency in signal detection and tumor formation in N1IC tumors compared to p53 tumors with subsequent sharp increase in bioluminescence and aggressive tumor growth. Inset demonstrates representative IVIS images for one mouse from each model. Also refer to Supplementary Figure S1. D. Representative immunofluorescence images of Ki67 and HA in N1IC and p53 endstage tumors. Quantification of Ki67+ cells and Ki67/HA double + cells demonstrating a decreased proliferative transformed population in N1IC tumors as well as an increased recruited proliferative population in p53 tumors. Bar graph shows mean proportions ± SEM. p=0.019 (%Ki67+ cells) and p=0.048 (%Ki67+/HA+ cells) by Welch’s t test, data pooled from n=6 p53/n=4 N1IC animals. Scale bar, 50 μm. E. Heatmap showing the expression of selected glioma cell state markers as well as Notch canonical downstream targets and proliferation genes in the p53 and N1IC transformed populations, as derived from scRNA-seq of the retrovirus induced tumors (n=2 from each model). Significantly differentially expressed genes are reported in Table S1. Also refer to Supplementary Figure S1 and Table S2 for direct N1ICD targets. F. Representative immunofluorescence of Clu/HA demonstrating double positive transformed astrocytic tumor cells only in the N1IC model (arrows) with presence of Clu+/HA- non-transformed tumor-associated astrocytes in both models (arrow heads). Scale bar, 10 μm. G. Violin plots of AUCell scores of the AC-like cell state and quiescence gene signatures in tumor cells from the two models. ***p<0.001 Welch’s t test
Figure 2:
Figure 2:. Multi-omic analysis reveals differences in metabolic programs between N1IC and p53 cells
A. Bar graph depicting significant metabolic gene ontologies in the two models via GSEA. NES – normalized enrichment score. Full list of transcriptional metabolic programs provided in Table S3. B. Schematic diagram depicting workflow for multi-omic analysis including functional studies, metabolic and lipidomic LC-MS analysis of cell lines isolated from the two models. Also refer to Supplementary Figure S2 for further characterization of isolated cell lines. C. PCA analysis based on untargeted metabolomics performed on p53 and N1IC cells lines demonstrating separation of models based on metabolic profile. D. Bar graph demonstrating log2FC of significant differentially enriched metabolites in N1IC and p53 cells. P-values provided in Table S4. Also refer to Supplementary Figure S3 for in depth description of N1IC metabolic pathways based on integrated transcriptomic and metabolomic data. E. Heatmap of differentially enriched lipid species in p53 and N1IC cells in both the positive and negative mode. Scale bar represents Z-scored average concentration of distinct lipid species normalized by protein concentration. FDR-corrected P-values and lipid ontology analysis provided in Table S5 and Supplementary Figure S3. F. Flow cytometry of BODIPY-C11 fluorescence demonstrating higher lipid peroxidation in N1IC vs. p53 cells at baseline. Representative experiment of n=4 independent experiments. G. Percent BODIPY+ cells in p53 and N1IC cells and effects of ferroptosis inhibitor Ferrostatin-1 in reversing baseline lipid peroxidation. Representative experiment of n=3 independent experiments. H. Quantification of GSH levels in the same pair of p53 and N1IC cells by GSH fluorometric assay. Data pooled from n=4 independent experiments, p=0.039 by unpaired two tailed t-test. I. PCR of Chac1, ferroptosis marker involved in GSH degradation and Notch receptor inhibition, demonstrating higher expression in a N1IC cell line compared to a p53 cell line. Data pooled from n=3 independent experiments, p=0.0184 by unpaired two tailed t-test. J. Representative images acquired via SIM of MitoRED stained p53 and N1IC cells demonstrating differences in mitochondrial staining (red). DAPI stain (blue) labels nuclei and Phalloidin stain (magenta) labels filamentous actin. Scale bar, 5 μm. K. Bar plot showing mean ± SEM MitoRED ratios, data pooled from n=3 independent experiments, untreated p53 cells used as reference. p values calculated by Kruskal-Wallis test with Dunn’s multiple comparison test. *p < 0.05; **p < 0.01; ***p < 0.001. Also refer to Supplementary Figures S4 and S5 for characterization of the ETC and basal energetic metabolism in the two models.
Figure 3:
Figure 3:. Mitochondrial dependent differential sensitivity to Gpx4 inhibition and ferroptosis of the quiescent AC-like cell state
A. Representative RSL3 drug screen on n=3 p53 and N1IC independent cell lines, error bars represent SEM from three technical replicates. Inset: Bar graph depicting mean area under the curve (AUC) ± SEM for panel A, comparison by Welch’s t test. *p< 0.05 B. AUC from RSL3 dose response curves with and without Ferrostatin-1 in n=3 p53 cell lines and n=2 N1IC cell lines. Also refer to Supplementary Figure S6. C. PCR ΔΔCT values of ferroptosis markers in p53 and N1IC treated vs. untreated cell lines, data pooled from n=3 independent experiments. Normalized to actin, p53 DMSO used as reference. D. Combined drug screen using RSL3 and complex I inhibitor IACS-010759 demonstrating increased resistance to RSL3 with complete inhibition of the ETC and oxidative phosphorylation. 45 nM RSL3, 2 μM IACS, normalized to IACS. n=3 technical replicates. Representative experiment from n=3 independent experiments. E. Combined drug screen using RSL3 and mitochondrial uncoupling agent FCCP demonstrating increased sensitivity to RSL3 with uncoupling of oxidative phosphorylation. 25 nM RSL3, 2 μM FCCP, normalized to FCCP. n=3 technical replicates. Representative experiment from n=4 independent experiments. C, D, E: P-values calculated by two-way ANOVA correcting for multiple comparisons by controlling the FDR using the 2-stage linear step-up procedure of Benjamini, Krieger, and Yekutieli. *p < 0.05; **p < 0.01; ***p < 0.001, ****p < 0.0001. F. Schematic representation of experimental setup of murine organotypic slice cultures. 3 slices per condition (technical replicates) were generated from 3 different tumor bearing mice (biological replicates). Mice were sacrificed at 30 dpi. Treatment with 500 nM RSL3 or DMSO vehicle for 6 hours. G. Double immunofluorescence of proliferation marker Top2a and ferroptosis marker transferrin receptor (TfR) demonstrating lack of TfR staining in vehicle treated slices and upregulation of TfR after 500 nM RSL3 in Top2a negative non-proliferating cells. Red arrows mark Top2a+ cells, white arrows marking TfR+ cells. Scale bar, 50 μm. H. RNAScope of Ptprz (tumor marker - magenta) and Clu (astrocytic marker – red) after 500 nM RSL3 or DMSO vehicle demonstrating depletion of the Clu+ transformed cell population. Scale bar, 50 μm, insets 40×40 μm. I. Quantification of weighted integrated density on n=3 independent slice cultures. Bar graph depicting mean ± SEM, p=0.0185 by paired t-test.
Figure 4:
Figure 4:. RSL3 targets quiescent AC-like transformed cell populations in acute slice cultures from human glioma
A-F. UMAP embedding of scRNA-seq data from vehicle- and RSL3-treated slice cultures from six gliomas, including five primary GBMs and one primary IDH1 mutant adult-type diffuse glioma. A shows the cells annotated by treatment; control (Blue), RSL3 (Red). B shows the cells annotated by tumor. C shows cells annotated as non-tumor (green) or tumor (orange). D shows cells annotated by IDHmt (purple) or IDHwt (green). E and F show cells annotated by chromosomal copy number alterations. Also refer to Supplementary Figures S7 and S8 and Table S6–8. G. Normalized enrichment scores (NES) for glioma cell state-specific gene signatures comparing the vehicle treated vs. RSL3 treated slices for all 6 cases. H. NES for the astrocyte-like gene signature, comparing RSL3 treated vs. RSL3+Ferrostatin-1 treated slices for 3 of the 6 cases. I. Heatmap of the fold-change for each gene in the astrocyte-like gene signature across all six patients comparing the vehicle and RSL3 treated slices. J. GSEA of mitochondrial metabolic signatures comparing the transformed glioma cells in the vehicle and RSL3 treated slices. K. Normalized enrichment scores for the “N1IC_up” gene signature derived from the murine model comparing the vehicle treated vs. RSL3 treated slices for all 6 cases. Right panel depicts the same gene signature comparing RSL3 treated vs. RSL3+Ferrostatin-1 treated slices for 3 of the 6 cases. G, H, J, K: Significant (FDR-corrected p<0.05) NES marked with asterisk (*).

References

    1. Aibar S., Gonzalez-Blas C. B., Moerman T., Huynh-Thu V. A., Imrichova H., Hulselmans G., Rambow F., Marine J. C., Geurts P., Aerts J., et al. (2017). SCENIC: single-cell regulatory network inference and clustering. Nat Methods 14, 1083–1086. - PMC - PubMed
    1. Artegiani B., Lyubimova A., Muraro M., van Es J. H., van Oudenaarden A., and Clevers H. (2017). A Single-Cell RNA Sequencing Study Reveals Cellular and Molecular Dynamics of the Hippocampal Neurogenic Niche. Cell Rep 21, 3271–3284. - PubMed
    1. Barthel F. P., Johnson K. C., Varn F. S., Moskalik A. D., Tanner G., Kocakavuk E., Anderson K. J., Abiola O., Aldape K., Alfaro K. D., et al. (2019). Longitudinal molecular trajectories of diffuse glioma in adults. Nature 576, 112–120. - PMC - PubMed
    1. Benner E. J., Luciano D., Jo R., Abdi K., Paez-Gonzalez P., Sheng H., Warner D. S., Liu C., Eroglu C., and Kuo C. T. (2013). Protective astrogenesis from the SVZ niche after injury is controlled by Notch modulator Thbs4. Nature 497, 369–373. - PMC - PubMed
    1. Bonnay F., Veloso A., Steinmann V., Kocher T., Abdusselamoglu M. D., Bajaj S., Rivelles E., Landskron L., Esterbauer H., Zinzen R. P., and Knoblich J. A. (2020). Oxidative Metabolism Drives Immortalization of Neural Stem Cells during Tumorigenesis. Cell 182, 1490–1507 e1419. - PubMed

Publication types