[Preprint]. 2023 Feb 23:2023.02.23.529757.
doi: 10.1101/2023.02.23.529757.

Epilepsy-associated SCN2A (Na V 1.2) Variants Exhibit Diverse and Complex Functional Properties

Affiliations

Epilepsy-associated SCN2A (Na V 1.2) Variants Exhibit Diverse and Complex Functional Properties

Christopher H Thompson et al. bioRxiv. .

Update in

Abstract

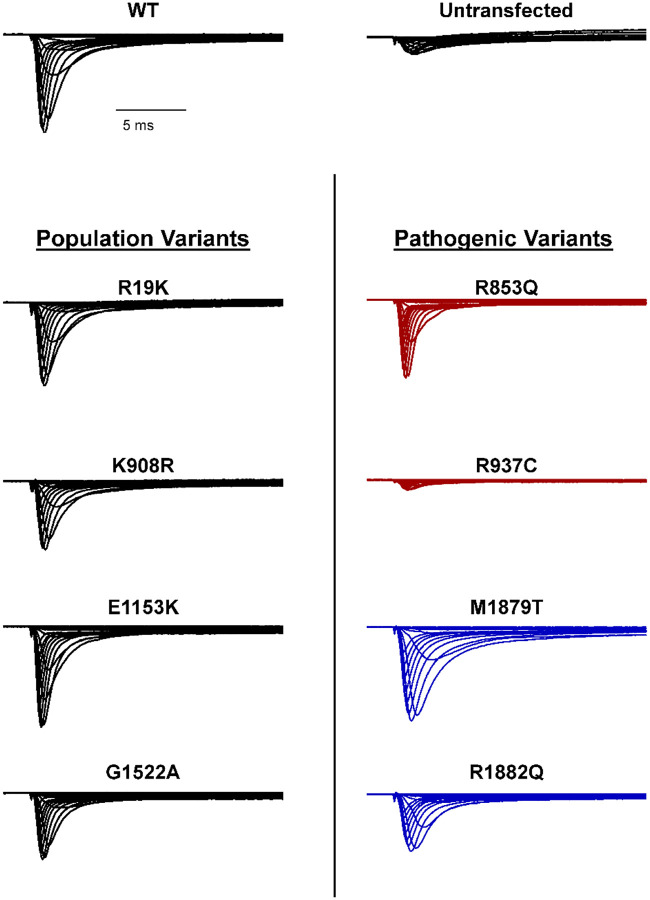
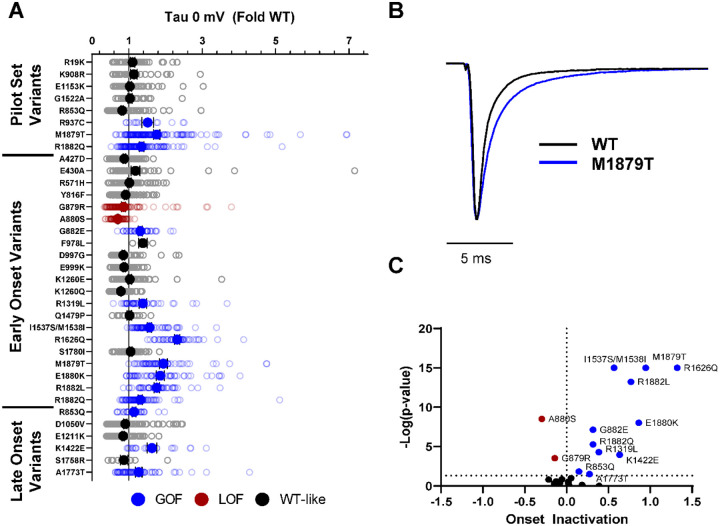
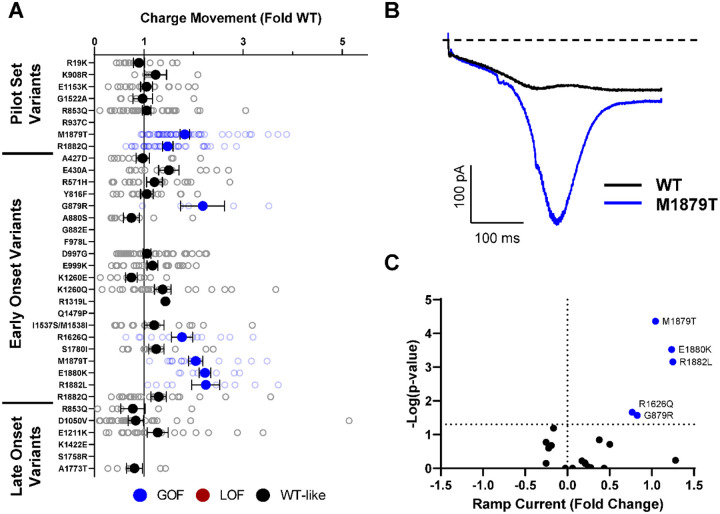
Pathogenic variants in neuronal voltage-gated sodium (Na V ) channel genes including SCN2A , which encodes Na V 1.2, are frequently discovered in neurodevelopmental disorders with and without epilepsy. SCN2A is also a high confidence risk gene for autism spectrum disorder (ASD) and nonsyndromic intellectual disability (ID). Previous work to determine the functional consequences of SCN2A variants yielded a paradigm in which predominantly gain-of-function (GoF) variants cause epilepsy whereas loss-of-function (LoF) variants are associated with ASD and ID. However, this framework is based on a limited number of functional studies conducted under heterogenous experimental conditions whereas most disease-associated SCN2A variants have not been functionally annotated. We determined the functional properties of more than 30 SCN2A variants using automated patch clamp recording to assess the analytical validity of this approach and to examine whether a binary classification of variant dysfunction is evident in a larger cohort studied under uniform conditions. We studied 28 disease-associated variants and 4 common population variants using two distinct alternatively spliced forms of Na V 1.2 that were heterologously expressed in HEK293T cells. Multiple biophysical parameters were assessed on 5,858 individual cells. We found that automated patch clamp recording provided a valid high throughput method to ascertain detailed functional properties of Na V 1.2 variants with concordant findings for a subset of variants that were previously studied using manual patch clamp. Additionally, many epilepsy-associated variants in our study exhibited complex patterns of gain- and loss-of-function properties that are difficult to classify overall by a simple binary scheme. The higher throughput achievable with automated patch clamp enables study of a larger number of variants, greater standardization of recording conditions, freedom from operator bias, and enhanced experimental rigor valuable for accurate assessment of Na V channel variant dysfunction. Together, this approach will enhance our ability to discern relationships between variant channel dysfunction and neurodevelopmental disorders.


Figures

Fig. 1.
Fig. 1.. Functional validation of a training set of NaV1.2 variants.
Average normalized whole-cell sodium currents of (A) WT NaV1.2 (left), untransfected cells (right), (B) a set of population variants, and (C) known pathogenic variants representing loss-of-function (LOF, red) -and gain-of-function (GOF, blue) phenotypes. Average traces are from 5 to 65 cells.
Fig. 2.
Fig. 2.. NaV1.2 variants alter whole-cell current density.
(A) Average deviation of whole-cell sodium current density from WT NaV1.2 for population and disease-associated variants. (B) Average traces for WT NaV1.2, a gain-of-function (GOF) variant NaV1.2A-D1050V, and two loss-of-function (LOF) variants NaV1.2A-A880S, and NaV1.2A-F978L. (C) Volcano plot highlighting variants significantly different from WT. Red symbols denote loss-of-function and blue symbols denote gain-of-function with p < 0.05 (n = 5–79).
Fig. 3.
Fig. 3.. NaV1.2 variants alter voltage-dependence of activation.
(A) Average deviation from WT NaV1.2 for V1/2 of activation (in mV). (B) Conductance-voltage curves showing a gain-of-function (NaV1.2-K1260Q) and a loss-of-function (R1882L) variant. (C) Volcano plot highlighting variants significantly different from WT. Red symbols denote loss-of-function and blue symbols denote gain-of-function with p < 0.05 (n = 5–65).
Fig. 4.
Fig. 4.. NaV1.2 variants alter voltage-dependence of inactivation.
(A) Average deviation from WT NaV1.2 for V1/2 of inactivation (in mV). (B) Steady-state inactivation curves showing a gain-of-function (NaV1.2-R1626Q) and a loss-of-function (NaV1.2-A1773T) variant. (C) Volcano plot highlighting variants significantly different from WT. Red symbols denote loss-of-function and blue symbols denote gain-of-function with p < 0.05 (n = 8–122).
Fig. 5.
Fig. 5.. NaV1.2 variants alter inactivation time constants.
(A) Average deviation of inactivation time constant (tau) measured at 0 mV from WT NaV1.2 for disease-associated variants. (B) Average traces for WT Nav1.2 and a GOF variant NaV1.2-M1879T recorded at 0 mV. (C) Volcano plot highlighting variants significantly different from WT. Red symbols denote loss-of-function and blue symbols denote gain-of-function with p < 0.05 (n = 9–120).
Fig. 6.
Fig. 6.. NaV1.2 variants alter inactivation ramp currents.
(A) Average deviation of ramp currents from WT NaV1.2 for disease-associated variants. (B) Average traces for WT NaV1.2 and a GOF variant NaV1.2-M1879T. (C) Volcano plot highlighting variants significantly different from WT. Red symbols denote loss-of-function and blue symbols denote gain-of-function with p < 0.05 (n = 5–45).
Fig. 7.
Fig. 7.. Validation of difficult to record NaV1.2 variants using manual patch clamp.
(A) Average whole-cell current traces of WT and three difficult to characterize variants (G882E, F978L, and Q1479P) recorded using manual patch-clamp. (B) Summary current voltage relationship (left), voltage-dependence of activation and inactivation (middle), and persistent current (right) of NaV1.2 variants recorded using manual patch clamp. All data were from 9 to 19 cells.
Fig. 8.
Fig. 8.. Comparison of epilepsy associated variants in the adult and neonatal isoforms of Nav1.2.
Heat maps showing GOF (blue) and LOF (red) phenotypes measured for epilepsy associated NaV1.2 variants in the (A) adult and (B) neonatal splice isoforms. Only properties which reached the threshold for statistical significance are highlighted.

References

    1. Lindy AS, Stosser MB, Butler E, Downtain-Pickersgill C, Shanmugham A, Retterer K, et al. Diagnostic outcomes for genetic testing of 70 genes in 8565 patients with epilepsy and neurodevelopmental disorders. Epilepsia. 2018;59(5):1062–71. - PubMed
    1. Symonds JD, Zuberi SM, Stewart K, McLellan A, O’Regan M, MacLeod S, et al. Incidence and phenotypes of childhood-onset genetic epilepsies: a prospective population-based national cohort. Brain. 2019;142(8):2303–18. - PMC - PubMed
    1. Symonds JD, McTague A. Epilepsy and developmental disorders: Next generation sequencing in the clinic. Eur J Paediatr Neurol. 2020;24:15–23. - PubMed
    1. Brunklaus A, Feng T, Brünger T, Perez-Palma E, Heyne H, Matthews E, et al. Gene variant effects across sodium channelopathies predict function and guide precision therapy. Brain. 2022;145(12):4275–86. - PMC - PubMed
    1. Sanders SJ, Campbell AJ, Cottrell JR, Moller RS, Wagner FF, Auldridge AL, et al. Progress in Understanding and Treating SCN2A-Mediated Disorders. Trends Neurosci. 2018;41(7):442–56. - PMC - PubMed

Publication types