[Preprint]. 2023 Feb 22:2023.02.14.23285913.
doi: 10.1101/2023.02.14.23285913.

Subcortical brain alterations in carriers of genomic copy number variants

Affiliations

Subcortical brain alterations in carriers of genomic copy number variants

Kuldeep Kumar et al. medRxiv. .

Update in

  • Subcortical Brain Alterations in Carriers of Genomic Copy Number Variants.
    Kumar K, Modenato C, Moreau C, Ching CRK, Harvey A, Martin-Brevet S, Huguet G, Jean-Louis M, Douard E, Martin CO, Younis N, Tamer P, Maillard AM, Rodriguez-Herreros B, Pain A; 16p11.2 European Consortium, Simons Searchlight Consortium; Kushan L, Isaev D, Alpert K, Ragothaman A, Turner JA, Wang L, Ho TC, Schmaal L, Silva AI, van den Bree MBM, Linden DEJ, Owen MJ, Hall J, Lippé S, Dumas G, Draganski B, Gutman BA, Sønderby IE, Andreassen OA, Schultz LM, Almasy L, Glahn DC, Bearden CE, Thompson PM, Jacquemont S. Kumar K, et al. Am J Psychiatry. 2023 Sep 1;180(9):685-698. doi: 10.1176/appi.ajp.20220304. Epub 2023 Jul 12. Am J Psychiatry. 2023. PMID: 37434504 Free PMC article.

Abstract

Objectives: Copy number variants (CNVs) are well-known genetic pleiotropic risk factors for multiple neurodevelopmental and psychiatric disorders (NPDs) including autism (ASD) and schizophrenia (SZ). Overall, little is known about how different CNVs conferring risk for the same condition may affect subcortical brain structures and how these alterations relate to the level of disease risk conferred by CNVs. To fill this gap, we investigated gross volume, and vertex level thickness and surface maps of subcortical structures in 11 different CNVs and 6 different NPDs.

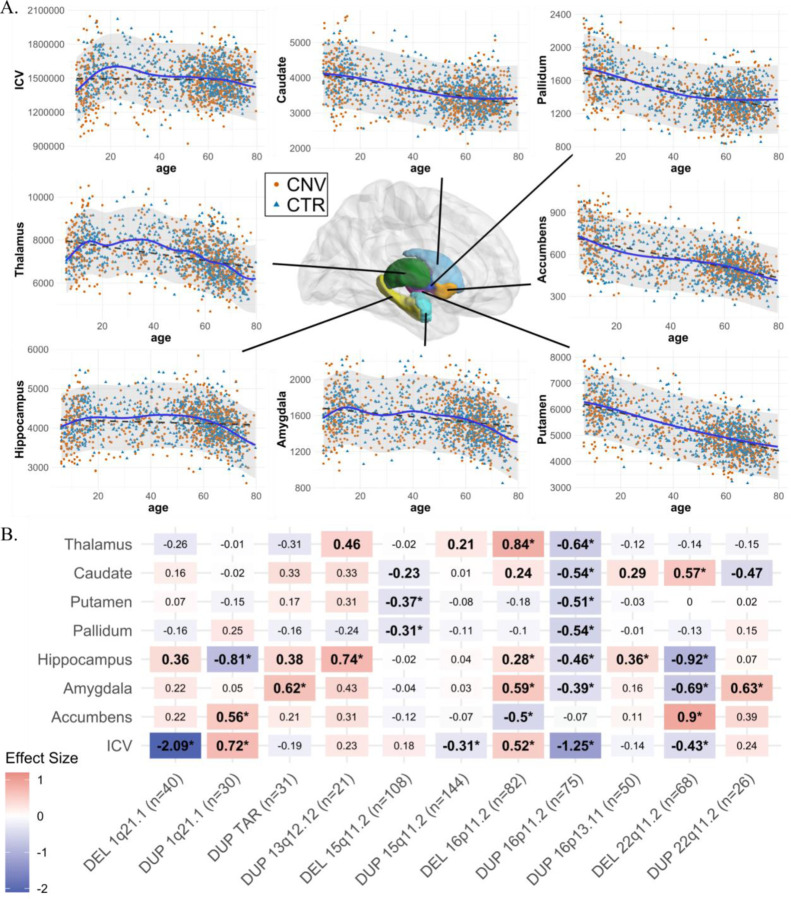
Methods: Subcortical structures were characterized using harmonized ENIGMA protocols in 675 CNV carriers (at the following loci: 1q21.1, TAR, 13q12.12, 15q11.2, 16p11.2, 16p13.11, and 22q11.2) and 782 controls (Male/Female: 727/730; age-range: 6-80 years) as well as ENIGMA summary-statistics for ASD, SZ, ADHD, Obsessive-Compulsive-Disorder, Bipolar-Disorder, and Major-Depression.

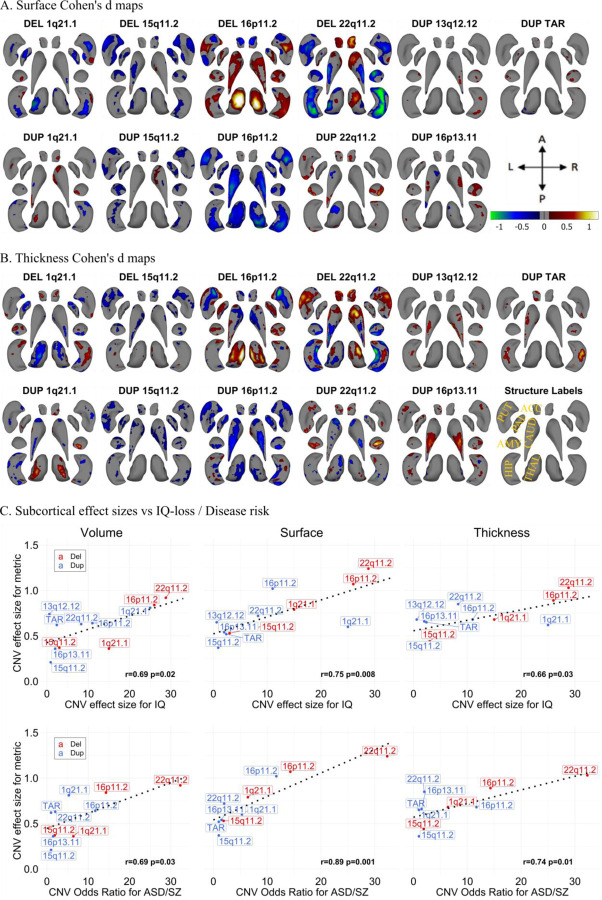
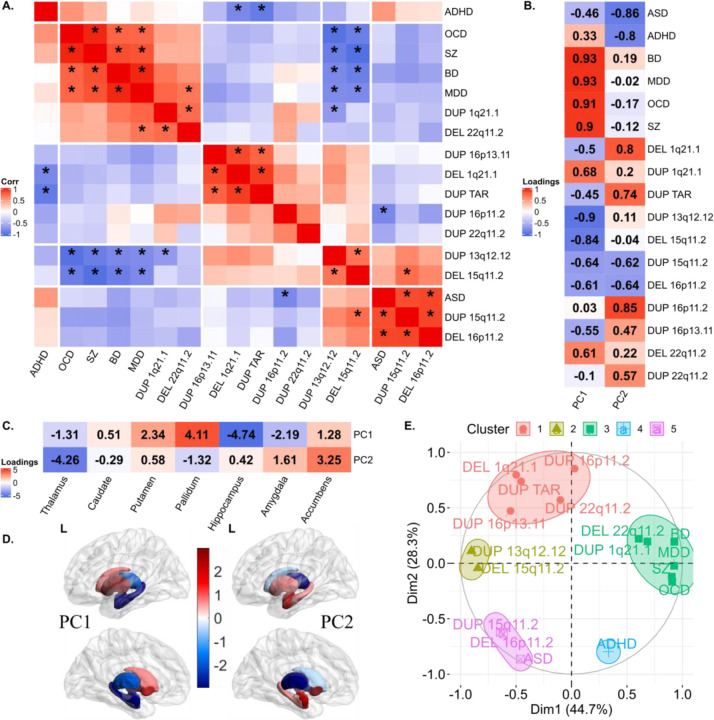
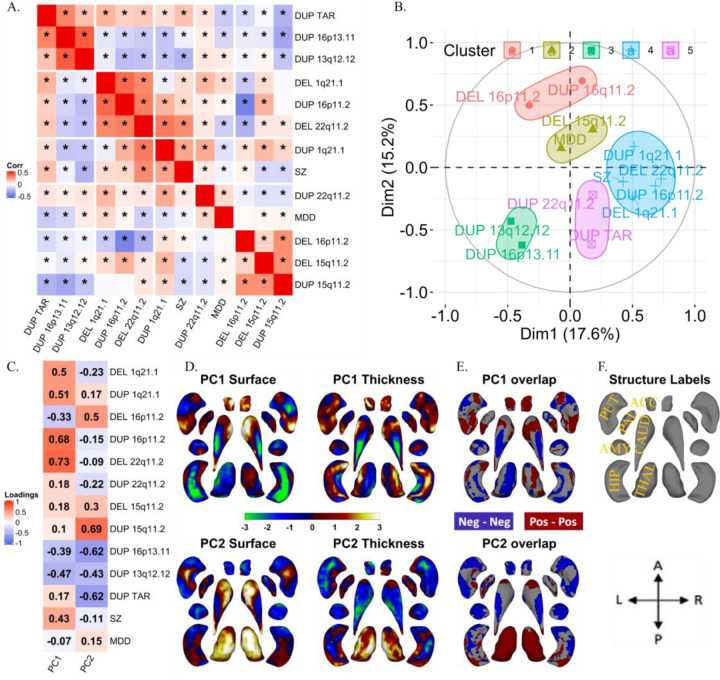
Results: Nine of the 11 CNVs affected volume of at least one subcortical structure. The hippocampus and amygdala were affected by five CNVs. Effect sizes of CNVs on subcortical volume, thickness and local surface area were correlated with their previously reported effect sizes on cognition and risk for ASD and SZ. Shape analyses were able to identify subregional alterations that were averaged out in volume analyses. We identified a common latent dimension - characterized by opposing effects on basal ganglia and limbic structures - across CNVs and across NPDs.

Conclusion: Our findings demonstrate that subcortical alterations associated with CNVs show varying levels of similarities with those associated with neuropsychiatric conditions. We also observed distinct effects with some CNVs clustering with adult conditions while others clustered with ASD. This large cross-CNV and NPDs analysis provide insight into the long-standing questions of why CNVs at different genomic loci increase the risk for the same NPD, as well as why a single CNV increases the risk for a diverse set of NPDs.


Conflict of interest statement

Disclosures

MvdB reports grants from Takeda Pharmaceuticals, outside the submitted work. P.M.T. and CRKC received a research grant from Biogen, Inc., for work unrelated to this manuscript. P.T. received a grant from the Canadian Institute of health research (CIHR) that financed her master’s degree. All other authors reported no biomedical financial interests or potential conflicts of interest.

Figures

Figure 1:
Figure 1:. Normative age modeling and subcortical volume effect sizes.
A) Scatterplots showing the distribution of ICV and subcortical volumes with age, along with Gaussian processes modeling (solid line) and a linear model (dotted line). All CNV carriers (CNV) and controls (CTR; which are used for Gaussian processes modeling) are shown as points. B) Cohen’s d values for subcortical structures and ICV for 11 CNVs. Case-control differences were calculated (lm function in R) using W-scores (derived from Gaussian processes modeling). W-score already includes adjustments for age, sex, site, and ICV. Significant effect sizes with nominal p-value <0.05 are in bold, and FDR p-value <0.05 are shown with an asterisk (*); FDR correction was applied across all CNVs and structures. Darker red or blue represent higher positive or negative effect sizes. Sample sizes for each analysis (for ICV) are reported in parentheses along with x-axis labels. DEL: deletions; DUP: duplications; ICV: Intracranial volume. Detailed effect sizes, standard error (SE), and p-values are reported in Figure SF2.
Figure 2:
Figure 2:. Cohen’s d maps for Subcortical Shape analysis and effect size comparison.
A-B) Cohen’s d maps of subcortical shape alterations in surface (panel A); and thickness (panel B) for 11 CNVs (dorsal view). Significant vertices are shown, after applying FDR correction (<0.05) across all 27,000 vertices x 11 CNVs (within each panel). Colorbar for panels A-B are shown in panel A, and structures’ labels are shown in panel B. Thickness represents local radial distance, and surface represents local surface area dilation/contraction. Blue/green colors indicate negative coefficients, or regions with reduced thickness in the CNV group compared with the controls. Red/yellow colors indicate positive coefficients, or regions with increased thickness in the CNV group compared with the controls. Gray regions indicate areas of no significant difference after correction for multiple comparisons. Each vertex was adjusted for sex, site, age, and intracranial volume (ICV). Ventral views are shown in Figure SF6. Covariance as well as overlap between surface and thickness at the vertex level are shown in Figure SF7. C) Comparison of effect sizes of CNVs on subcortical-volume / subcortical-shape metrics and previously published effect sizes on cognition and disease risk. Regression lines fitted using the geom_smooth function in R. Pearson correlation and p-values (parametric cor.mtest function in R) are shown for each metric. Plots comparing the effect sizes of CNVs and the number of genes within CNV / probability of being loss-of-function intolerant (pLI-sum) for genes within CNV, as well as ICV metric are shown in Figure SF8. Concordance of effect sizes of CNVs on subcortical shape metrics and subcortical-volume are shown in Figure SF9. Abbreviations, DEL: deletion; DUP: duplication; ACC: accumbens; AMY: amygdala; CAUD: caudate; HIP: hippocampus; PUT: putamen; PAL: pallidum; THAL: thalamus; ES: effect size; CCC: concordance correlation coefficients; Directions: L-left, R-right, A-anterior, P-posterior.
Figure 3:
Figure 3:. Correlations and principal components analysis across CNVs and NPDs.
A) Correlations between Cohen’s d profiles of CNVs and NPDs. * represent p-value <0.05 (BrainSMASH). Hierarchical (Ward distance) clustering based 5 clusters are separated using white spaces. B-E) Principal components analysis across subcortical volumes of 11 CNVs and 6 NPDs. B) Variable loadings on PC1 and PC2; C) Subcortical structures’ loadings; D) PC1 and PC2 loadings mapped on subcortical structures. (E) Correlation circle showing CNVs and NPDs in PC1 and PC2 space. CNV-NPD groupings obtained using K-means clustering (k=5 clusters) in the PC space (Euclidean distance). Abbreviations, CNV: copy number variants; DEL: deletion; DUP: duplication; NPD: neurodevelopmental and psychiatric disorders; Corr: Pearson correlation; ASD: autism spectrum disorder; ADHD: attention deficit hyperactivity disorder; BD: bipolar disorder; MDD: major depressive disorder; OCD: obsessive-compulsive disorder; SZ: schizophrenia; PC: principal component; L: left hemisphere; Dim: dimension.
Figure 4:
Figure 4:. Correlations and principal components analysis across vertex-wise Cohen’s d maps of CNVs and NPDs.
A) Correlations between vertex-wise Cohen’s d profiles of CNVs and NPDs. * represent p-value <0.01 (parametric test). Hierarchical (Ward distance) clustering based 5 clusters are separated using white spaces. B) Correlation circles with CNV and NPD clusters in PC1-PC2 space; C) CNV and NPD loadings of principal components 1 and 2.; D) PC1 and PC2 brain maps (dorsal views); E) overlap of PCs of thickness and surface; F) structures’ labels and dorsal view directions. Thickness represents local radial distance, and surface represents local surface area dilation/contraction. Principal components analysis was run with CNVs as variables and vertices as observations (stacked across surface and thickness metric and all subcortical structures; Z-scored). For PC maps, blue/green and red/yellow colors indicate negative and positive coefficients respectively. For overlap maps, blue and red represent negative-negative / positive-positive thickness and surface PC loadings at each vertex respectively. Ventral views are shown in Figure SF12. Abbreviations, DEL: deletion; DUP: duplication; PC: principal component; Dim: dimension; MDD: major depressive disorder; SZ: schizophrenia; ACC: accumbens; AMY: amygdala; CAUD: caudate; HIP: hippocampus; PUT: putamen; PAL: pallidum; THAL: thalamus; Directions: L-left, R-right, A-anterior, P-posterior.

References

    1. Hibar DP, Stein JL, Renteria ME, et al. : Common genetic variants influence human subcortical brain structures. Nature 2015; 520:224–229 - PMC - PubMed
    1. Levitt JJ, Bobrow L, Lucia D, et al. : A selective review of volumetric and morphometric imaging in schizophrenia. Curr Top Behav Neurosci 2010; 4:243–281 - PubMed
    1. Jacquemont S, Huguet G, Klein M, et al. : Genes To Mental Health (G2MH): A framework to map the combined effects of rare and common variants on dimensions of cognition and psychopathology [Internet]. Am J Psychiatry 2021; [cited 2022 Feb 1] Available from: https://orca.cardiff.ac.uk/144370/ - PMC - PubMed
    1. van Erp TGM, Hibar DP, Rasmussen JM, et al. : Subcortical brain volume abnormalities in 2028 individuals with schizophrenia and 2540 healthy controls via the ENIGMA consortium. Mol Psychiatry 2016; 21:585. - PMC - PubMed
    1. Schmaal L, Veltman DJ, van Erp TGM, et al. : Subcortical brain alterations in major depressive disorder: findings from the ENIGMA Major Depressive Disorder working group. Mol Psychiatry 2016; 21:806–812 - PMC - PubMed

Publication types