[Preprint]. 2023 Feb 23:rs.3.rs-2518774.
doi: 10.21203/rs.3.rs-2518774/v1.

Glutaminase inhibition in combination with azacytidine in myelodysplastic syndromes: Clinical efficacy and correlative analyses

Affiliations

Glutaminase inhibition in combination with azacytidine in myelodysplastic syndromes: Clinical efficacy and correlative analyses

Marina Konopleva et al. Res Sq. .

Update in

  • Glutaminase inhibition in combination with azacytidine in myelodysplastic syndromes: a phase 1b/2 clinical trial and correlative analyses.
    DiNardo CD, Verma D, Baran N, Bhagat TD, Skwarska A, Lodi A, Saxena K, Cai T, Su X, Guerra VA, Poigaialwar G, Kuruvilla VM, Konoplev S, Gordon-Mitchell S, Pradhan K, Aluri S, Hackman GL, Chaudhry S, Collins M, Sweeney SR, Busquets J, Rathore AS, Deng Q, Green MR, Grant S, Demo S, Choudhary GS, Sahu S, Agarwal B, Spodek M, Thiruthuvanathan V, Will B, Steidl U, Tippett GD, Burger J, Borthakur G, Jabbour E, Pemmaraju N, Kadia T, Kornblau S, Daver NG, Naqvi K, Short NJ, Garcia-Manero G, Tiziani S, Verma A, Konopleva M. DiNardo CD, et al. Nat Cancer. 2024 Oct;5(10):1515-1533. doi: 10.1038/s43018-024-00811-3. Epub 2024 Sep 19. Nat Cancer. 2024. PMID: 39300320 Clinical Trial.

Abstract

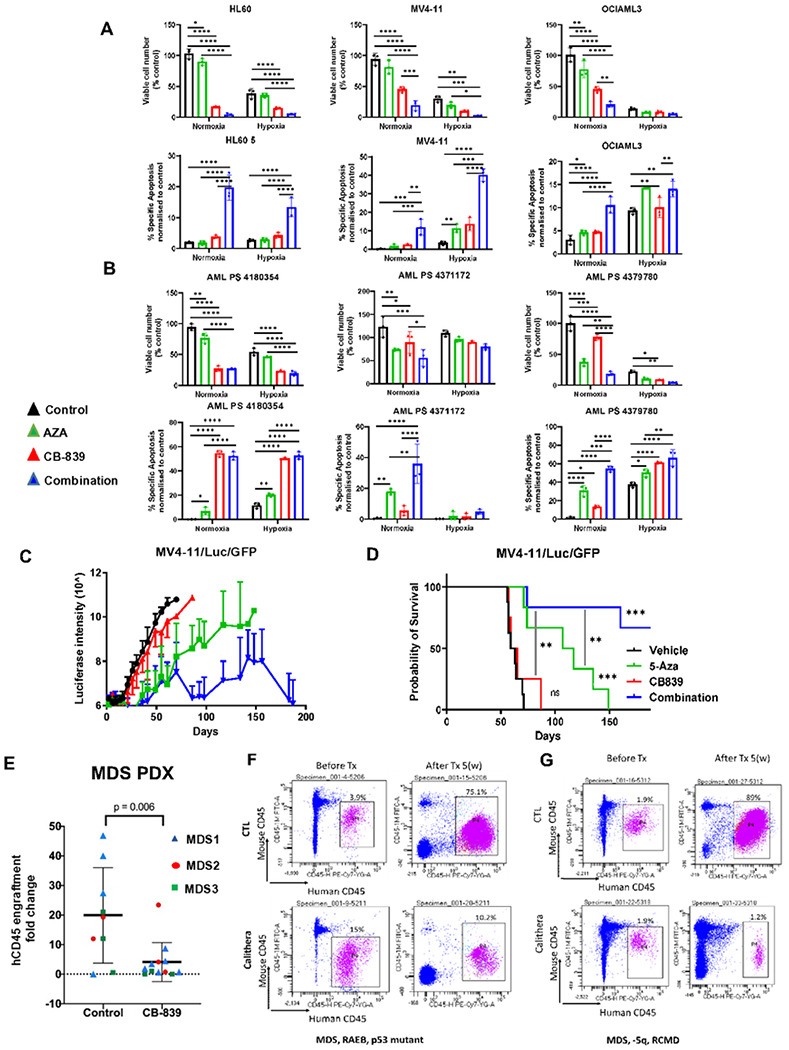
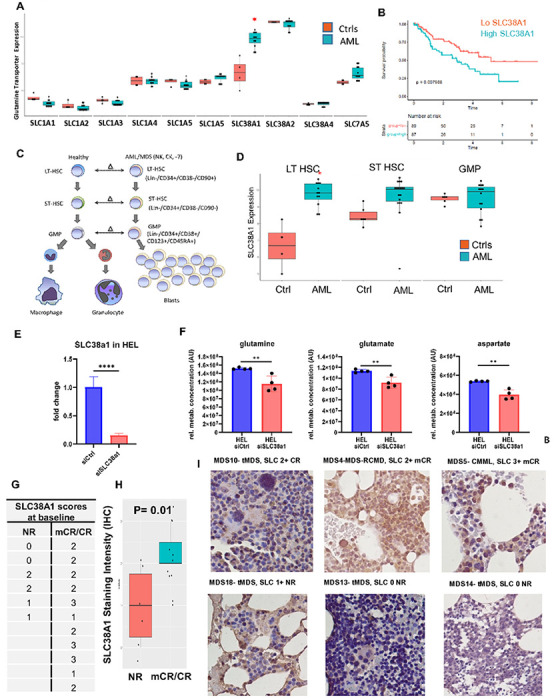
Malignancies can become reliant on glutamine as an alternative energy source and as a facilitator of aberrant DNA methylation, thus implicating glutaminase (GLS) as a potential therapeutic target. We demonstrate preclinical synergy of telaglenastat (CB-839), a selective GLS inhibitor, when combined with azacytidine (AZA), in vitro and in vivo, followed by a phase Ib/II study of the combination in patients with advanced MDS. Treatment with telaglenastat/AZA led to an ORR of 70% with CR/mCRs in 53% patients and a median overall survival of 11.6 months. scRNAseq and flow cytometry demonstrated a myeloid differentiation program at the stem cell level in clinical responders. Expression of non-canonical glutamine transporter, SLC38A1, was found to be overexpressed in MDS stem cells; was associated with clinical responses to telaglenastat/AZA and predictive of worse prognosis in a large MDS cohort. These data demonstrate the safety and efficacy of a combined metabolic and epigenetic approach in MDS.


Figures

Figure 1
Figure 1. GLS is overexpressed in RAEB subtype of MDS and in subsets of AML and is associated with worse prognosis:
(A) GLS expression in 183 cases of MDS and 17 control marrow CD34+ stem cells are shown. RAEB (refractory anemia with excess blasts, p <0.05), RA (Refractory anemia), RARS (Refractory anemia with ringed sideroblasts). (B) Kaplan Meier curves show worse survival of MDS patients with higher expression of GLS (Log rank p =0.003). (C) GAC isoform of GLS in expressed in AML cell lines. (D) GAC isoform of GLS protein is upregulated in leukemia cells over-expressing HIF-1α (middle lane) or cultured under hypoxic 1%O2 conditions (right). (E) Stable transfected OCI-AML3 cells with generated using shRNA control, puro-GAC plasmid, puro-KGA plasmid, puro-D3 (both isoforms) plasmid with puromycin incubation (3 days, 1 μg/ml). The expression of GAC and KGA in MV4;11 or OCI-AML3 cells was analyzed by Western blot. (F) LCMS analysis of OCIAML3 subjected to inducible knockdown of GAC, KGA or both GAC/KGA. GAC KO and less KGA KO drives metabolic perturbations in AML cell lines as shown as changes in level of glutamine, glutamate, and aspartate; (mean ± SD; n=5 replicates). (G) Effects of GAC, KGA and combined GAC/KGA knockdown were assessed on leukemic cells viability in MV4-11 and OCI-AML3 cells. Cell numbers for each cell line in indicated days were counted by Vi-cells. (t-test, mean ± SD, n=3 replicates). ***p ≤ 0.001 (H) LCMS analysis of selected metabolites extracted from HL60 cell lines, treated with vehicle or telaglenastat (CB-839) 1 μM, 24 hr (mean ± SD, n=4 replicates). (I) % of hypomethylation measured in OCIAML3 cells subjected to treatment with DMSO or CB-839 after 72 hours, (mean ± SD of n=3 replicates).
Figure 2
Figure 2. Anti-leukemia efficacy of AZA/CB-839 in AML cell line, primary AML cells and MDS patients.
(A, B) Treatment with 1 μM of telaglenastat (CB-839) and escalating doses of AZA (HL-60 2.5 μM, OCIAML3 and MV4-11 1 μM) caused additive or synergistic inhibition of cellular growth after 3 or 5 days of culture, both under normoxia and hypoxia, in AML cell lines (OCI-AML3, HL-60, MV4-11) (A) and primary AML cells (n=3) (B). Viable cell number are presented in top panel, and apoptosis measurement in bottom panels, (t-test, n=3 replicates) Significance was determined using unpaired two-tailed t-test annotated as * p ≤ 0.05, ** p ≤ 0.01 *** p = 0.001, **** p ≤ 0.001. (C, D) MV4-11/Luc/GFP cells (1×10⁶ per mouse) were injected intravenously into NSG-S mice. Starting on day 6, mice (n = 6 mice per group) were treated with a vehicle, 5 mg/kg AZA, 200 mg/kg telaglenastat (CB-839), or both. AZA was administered IP, qd for 5 days, and CB-839 po, q12h for 6 weeks. The luciferase intensity was quantified by serial bioluminescence imaging from 6 representative mice from 4 groups (C). Overall survival in each group of mice was estimated by the Kaplan-Meier method (D). (E) 3 different MDS patient-derived xenografts were prepared by transplantation of peripheral blood or BM mononuclear cells (MNCs) into irradiated NSG mice. After confirmation of engraftment by serial BM samples, the cohort was split and treated with either drug at a dose of 200 mg/kg or control for 5 weeks. Human CD45+ engraftment was calculated, and fold change of Post/Pre-treatment engraftment was shown for Ctrl and telaglenastat (CB-839) treated mice. (p=0.037) (F-G) MDS samples from low and high-risk patients analyzed after 5 weeks of treatment shows increasing engraftment in the control-treated mice but a loss of graft in CB-839 treated mice, as demonstrated by the human CD45 antibody.
Figure 3
Figure 3. Telaglenastat demonstrates on-target efficacy linked to modulation of intracellular metabolism.
(A) Overall survival of all n=28 enrolled into clinical trial patients. (B) Median f/u in the study. (C) Comparison of overall survival of all n=28 in reference to treatment status (D) Frequency of treatment related adverse events presented in ≥ 10% of patients. (E) Ratio of the intracellular levels of glutamate and glutamine dropped in most patients, consistent with the know mechanism of telaglenastat. The peripheral blood cells were collected from patients before treatment, at the end of cycle 1, 2 and 4. The cells were collected for metabolic analysis. (F) UMP level among responders and non-responders, and (G) AMP concurrently showed consistent trends associated with patient response early during treatment. (H-J) Mass spectrometry analysis of Carnitine, Acetylcarnitine and Dehydroxycarnitine respectively in reference to treatment response. (H) Any Correlation?
Figure 4
Figure 4. Glutaminase inhibitor treated MDS Bone marrows demonstrate stem cell differentiation at single cell level in clinical responders
(A-B) scRNAseq was conducted on bone marrow cells from telaglenastat treated patients. 5 clinical responders and 3 non responders were analyzed, and 11 distinct cell populations identified based on gene expression patterns. (C) Cell populations that were significantly enriched in responders and non-responders are shown (Odd’s ratio (OR) with 95% CI, Fisher’s Test). Significantly increased numbers of Neutrophil / Monocytic cells were seen in post treatment responder samples. (D) CD34 expressing HSPC population was enriched in non-responders and are shown in representative UMAP figures. (E) S100A9 expressing Neutrophil/Monocyte population was enriched in responders and are shown in UMAP figures. (F) Volcano plot of differentially expressed genes in HSPCs shows responders with enrichment in severa myeloid differentiation associated genes (G) Gene ontology of differentially expressed genes in HSPC demonstrates enrichment for leucocyte related genetic programs.
Figure 5
Figure 5. Reduction in Leukemic Stem Cells and increased differentiation is seen in responders to AZA/Telaglenastat combination
(A-D) Flow done on serial bone marrows from patients in CR (A, B) and marrow CR (C, D) showed reduction in LSCs (CD34+/CD38Linve with IL1RAP+ or CD34+/CD38/Linve with high CD45+/CD123+). (E, F) BM from patient with no response showed no reduction in IL1RAP+ or CD45/CD123 high LSCs in serial bone marrows. (G-I) Bone marrow from patient in CR showed HSC (CD34+/CD38) to progenitor (C34+/CD38+) differentiation in serial BM (G). Patient with mCR without count recovery and non-responding patients did not show differentiation (H). Myeloid differentiation at the stem cell level is seen in responding patients(I).
Figure 6
Figure 6. Glutamine transporter, SLC38A1, is overexpressed in MDS/AML stem cells; is associated with an adverse prognosis and correlates with response to response to AZA/Telaglenastat
(A) Expression of all known glutamine transporters in LT HSC (Linve, CD34+, CD38+, CD90) from controls and AML were evaluated and SLC38A1 was the only transporter that was significantly overexpressed in AML LT-HSCs. SLC38A1 was most significantly overexpressed in AML LT HSCs and ST HSCs with −7 and Complex karyotypes. (B) Survival of 183 MDS patients was correlated with SLC38A1 expression in marrow derived CD34+ cells. Patients with higher SLC38A1 levels (greater than median) had a median survival of 2.6 years compared with 5.8 years for the group with lower STAT3 (log-rank p < 0.01). (C) Schematic figure showing stem cell differentiation stages, at which cells were harvested and analyzed. To determine glutamine transporter expression levels in highly purified AML/MDS stem and progenitor cells, we examined gene expression profiles generated from FACS-sorted LT-HSCs, ST-HSCs, and GMPs from 12 MDS/AML samples with normal karyotype, deletion of chromosome 7, and complex karyotype (Gene Expression Omnibus [GEO], GSE35008 and GSE35010). (D) Gene expression levels in highly purified AML/MDS stem and progenitor cells obtained from FACS-sorted LT-HSCs, ST-HSCs, and GMPs from 12 MDS/AML samples with normal karyotype, deletion of chromosome 7, and complex karyotype (Gene Expression Omnibus [GEO], GSE35008 and GSE35010) as described in (A). (E) Evidence of successful knockdown of SLC38A1 with siRNAs measured by RT-PCR. (F) The intracellular levels of glutamine, glutamate and aspartate decrease in leukemic HEL cells following knockdown of the glutamate transporter SLC38A1 with siRNA. Knockdown of SLC38A1 led to reduced glutamine transport in leukemic HEL cells as measured by LMSC, (mean ± SD, n=4 replicates per condition); (t-test, p<0.05). (G-I) Baseline BM biopsy sections from 17 patients with MDS that were treated with telaglenastat (CB-839) and azacytidine (AZA) were immunohstochemically stained with antibody against SLC38A1. Specific membrane/cytoplasmic staining was seen in BM cells and graded based on intensity as shown in representative sections. Patients with response (marrow CR/CR) to Glutaminase inhibitor/AZA treatment demonstrated a higher baseline mean SLC38A! Expression (t-test, p=0.01)

References

    1. Altman B.J., Stine Z.E. & Dang C.V. From Krebs to clinic: glutamine metabolism to cancer therapy. Nat Rev Cancer 16, 619–634 (2016). - PMC - PubMed
    1. Cantor J.R. & Sabatini D.M. Cancer cell metabolism: one hallmark, many faces. Cancer Discov 2, 881–898 (2012). - PMC - PubMed
    1. Schulze A. & Harris A.L. How cancer metabolism is tuned for proliferation and vulnerable to disruption. Nature 491, 364–373 (2012). - PubMed
    1. Warburg O. On the origin of cancer cells. Science 123, 309–314 (1956). - PubMed
    1. Gross M.I., et al. Antitumor activity of the glutaminase inhibitor CB-839 in triple-negative breast cancer. Mol Cancer Ther 13, 890–901 (2014). - PubMed

Publication types