. 2023 Feb 13:30:100462.
doi: 10.1016/j.pacs.2023.100462. eCollection 2023 Apr.

In vivo characterization and analysis of glioblastoma at different stages using multiscale photoacoustic molecular imaging

Affiliations

In vivo characterization and analysis of glioblastoma at different stages using multiscale photoacoustic molecular imaging

Jinde Zhang et al. Photoacoustics. .

Abstract

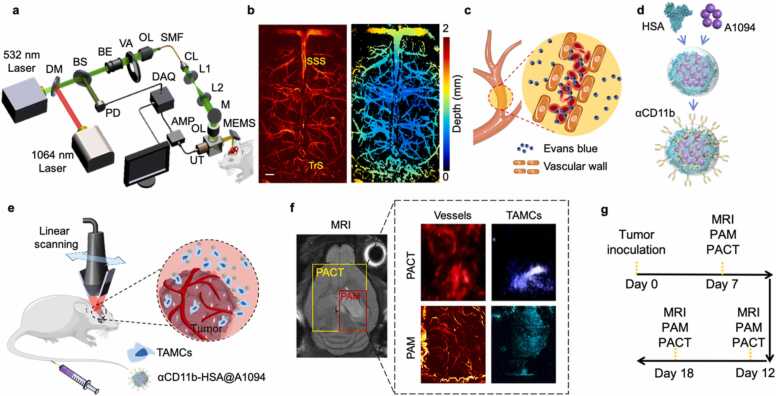
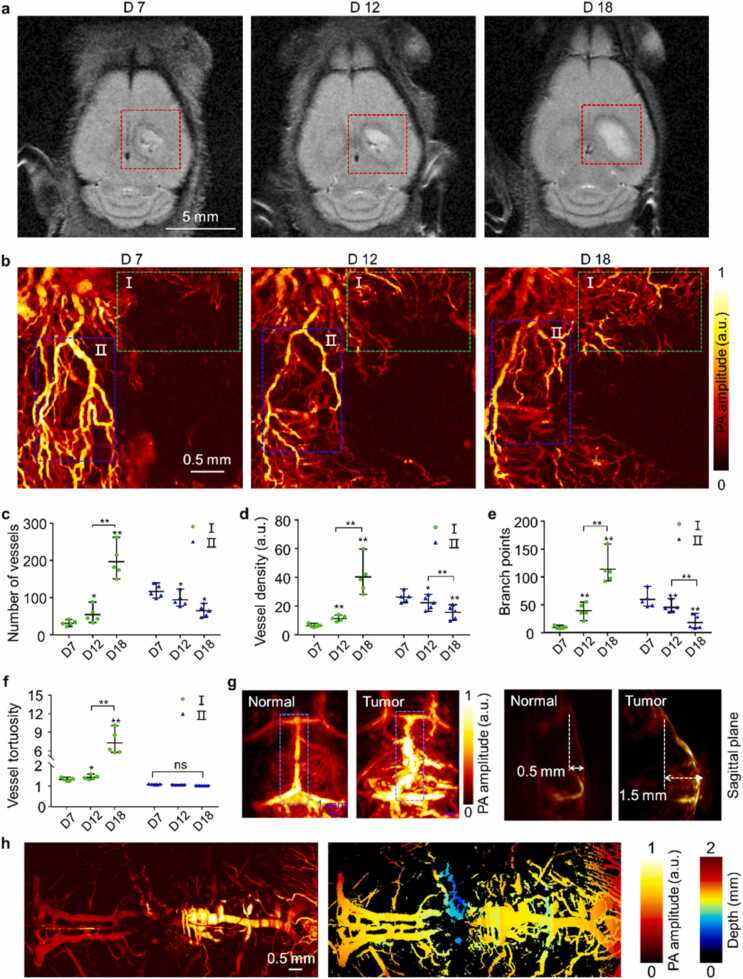
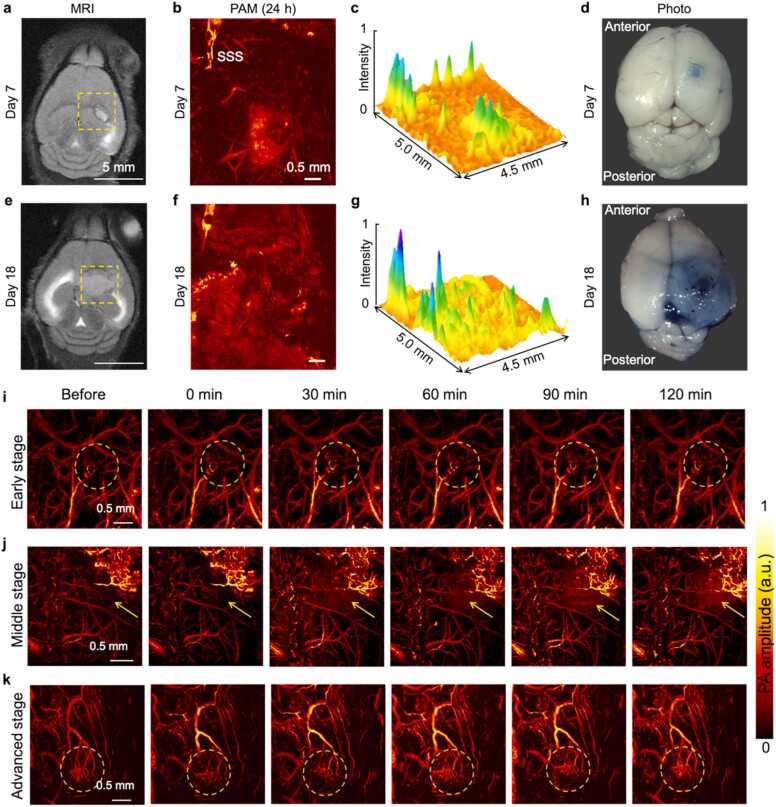
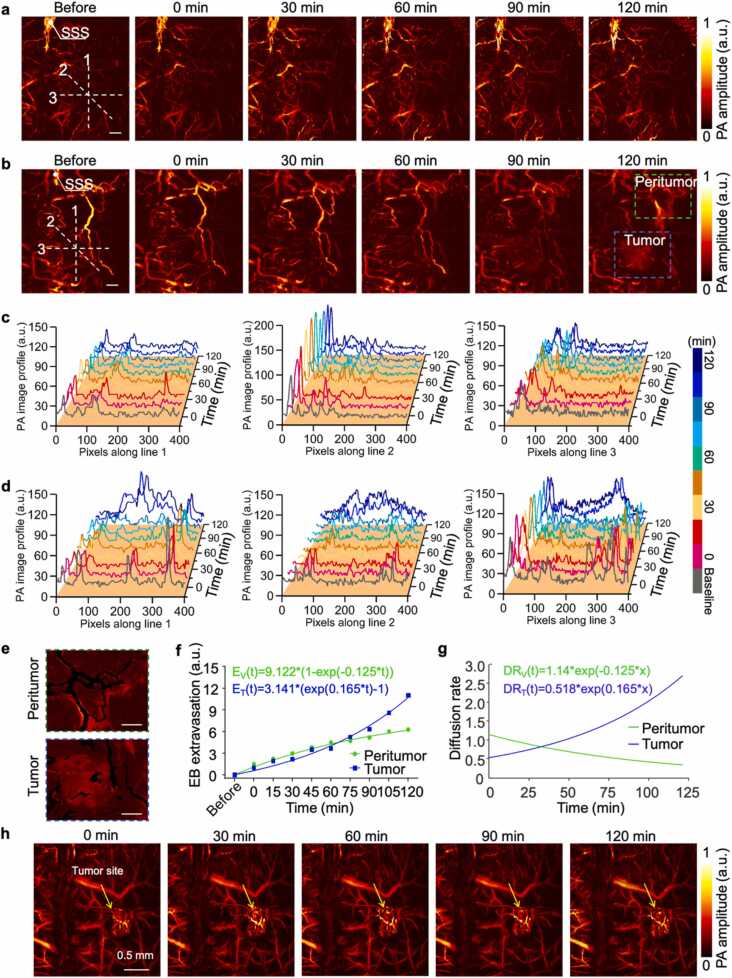
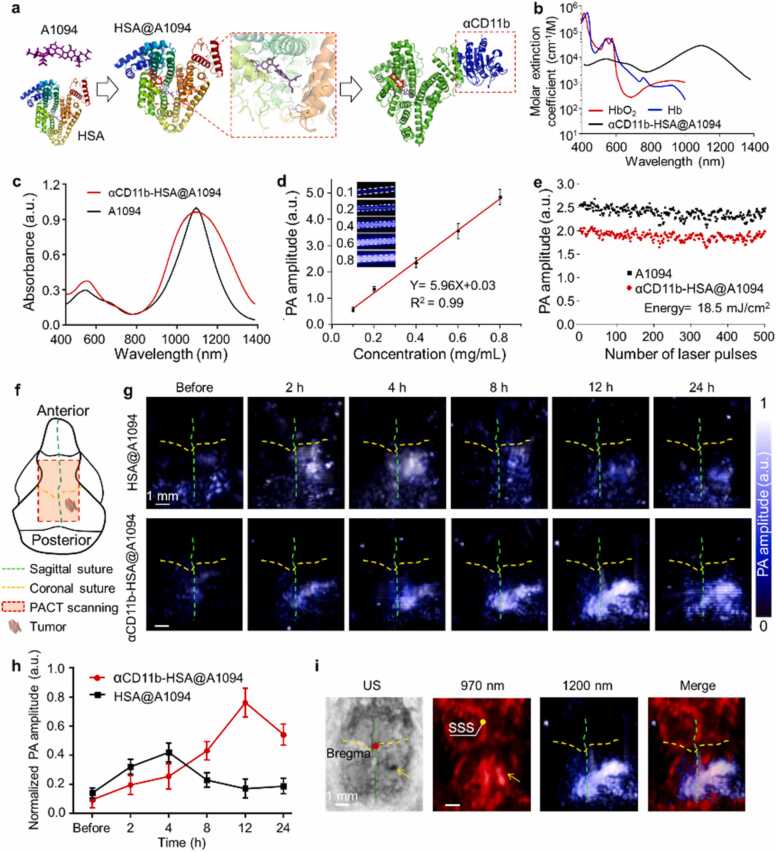
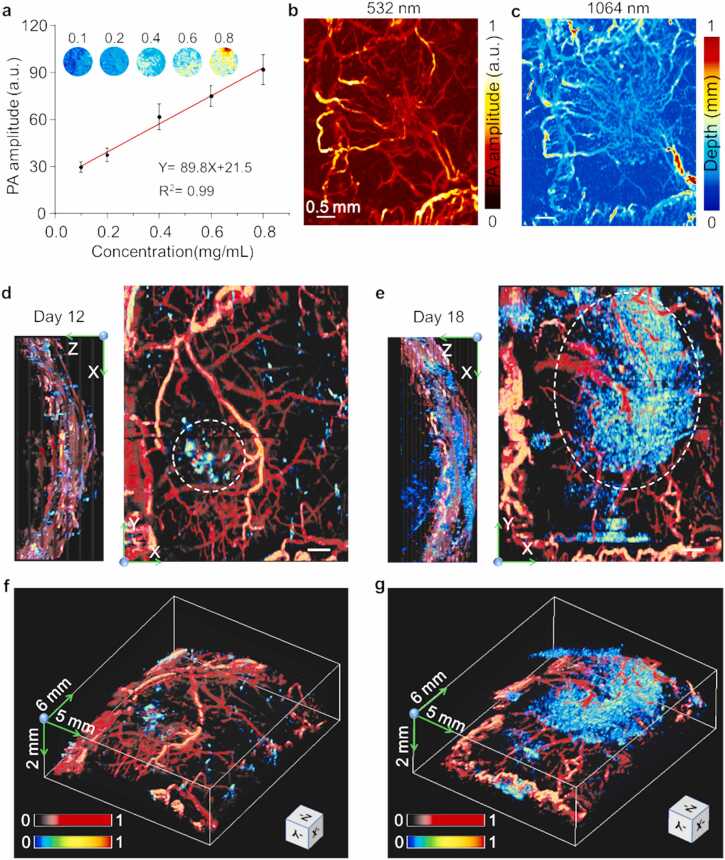
Simultaneous spatio-temporal description of tumor microvasculature, blood-brain barrier, and immune activity is pivotal to understanding the evolution mechanisms of highly aggressive glioblastoma, one of the most common primary brain tumors in adults. However, the existing intravital imaging modalities are still difficult to achieve it in one step. Here, we present a dual-scale multi-wavelength photoacoustic imaging approach cooperative with/without unique optical dyes to overcome this dilemma. Label-free photoacoustic imaging depicted the multiple heterogeneous features of neovascularization in tumor progression. In combination with classic Evans blue assay, the microelectromechanical system based photoacoustic microscopy enabled dynamic quantification of BBB dysfunction. Concurrently, using self-fabricated targeted protein probe (αCD11b-HSA@A1094) for tumor-associated myeloid cells, unparalleled imaging contrast of cells infiltration associated with tumor progression was visualized by differential photoacoustic imaging in the second near-infrared window at dual scale. Our photoacoustic imaging approach has great potential for tumor-immune microenvironment visualization to systematically reveal the tumor infiltration, heterogeneity, and metastasis in intracranial tumors.

Keywords: Blood-brain barrier; Brain tumor; Immune environment; Multiscale photoacoustic imaging; Vascular quantitative analysis.


Conflict of interest statement

The authors declare that they have no known competing financial interests or personal relationships that could have appeared to influence the work reported in this paper.

Figures

Fig. 1
Fig. 1
The multi-wavelength photoacoustic molecular imaging approach for in vivo assessment of GBM neovascularization and TAMCs. (a) Schematic of MEMS-based PAM system for transcranial imaging. DM, dichroic mirror; BS, beam splitter; PD, Photodiode; BE, beam expander; VA, variable attenuator; OL, objective lens; SMF, single-mode fiber; CL, collimating lens; M, mirror; UT, ultrasonic transducer; MEMS, microelectromechanical systems; AMP, amplifier; DAQ, data acquisition card. (b) Representative PAM image of normal mouse brain cortex and its depth encoding image (scale bar = 500 µm). (c) Imaging GBM neovascularization and vascular permeability changes by PAM. (d) A brief synthesis diagram of TAMCs targeted nanoprobe, αCD11b-HSA@A1094. (e) Schematic diagram of TAMCs tracing by PACT in an orthotopic GBM model. (f) The distribution of cerebral cortex vessels and TAMCs by dual-wavelength PACT (970 and 1200 nm) and PAM (532 and 1064 nm) approaches (yellow and red boxes in the MRI image indicated the imaging region of PACT and PAM, respectively). SSS, superior sagittal sinus; TrS, transverse sinus; HSA, human serum albumin; TAMCs, tumor-associated myeloid cells. (g) Diagram of tumor inoculation and imaging timeline.
Fig. 2
Fig. 2
Morphological changes of blood vessels caused by tumor progression. (a) In vivo T2-weighted MRI images of GBM-bearing mice at Day 7, 12, and 18 after tumor cell implantation with detailed structural information of cortex. The red dashed box indicates the tumor region. (b) Vessel network in tumor region at different stages obtained by PAM at 532 nm (acquisition time ∼60 s). (c-f) Quantitative vessel network analysis of region I (green dashed box) and II (blue dashed box) in (b), four indicators included total number of vessels (c), density (d), branch points (e), and tortuosity (f) were counted, statistical comparison with the paired t-test, ns, * , and * *, respectively represent no significance, p < 0.05, and p < 0.01 (n = 5 for each group). (g) Vessel distribution images in the whole cerebral cortex of normal and tumor-bearing mice obtained by PACT at 800 nm. (h) Vascular morphology images along the sagittal suture of normal and tumor-bearing mice obtained by PAM at 532 nm (acquisition time ∼100 s). All statistical data are expressed as mean ± SD.
Fig. 3
Fig. 3
In vivo Detection of BBB permeability by EB staining. (a) MRI image of GBM-bearing mouse brain at Day 7. (b) PA image of the brain cortex acquired in the yellow dashed box of (a) by PAM at 24 h after EB injection. The diffuse signal indicated EB extravasation from the vessels. Less EB staining was evident in the brain tissue. (c) PA amplitude profile of (b). (d) Photograph of ex vivo brain tissues. (e-h) Corresponding results of GBM-bearing mouse brain at Day 18. Areas of “bluing” in photos represent that the vascular permeability to EB-albumin complex increased with tumor progression. (i) PA images of the mice in the early-stage group. (j) PA images of the mice in the middle-stage group. (k) PA images of the mice in the advanced-stage group.
Fig. 4
Fig. 4
The evaluation of tumor caused BBB dysfunction. (a-b) Time-lapse monitoring of BBB status in early (Day 7) and advanced (Day 18) stage of tumor-bearing mice by PAM at 532 nm, n = 4 for each group, acquisition time ∼80 s, (scale bar = 500 µm). (c-d) Spatiotemporal distribution of the EB dye leakage of (a) and (b) group along the three white dashed lines. (e) Magnified views of the blue and green and blue dashed boxes from (b) at 120 min, the typical spatial distribution of the extravascular EB at peritumor and tumor regions, scale bar = 500 µm. (f) Comparison of EB extravasation dynamics in the peritumor and tumor regions. The data points are the averages. (g) Corresponding diffusion rate over time. (h) The PA signals in the vessels of advanced tumors (Day 18) remained stable within two hours.
Fig. 5
Fig. 5
The synthesis route of αCD11b-HSA@A1094 nanoprobe and photoacoustic performance test by PACT. (a) Scheme for the formation of the αCD11b-HSA@A1094 probe. (b) Molar extinction spectra of hemoglobin and probe. (c) Absorption spectra of A1094 dye and nanoprobe. (d) PA amplitude of nanoprobe at 1200 nm as a function of concentration. (e) Photoacoustic stability test of A1094 dye and probe illuminated with 500 laser pulses at 1200 nm with 18.5 mJ/cm2. (f) Schematic diagram of mouse skull structure and imaging region by PACT, PA area: 7 mm × 8 mm. (g) In vivo evaluation of the nanoprobe accumulation in orthotopic GBM at 1200 nm after intravenous injection of probe at indicated time points (n = 4 for each group), acquisition time ∼2.5 min (h) The quantitative PA amplitude changes of (g). (i) Ultrasound imaging and NIR dual-wavelength PA images of tumors. The dual-wavelength PA images showed cortex vessels (970 nm) and TAMCs distribution (1200 nm), simultaneously. All statistical data are expressed as mean ± SD.
Fig. 6
Fig. 6
Images of the tumor-bearing mouse brain by dual-wavelength MEMS-based PAM. (a) PA amplitude of αCD11b-HSA@A1094 at 1064 nm as a function of concentration. (b-c) Dual-wavelength (532 and 1064 nm) MAP images of the vascular morphology in 30 min after intravenous injection (acquisition time ∼60 s). (d-e) Multiple views (X-Y, X-Z plane) of the TAMCs surrounded by the vasculature in the cerebral cortex acquired at 12 h after αCD11b-HSA@A1094 injection on Day 12 (d) and Day 18 (e) of tumor progression, scale bar = 500 µm. (f-g) Corresponding volume-rendered 3D fusion images with dimensions of 6 mm × 5 mm × 2 mm.

Similar articles

Cited by

References

    1. Li Y.M., Suki D., Hess K., Sawaya R. The influence of maximum safe resection of glioblastoma on survival in 1229 patients: Can we do better than gross-total resection? J. Neurosurg. 2016;124(4):977–988. - PubMed
    1. Wen P.Y., Reardon D.A. Neuro-oncology in 2015: progress in glioma diagnosis, classification and treatment. Nat. Rev. Neurol. 2016;12(2):69–70. - PubMed
    1. Norden A.D., Drappatz J., Wen P.Y. Novel anti-angiogenic therapies for malignant gliomas. Lancet Neurol. 2008;7(12):1152–1160. - PubMed
    1. Osswald M., Blaes J., Liao Y., Solecki G., Gommel M., Berghoff A.S., Salphati L., Wallin J.J., Phillips H.S., Wick W., Winkler F. Impact of blood-brain barrier integrity on tumor growth and therapy response in brain metastases. Clin. Cancer Res. 2016;22(24):6078–6087. - PubMed
    1. Sarkaria J.N., Hu L.S., Parney I.F., Pafundi D.H., Brinkmann D.H., Laack N.N., Giannini C., Burns T.C., Kizilbash S.H., Laramy J.K., Swanson K.R., Kaufmann T.J., Brown P.D., Agar N.Y.R., Galanis E., Buckner J.C., Elmquist W.F. Is the blood-brain barrier really disrupted in all glioblastomas? A critical assessment of existing clinical data. Neuro Oncol. 2018;20(2):184–191. - PMC - PubMed

LinkOut - more resources