

In patients with hemophilia, a decreased thrombin generation profile is associated with a severe bleeding phenotype
- PMID: 36865907
- PMCID: PMC9971314
- DOI: 10.1016/j.rpth.2023.100062
In patients with hemophilia, a decreased thrombin generation profile is associated with a severe bleeding phenotype
Abstract
Background: Heterogeneity in clinical bleeding phenotype has been observed in hemophilia patients with similar FVIII or FIX activity levels. Thrombin generation and plasmin generation, as a global hemostasis assay, may contribute to a better prediction of which patients are at an increased risk of bleeding.
Objectives: The objective of this study was to describe the association between clinical bleeding phenotype and thrombin generation and plasmin generation profiles in patients with hemophilia.
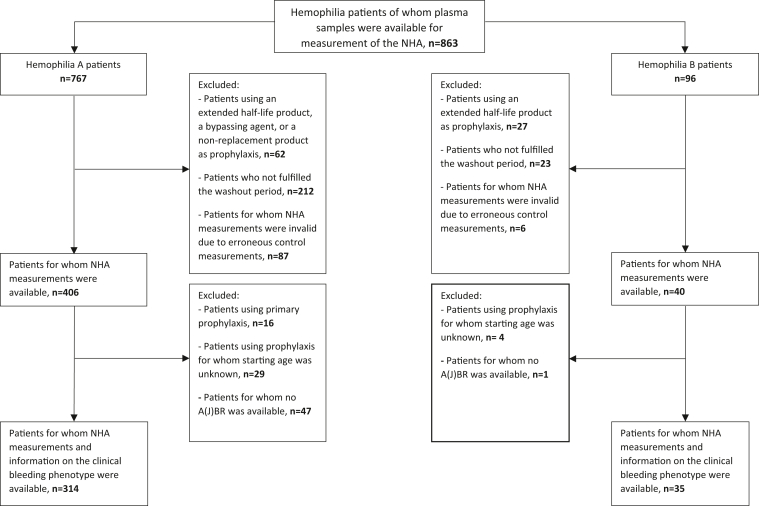
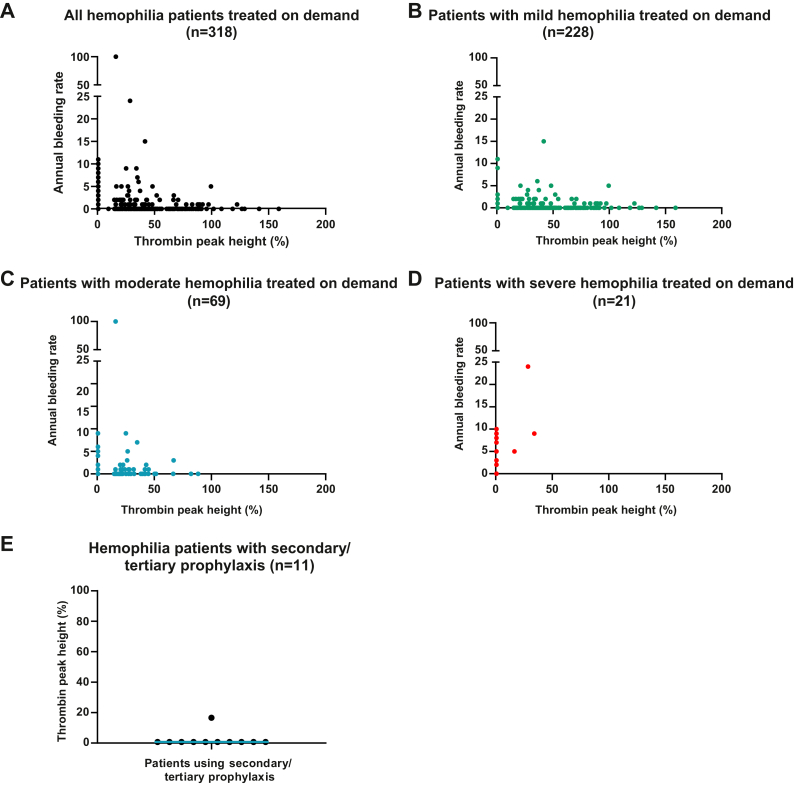
Methods: The Nijmegen Hemostasis Assay, which simultaneously measures thrombin and plasmin generation, was performed in plasma samples of patients with hemophilia participating in the sixth Hemophilia in the Netherlands study (HiN6). Patients receiving prophylaxis underwent a washout period. A severe clinical bleeding phenotype was defined as a self-reported annual bleeding rate of ≥5, a self-reported annual joint bleeding rate of ≥3, or the use of secondary/tertiary prophylaxis.
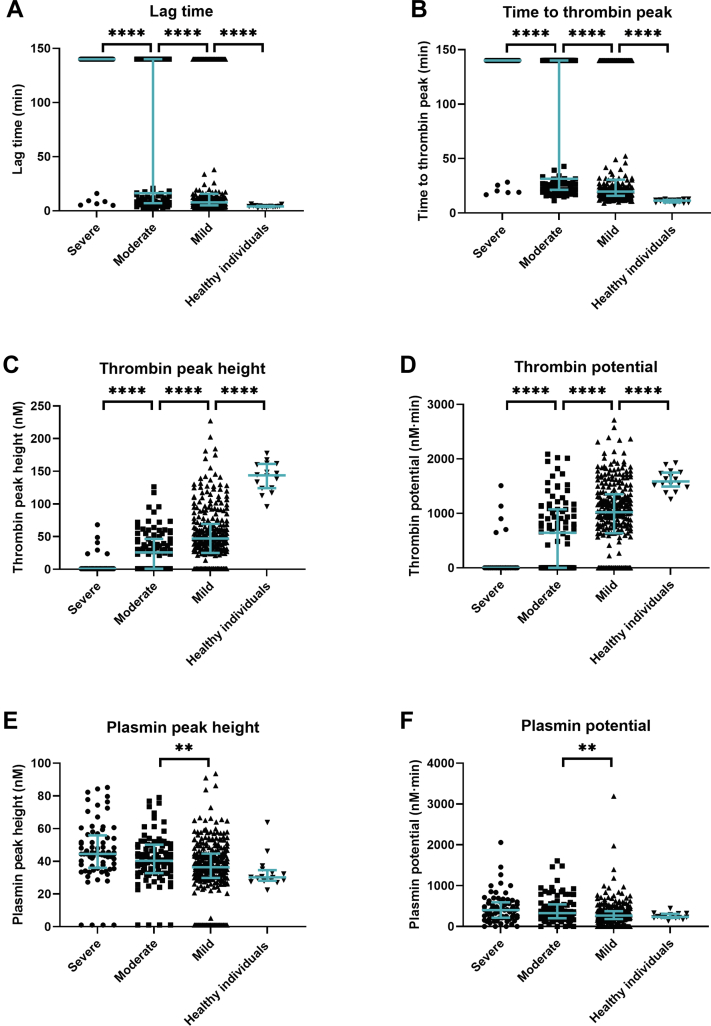
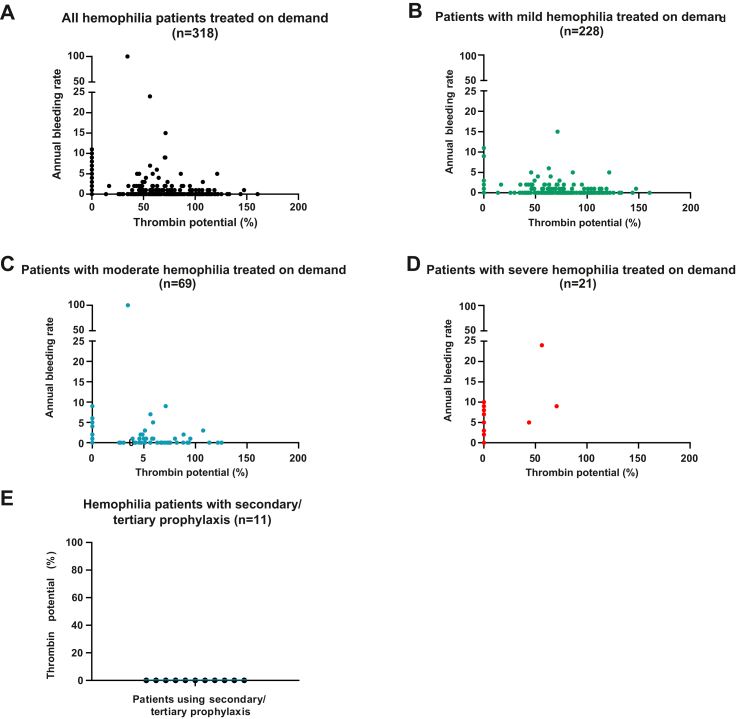
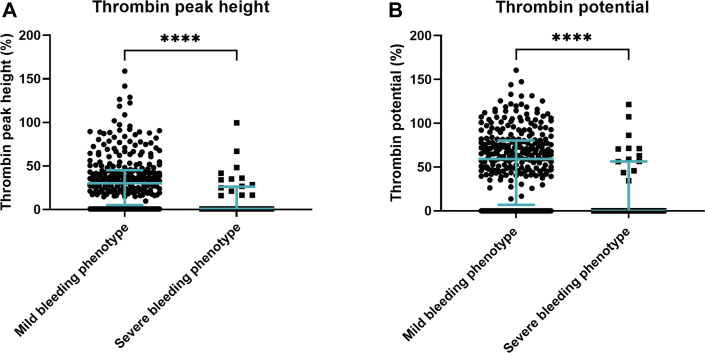
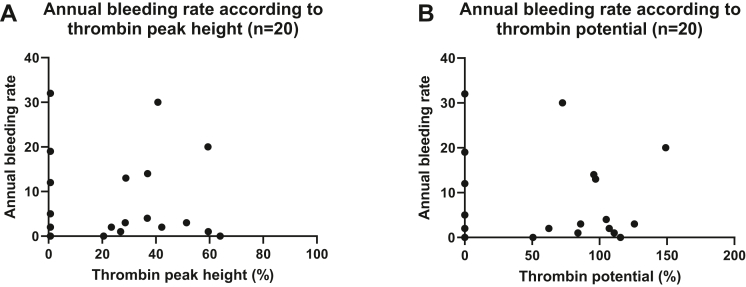
Results: In total, 446 patients, with a median age of 44 years, were included in this substudy. Thrombin generation and plasmin generation parameters differed between patients with hemophilia and healthy individuals. The median thrombin peak height was 1.0 nM, 25.9 nM, 47.1 nM, and 143.9 nM in patients with severe, moderate, and mild hemophilia and healthy individuals, respectively. A severe bleeding phenotype was observed in patients with a thrombin peak height of <49% and a thrombin potential of <72% compared to healthy individuals, and was independent of the hemophilia severity. The median thrombin peak height was 0.70% in patients with a severe clinical bleeding phenotype and 30.3% in patients with a mild clinical bleeding phenotype. The median thrombin potentials for these patients were 0.06% and 59.3%, respectively.
Conclusion: A decreased thrombin generation profile is associated with a severe clinical bleeding phenotype in patients with hemophilia. Thrombin generation in combination with bleeding severity may be a better tool to personalize prophylactic replacement therapy irrespective of hemophilia severity.
Keywords: factor VIII; hemophilia A; hemophilia B; phenotype; thrombin.
© 2023 The Author(s).
Figures
Similar articles
-
Patients with moderate hemophilia A and B with a severe bleeding phenotype have an increased burden of disease.J Thromb Haemost. 2024 Jan;22(1):152-162. doi: 10.1016/j.jtha.2023.09.029. Epub 2023 Oct 7. J Thromb Haemost. 2024. PMID: 37813197
-
Clinical utility of activated partial thromboplastin time clot waveform analysis and thrombin generation test in the evaluation of bleeding phenotype in Hemophilia A.Indian J Pathol Microbiol. 2021 Jan-Mar;64(1):117-122. doi: 10.4103/IJPM.IJPM_336_19. Indian J Pathol Microbiol. 2021. PMID: 33433420
-
Enhanced thrombin and plasmin generation profiles in alpha-2-antiplasmin-deficient patients: Data from the Rare Bleeding disorders in the Netherlands study.Res Pract Thromb Haemost. 2024 Oct 23;8(7):102604. doi: 10.1016/j.rpth.2024.102604. eCollection 2024 Oct. Res Pract Thromb Haemost. 2024. PMID: 39628652 Free PMC article.
-
Thrombin generation and implications for hemophilia therapies: A narrative review.Res Pract Thromb Haemost. 2022 Dec 21;7(1):100018. doi: 10.1016/j.rpth.2022.100018. eCollection 2023 Jan. Res Pract Thromb Haemost. 2022. PMID: 36798897 Free PMC article. Review.
-
Platelets and hemophilia: A review of the literature.Thromb Res. 2017 Jul;155:131-139. doi: 10.1016/j.thromres.2017.05.013. Epub 2017 May 13. Thromb Res. 2017. PMID: 28550758 Review.
Cited by
-
No correlation between thrombin generation and emicizumab levels: implications for monitoring emicizumab therapy.Res Pract Thromb Haemost. 2024 Dec 17;9(1):102658. doi: 10.1016/j.rpth.2024.102658. eCollection 2025 Jan. Res Pract Thromb Haemost. 2024. PMID: 39850577 Free PMC article.
-
Pharmacokinetic-Pharmacodynamic Modelling in Hemophilia A: Relating Thrombin and Plasmin Generation to Factor VIII Activity After Administration of a VWF/FVIII Concentrate.Eur J Drug Metab Pharmacokinet. 2024 Mar;49(2):191-205. doi: 10.1007/s13318-024-00876-6. Epub 2024 Feb 17. Eur J Drug Metab Pharmacokinet. 2024. PMID: 38367175 Free PMC article.
-
Editorial: Advances in thrombin generation.Front Cardiovasc Med. 2023 Mar 30;10:1183718. doi: 10.3389/fcvm.2023.1183718. eCollection 2023. Front Cardiovasc Med. 2023. PMID: 37063969 Free PMC article. No abstract available.
-
The Magic of Proteases: From a Procoagulant and Anticoagulant Factor V to an Equitable Treatment of Its Inherited Deficiency.Int J Mol Sci. 2023 Mar 26;24(7):6243. doi: 10.3390/ijms24076243. Int J Mol Sci. 2023. PMID: 37047215 Free PMC article. Review.
-
Thrombin generation to evaluate the complex hemostatic balance of hemophilia A plasma containing direct oral anticoagulant and supplemented by factor VIII.Res Pract Thromb Haemost. 2024 Sep 23;8(7):102576. doi: 10.1016/j.rpth.2024.102576. eCollection 2024 Oct. Res Pract Thromb Haemost. 2024. PMID: 39498238 Free PMC article.
References
-
- Srivastava A, Santagostino E, Dougall A, Kitchen S, Sutherland M, Pipe SW, et al. WFH Guidelines for the Management of Hemophilia, 3rd edition. Haemophilia 2020;26:1–158. - PubMed
-
- Jayandharan G.R., Srivastava A. The phenotypic heterogeneity of severe hemophilia. Semin Thromb Hemost. 2008;34:128–141. - PubMed
-
- Beltrán-Miranda C.P., Khan A., Jaloma-Cruz A.R., Laffan M.A. Thrombin generation and phenotypic correlation in haemophilia A. Haemophilia. 2005;11:326–334. - PubMed
-
- Dargaud Y., Béguin S., Lienhart A., Al Dieri R., Trzeciak C., Bordet J.C., et al. Evaluation of thrombin generating capacity in plasma from patients with haemophilia A and B. Thromb Haemost. 2005;93:475–480. - PubMed
-
- Lewis S.J., Stephens E., Florou G., Macartney N.J., Hathaway L.S., Knipping J., et al. Measurement of global haemostasis in severe haemophilia A following factor VIII infusion. Br J Haematol. 2007;138:775–782. - PubMed
LinkOut - more resources
Full Text Sources
