. 2023 Feb 27:17:11779322231152972.
doi: 10.1177/11779322231152972. eCollection 2023.

An Integrated Approach of Learning Genetic Networks From Genome-Wide Gene Expression Data Using Gaussian Graphical Model and Monte Carlo Method

Affiliations

An Integrated Approach of Learning Genetic Networks From Genome-Wide Gene Expression Data Using Gaussian Graphical Model and Monte Carlo Method

Haitao Zhao et al. Bioinform Biol Insights. .

Abstract

Global genetic networks provide additional information for the analysis of human diseases, beyond the traditional analysis that focuses on single genes or local networks. The Gaussian graphical model (GGM) is widely applied to learn genetic networks because it defines an undirected graph decoding the conditional dependence between genes. Many algorithms based on the GGM have been proposed for learning genetic network structures. Because the number of gene variables is typically far more than the number of samples collected, and a real genetic network is typically sparse, the graphical lasso implementation of GGM becomes a popular tool for inferring the conditional interdependence among genes. However, graphical lasso, although showing good performance in low dimensional data sets, is computationally expensive and inefficient or even unable to work directly on genome-wide gene expression data sets. In this study, the method of Monte Carlo Gaussian graphical model (MCGGM) was proposed to learn global genetic networks of genes. This method uses a Monte Carlo approach to sample subnetworks from genome-wide gene expression data and graphical lasso to learn the structures of the subnetworks. The learned subnetworks are then integrated to approximate a global genetic network. The proposed method was evaluated with a relatively small real data set of RNA-seq expression levels. The results indicate the proposed method shows a strong ability of decoding the interactions with high conditional dependences among genes. The method was then applied to genome-wide data sets of RNA-seq expression levels. The gene interactions with high interdependence from the estimated global networks show that most of the predicted gene-gene interactions have been reported in the literatures playing important roles in different human cancers. Also, the results validate the ability and reliability of the proposed method to identify high conditional dependences among genes in large-scale data sets.

Keywords: Gaussian graphical model; Monte Carlo method; RNA-seq gene expression; gene interaction; genetic network; graphical lasso.


Conflict of interest statement

The author(s) declared no potential conflicts of interest with respect to the research, authorship, and/or publication of this article.

Figures

Figure 1.
Figure 1.
Flowchart of the proposed MCGGM approach for learning global genetic networks on genome-wide gene expression data set. GGM indicates Gaussian graphical model; MCGGM, Monte Carlo Gaussian graphical model.
Figure 2.
Figure 2.
(A) ROC curve with different thresholds in the estimated networks. The red curve reflects the performance of the MCGGM. The blue dash line represents the no skill ROC. (B) Zoom-in view of the ROC curve in (A) for FPR < 0.06. The different color strips indicate the corresponding thresholds shown in the top left corner in (B). FPR indicates false positive rate; MCGGM, Monte Carlo Gaussian graphical model; ROC, receiver operating characteristics; TPR, true positive rate.
Figure 3.
Figure 3.
Correlation coefficient analysis of gene interactions in EGGM and EMCGGM . The horizontal axis denotes the number of common gene interactions in EGGM and EMCGGM and the vertical axis indicates the correlation coefficient rt .
Figure 4.
Figure 4.
Comparison of the interactions of missing gene pairs. (A) The interactions of missing gene pairs in EGGM . (B) The interactions of missing gene pairs in EMCGGM .
Figure 5.
Figure 5.
Three-score common interactions in at least 8 cancer networks. The genes in the interactions connect with at least 3 other genes. The color of an edge indicates the frequency of the edge crossing the estimated cancer networks. The thickness of an edge represents the median weight of the edge in the crossed cancer networks.
Figure 6.
Figure 6.
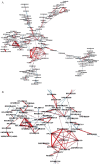
(A) The largest component of the common interactions. Similarly, the color of an edge indicates the number of cancer networks which the edge crosses. The thickness of an edge represents the median weight of the edge in the cancer networks, indicating the degree of conditional dependence between 2 genes. (B) Zoom-in view of the part included in a black rectangle in Figure 6A. The main family genes are highlighted with the dash curve or rectangles.
Figure 7.
Figure 7.
Running time of the graphical lasso with the increasing number of gene variables. The point on the curve indicates the average time. The running time was collected through 10 experiments for each size indicated in the x-axis.

Similar articles

Cited by

References

    1. Stolovitzky G, Monroe D, Califano A. Dialogue on reverse-engineering assessment and methods: the DREAM of high-throughput pathway inference. Ann N Y Acad Sci. 2017;1115:1-22. doi:10.1196/annals.1407.021 - DOI - PubMed
    1. Jensen FV. An Introduction to Bayesian Networks. UCL Press; 1996.
    1. Friedman N, Linial M, Nachman I, Pe’er D. Using Bayesian networks to analyze expression data. J Comput Biol. 2000;7:601-620. doi:10.1089/106652700750050961 - DOI - PubMed
    1. Hartemink A, Gifford D, Jaakkola T, Young R. Using graphical models and genomic expression data to statistically validate models of genetic regulatory networks. Pac Symp Biocomput. 2001:422-433. doi:10.1142/9789814447362_0042 - DOI - PubMed
    1. Imoto S, Goto T, Miyano S. Estimation of genetic networks and functional structures between genes by using Bayesian networks and nonparametric regression. Pac Symp Biocomput. 2002:175-186. doi:10.1142/9789812799623_0017 - DOI - PubMed

LinkOut - more resources