. 2023 May-Jun;31(3):367-383.
doi: 10.1111/wrr.13076. Epub 2023 Mar 21.

Tissue-mimetic culture enhances mesenchymal stem cell secretome capacity to improve regenerative activity of keratinocytes and fibroblasts in vitro

Affiliations

Tissue-mimetic culture enhances mesenchymal stem cell secretome capacity to improve regenerative activity of keratinocytes and fibroblasts in vitro

Jacob G Hodge et al. Wound Repair Regen. 2023 May-Jun.

Abstract

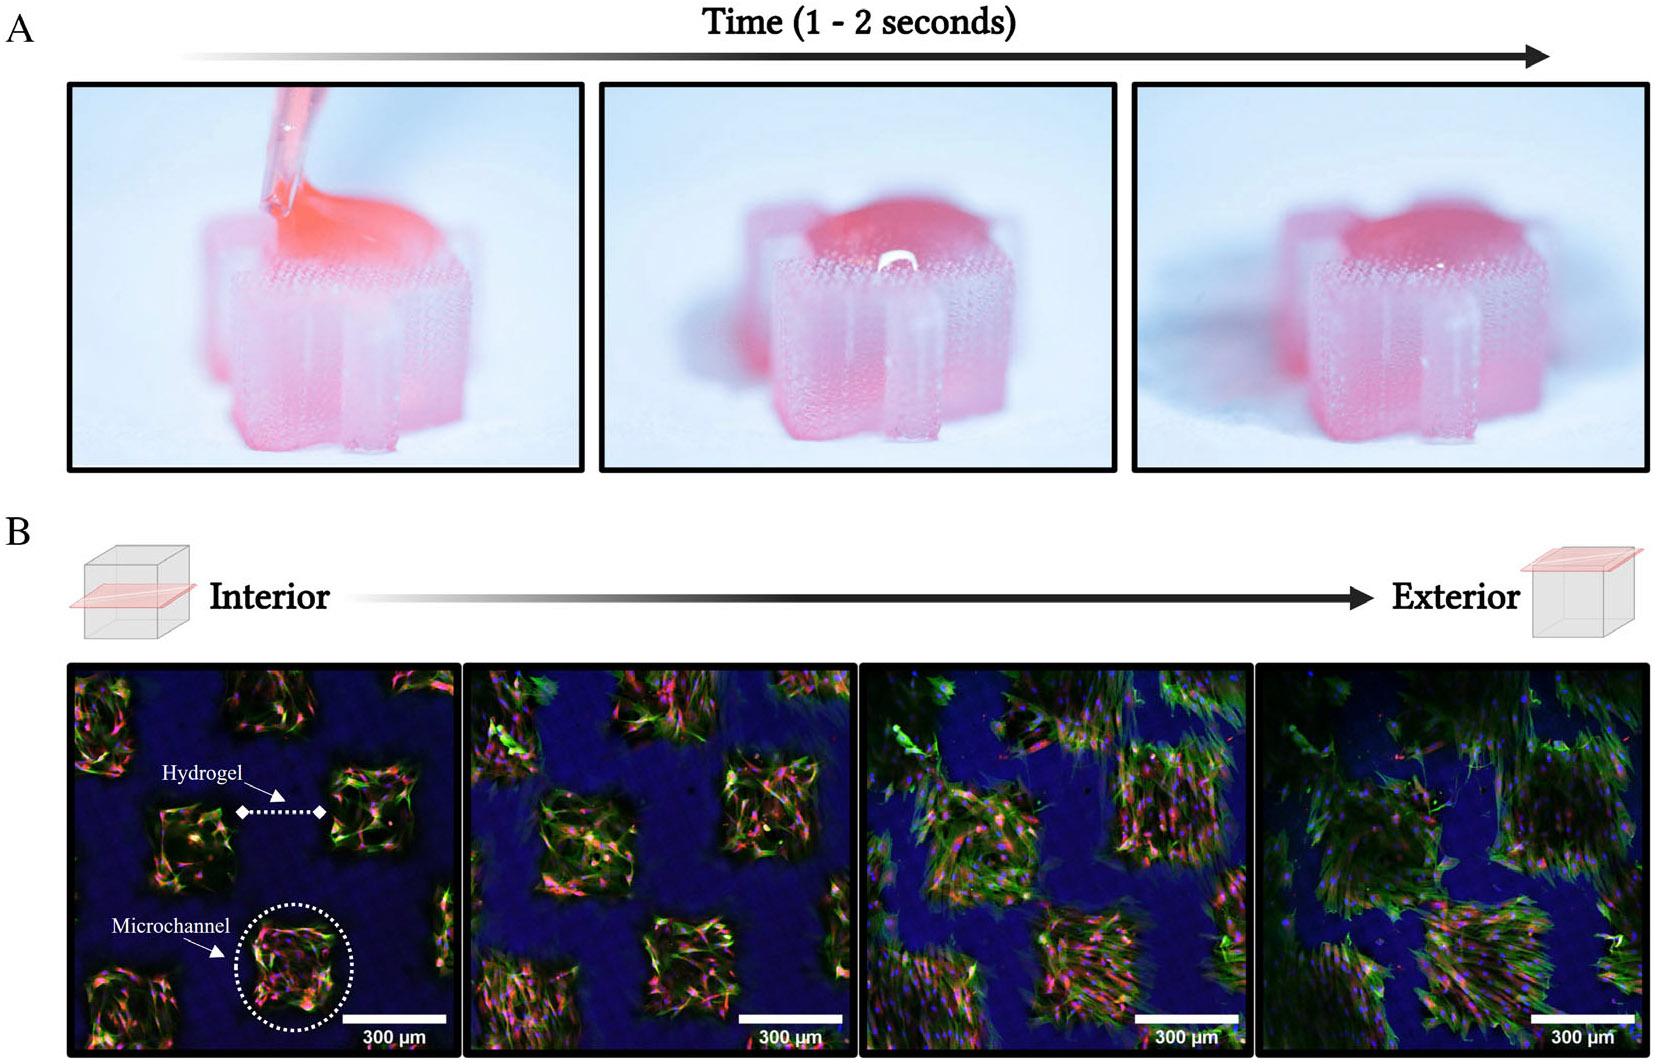
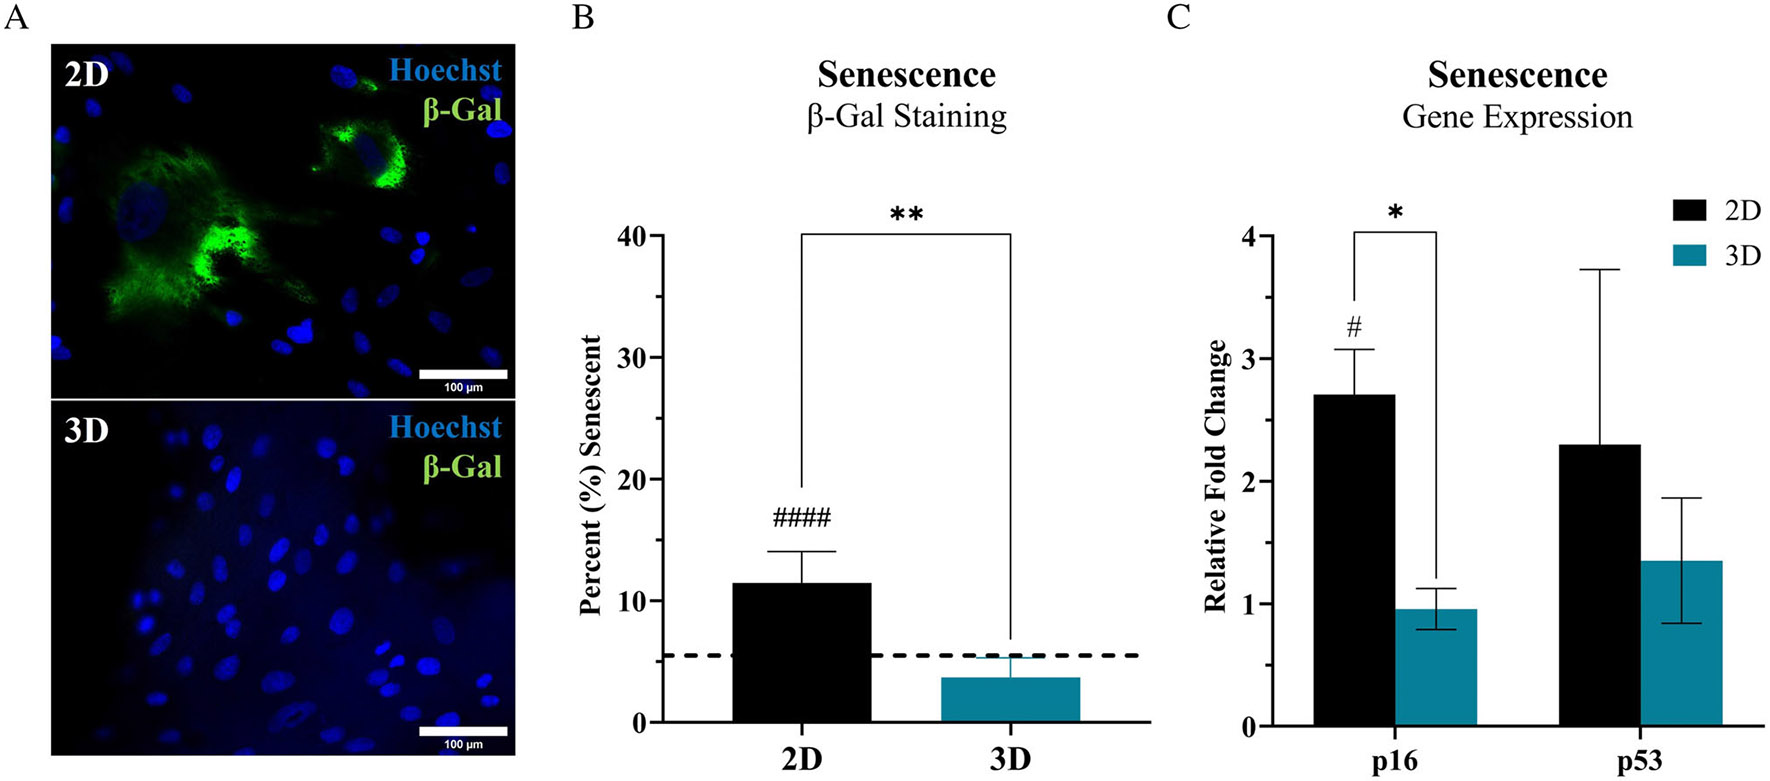
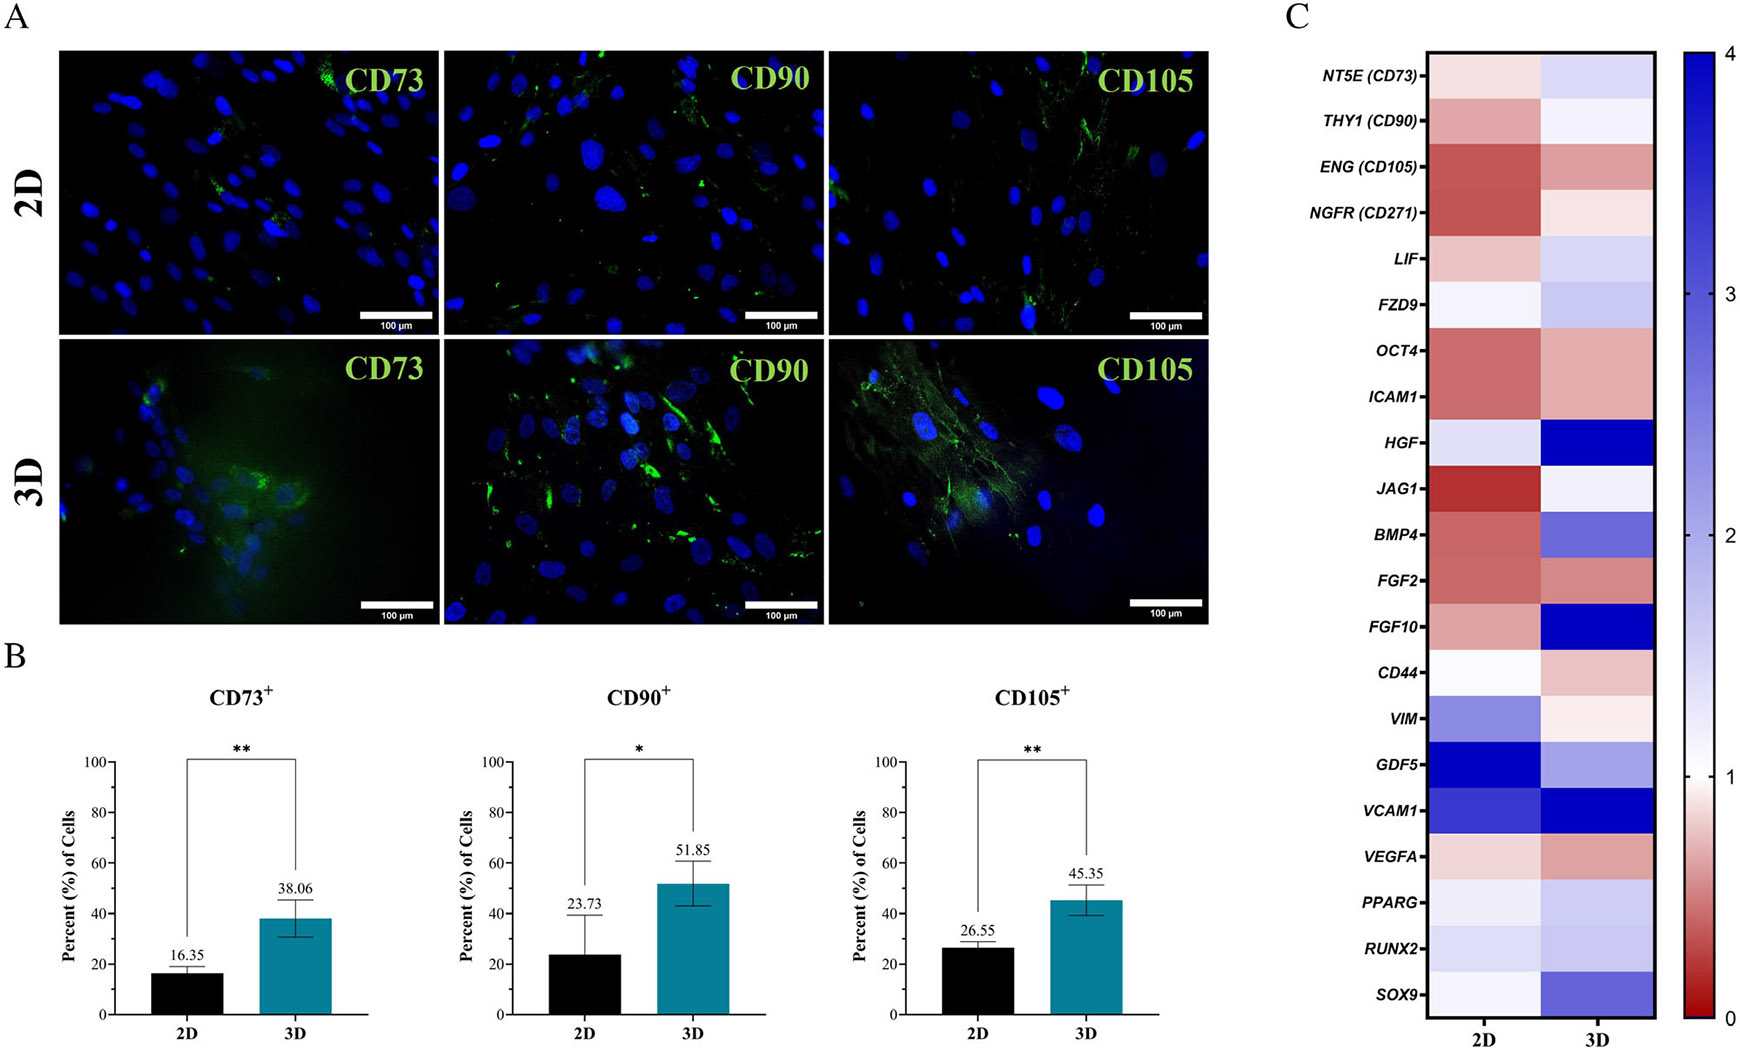
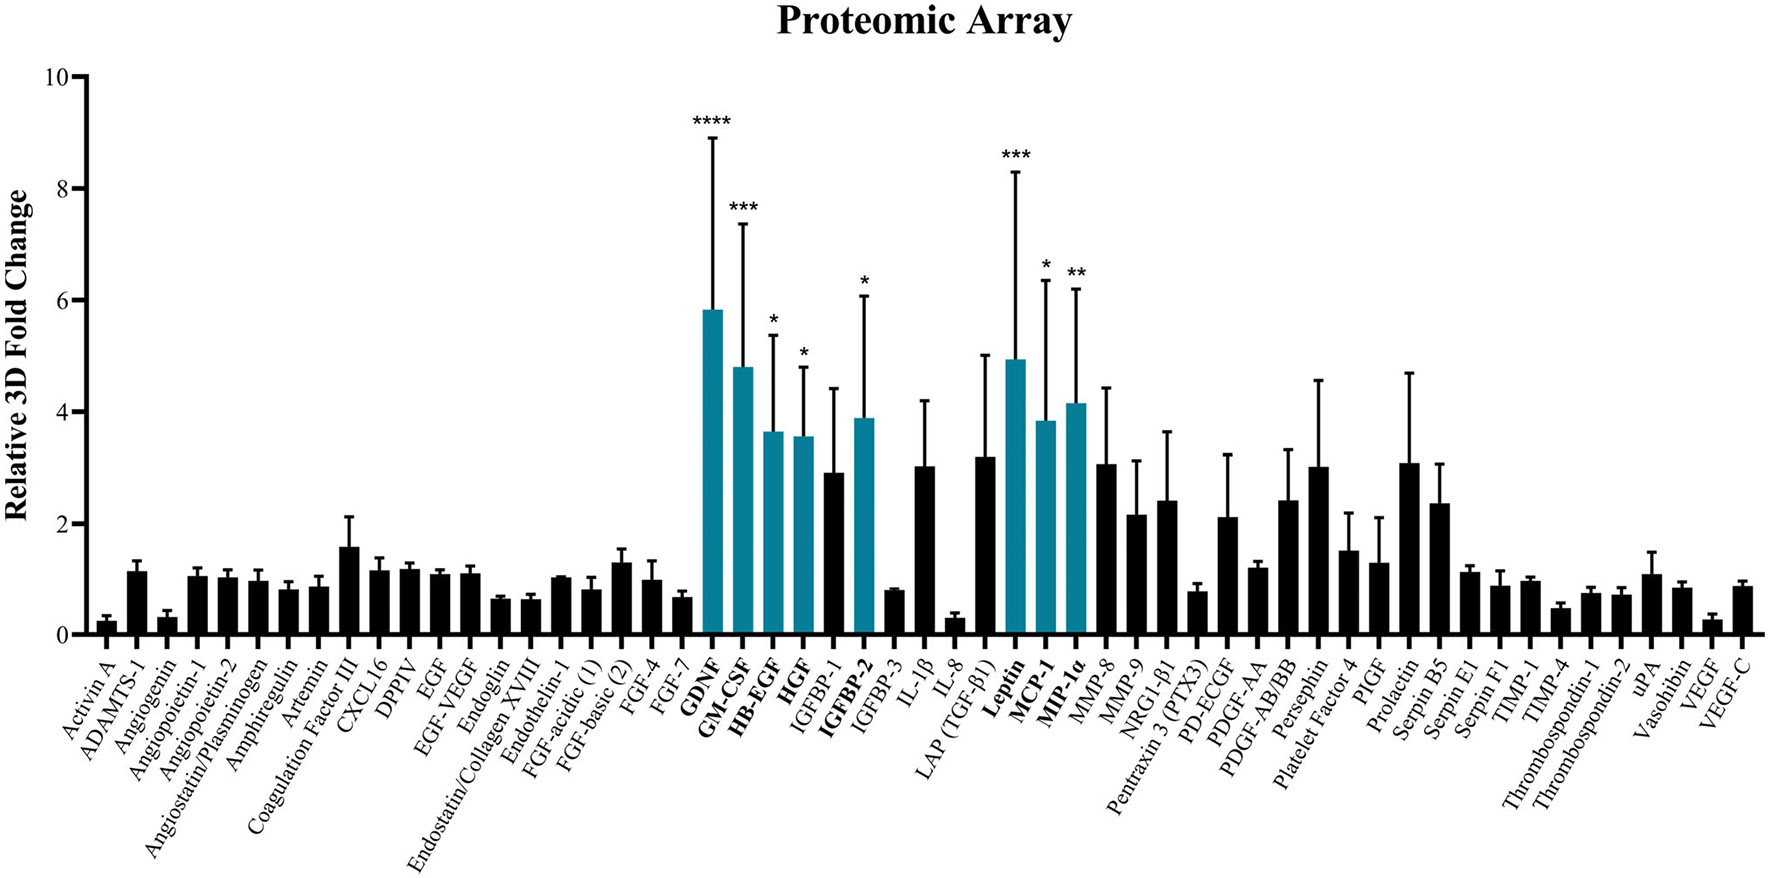
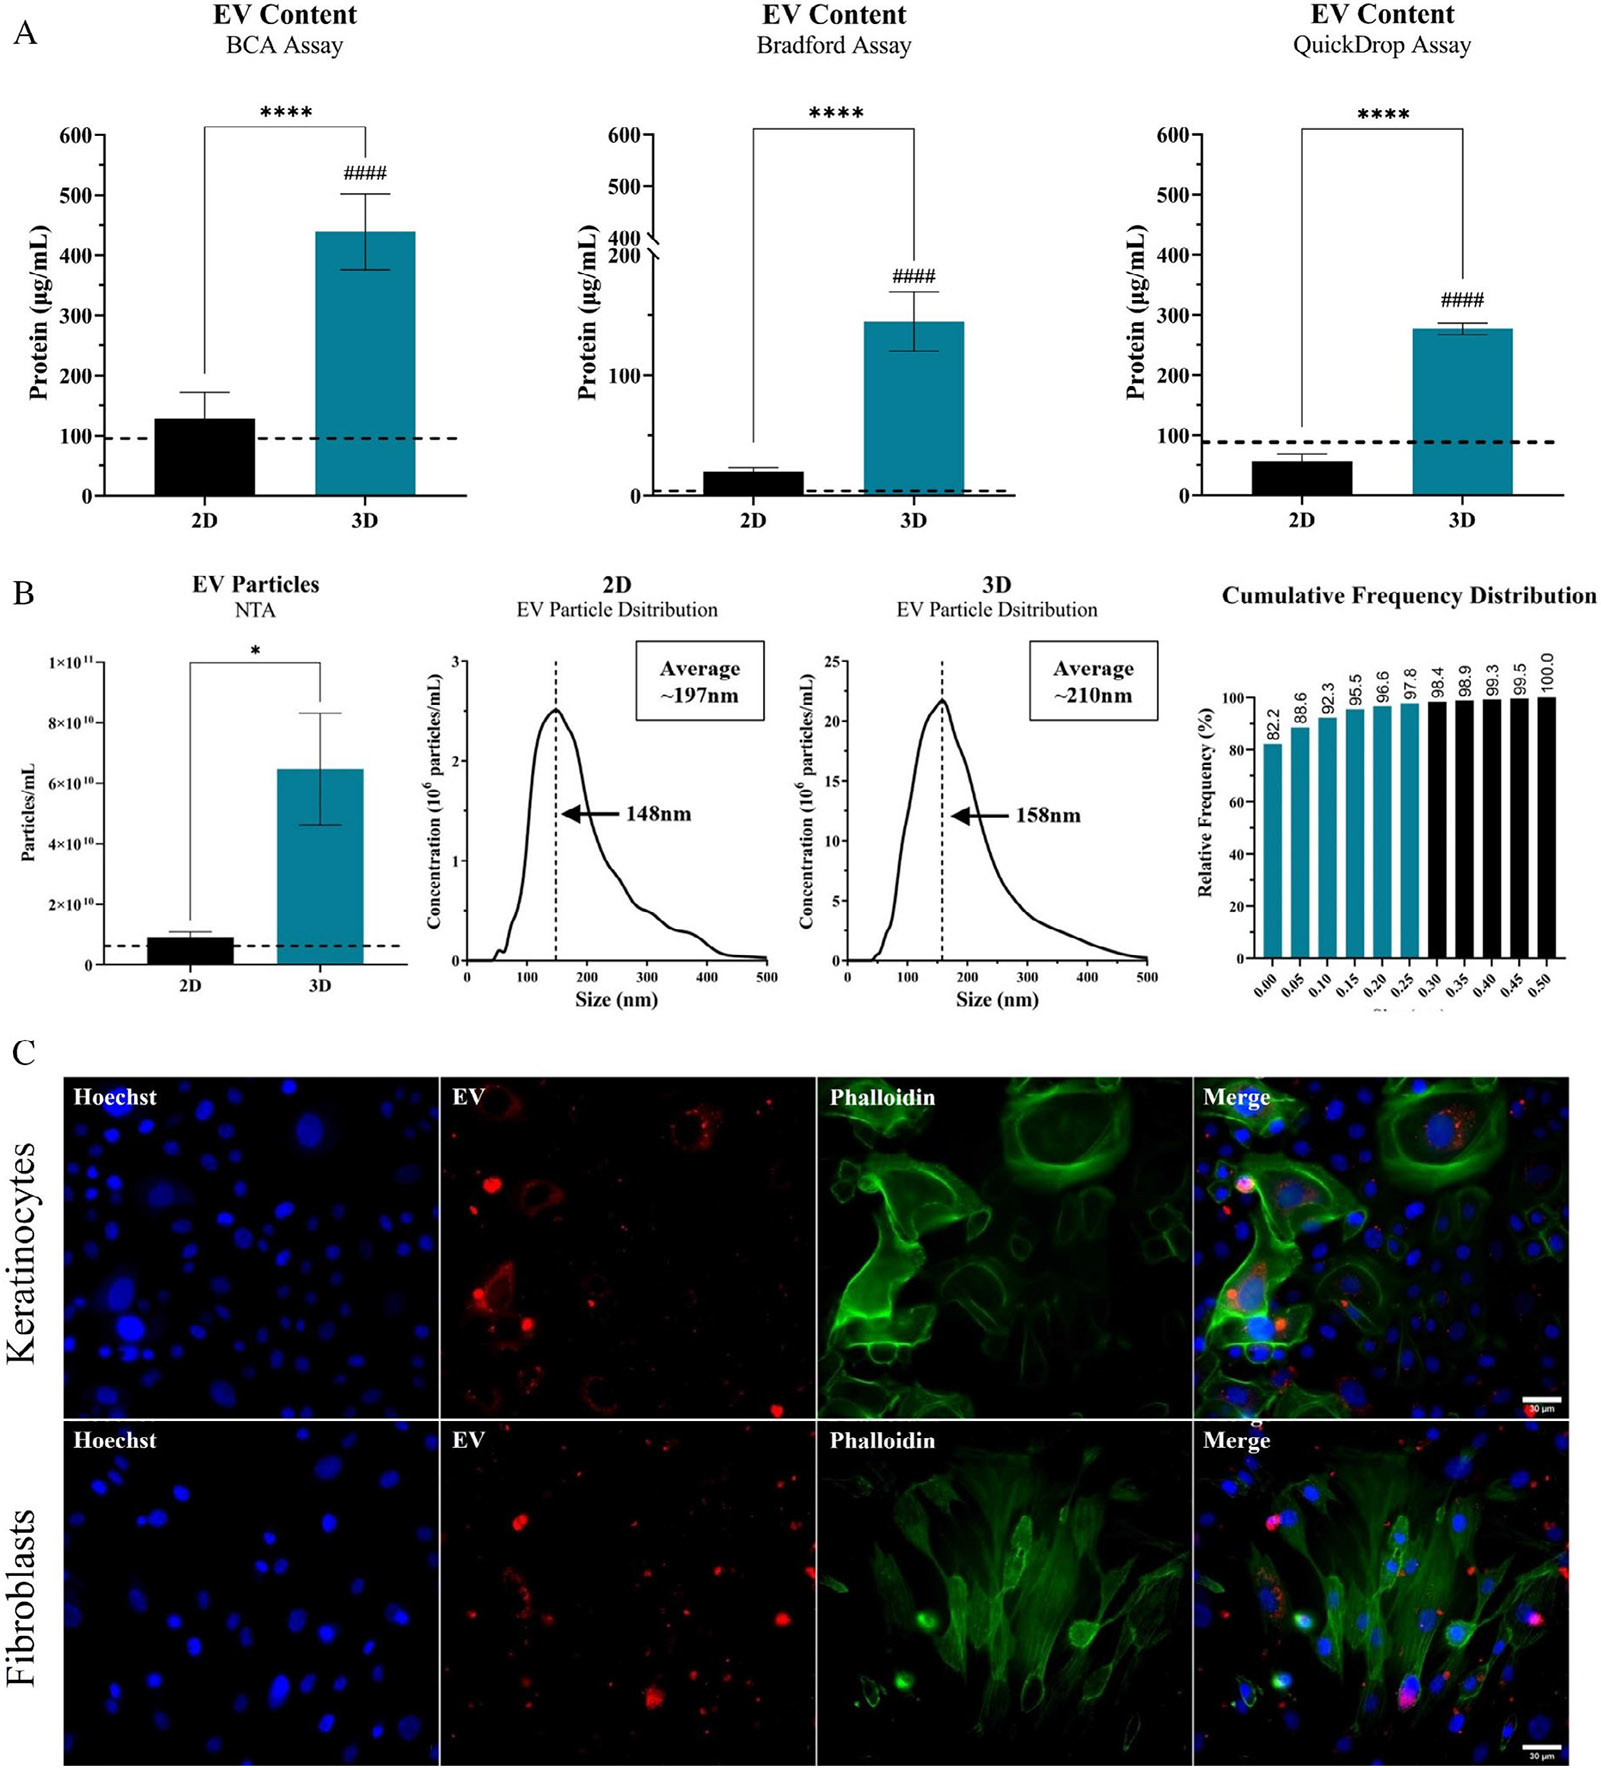
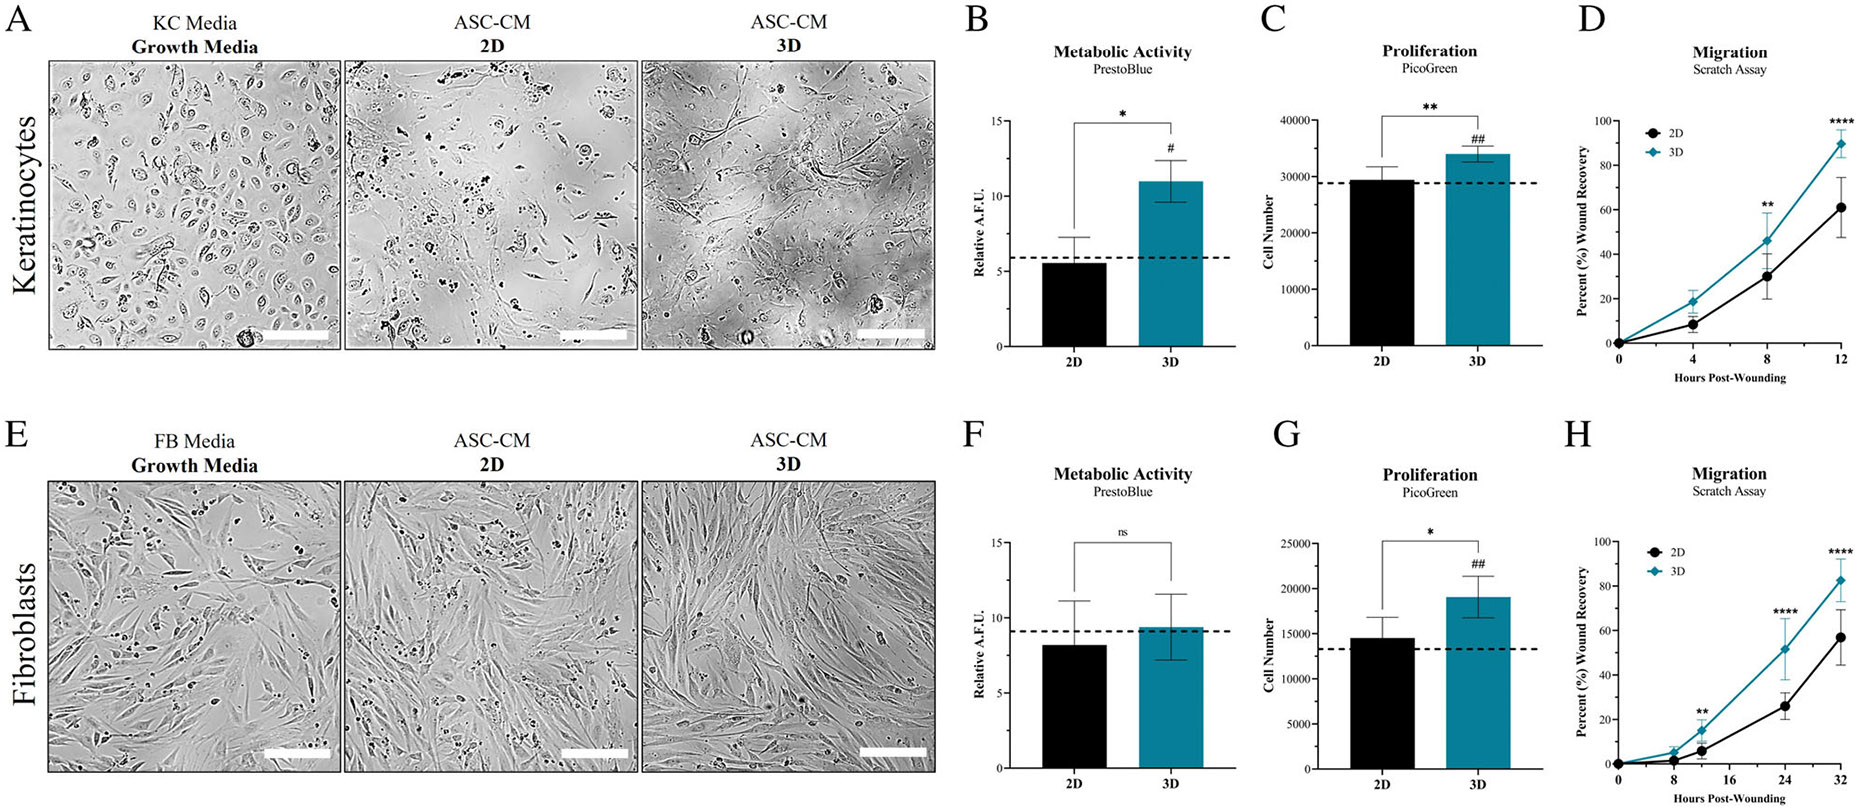
Mesenchymal stem/stromal cells (MSCs) are a heterogenous population of multipotent and highly secretory cells currently being investigated in the field of wound healing for their ability to augment tissue responses. The adaptive response of MSC populations to the rigid substrate of current 2D culture systems has been considered to result in a deterioration of regenerative 'stem-like' properties. In this study, we characterise how the improved culture of adipose-derived mesenchymal stem cells (ASCs) within a tissue-mimetic 3D hydrogel system, that is mechanically similar to native adipose tissue, enhances their regenerative capabilities. Notably, the hydrogel system contains a porous microarchitecture that permits mass transport, enabling efficient collection of secreted cellular compounds. By utilising this 3D system, ASCs retained a significantly higher expression of ASC 'stem-like' markers while demonstrating a significant reduction in senescent populations, relative to 2D. Additionally, culture of ASCs within the 3D system resulted in enhanced secretory activity with significant increases in the secretion of proteinaceous factors, antioxidants and extracellular vesicles (EVs) within the conditioned media (CM) fraction. Lastly, treatment of wound healing cells, keratinocytes (KCs) and fibroblasts (FBs), with ASC-CM from the 2D and 3D systems resulted in augmented functional regenerative activity, with ASC-CM from the 3D system significantly increasing KC and FB metabolic, proliferative and migratory activity. This study demonstrates the potential beneficial role of MSC culture within a tissue-mimetic 3D hydrogel system that more closely mimics native tissue mechanics, and subsequently how the improved phenotype augments secretory activity and potential wound healing capabilities of the MSC secretome.

Keywords: biomaterials; hydrogels; regenerative medicine; secretome; stem cells; tissue engineering.


Conflict of interest statement

CONFLICT OF INTEREST STATEMENT

All authors declare that they do not have any conflict of interest except Heather Decker and Dr. Adam Mellott. Heather Decker and Dr. Mellott declare that they have financial interest with Ronawk, which is the company that produces and donated the T-Blocks used in this study. Heather Decker is the co-founder and CTO and Dr. Mellott is the co-founder and CEO of Ronawk.

Figures

FIGURE 1
FIGURE 1
Culture of ASCs within porous hydrogel system. (A) Demonstration of fluid transport through 3D hydrogel system via application of liquid media to superficial surface of hydrogel. Sequential imaging of the system was taken as the fluid migrated through the pores of the hydrogel. Progression of time moves from leftmost image to rightmost image. Total elapsed time was ~1 to 2 s. Bottom of hydrogel set on white Kimwipe which demonstrates absorption of fluid as it migrates through the hydrogel. (B) Confocal image stacks shown sequentially with section located deepest within the hydrogel shown first (leftmost) and the most superficial section shown last (rightmost). ASCs seeded at ‘P2’ for 2 weeks. ASCs are seen populating within the porous architecture of the 3D tissue-mimetic hydrogel rather than embedded within the hydrogel. Stains include Hoechst 33342 (Blue), Phalloidin-AF488 (Green) and MitoTracker (Red). Scale bar = 300 μm.
FIGURE 2
FIGURE 2
Tissue-mimetic hydrogel culture decreases ASC senescence. ASCs seeded at ‘P2’ within the 3D hydrogel system or continuously subcultured for 2 weeks in traditional 2D culture until reaching ‘P5’. The ‘P5’ ASCs were used for characterisation in 2D and ‘P5’ passage-equivalent were used for 3D. (A) At the conclusion of culture period, ASCs were fixed and stained for senescence/β-galactosidase (Green), Hoechst 33342 (Blue) and Phalloidin-AF647 (Not Shown). (B) ASCs cultured in 2D (Black Bar) or 3D (Teal Bar) were evaluated using a 20× objective. ASCs seeded in 2D at ‘P2’ were used as an initial control population and denoted as the dashed line (Black). All image quantification data is displayed as a bar graph and is the result of averaging each group of technical replicates (different images within each biological replicate) to quantify senescence. Samples done is quadruplicate (n = 4). Scale bar = 100 μm. (C) Relative fold change in gene expression for ‘P5’ ASCs in both 2D and 3D was assessed for changes in senescence-associated markers, p16 (left) and p53 (right), relative to ‘P2’ baseline control cells. Samples done in triplicate (n = 3). All error bars are standard deviation. One-way ANOVA with Tukey’s post-hoc was used for statistical analysis. Significance is denoted as *p < 0.05 or ****p < 0.0001 for 2D versus 3D comparison and #p < 0.05 or ####p < 0.0001 for comparison relative to ‘P2’ control.
FIGURE 3
FIGURE 3
Tissue-mimetic hydrogel culture improves retainment of ASC phenotype. ASCs seeded at ‘P2’ within the 3D hydrogel system of continuously subcultured for 2 weeks in traditional 2D culture until reaching ‘P5’. The ‘P5’ ASCs were used for characterisation in 2D and ‘P5’ passage-equivalent were used for 3D. (A) At the conclusion of culture period, ASCs were fixed and stained for either CD73, CD90 or CD105 (Green) and CD34 or CD45 (Not Shown). Samples were counterstained with Hoechst 33342 (Blue). Representative images of 2D (Top Row) and 3D (Bottom Row) samples. (B) Quantification of imaging data performed and total percent (%) positive cells denoted with bar graphs for each marker (Bottom Panel). ASCs in 2D (Black Bar) or 3D (Teal Bar) were evaluated using a 20× objective. Samples done is quadruplicate (n = 4). Scale bar = 100 μm. Error bars are standard deviation. One-way ANOVA with Tukey's post-hoc used for statistical analysis. Significance is denoted as ****p < 0.0001. (C) A heatmap representing the relative fold change of twenty-one (21) key genes are displayed for the gene expression of ‘P5’ ASCs in 2D (left) or 3D (right). Fold change is relative to baseline control ‘P2’ ASCs (indicated by white colour) Downregulation of gene expression denoted with ‘red’ colour and up-regulating denoted with ‘blue’ colour. Values are normalised to a group of endogenous control genes that included GAPDH, ACTB and B2M.
FIGURE 4
FIGURE 4
Altered secretory activity of ASCs within tissue-mimetic hydrogel. ASCs seeded at ‘P2’ within the 3D hydrogel system or subcultured one additional time in traditional 2D culture until reaching ‘P3’. The ‘P3’ ASCs were used for characterisation in 2D and ‘P3’ passage-equivalent were used for 3D. ASC-CM was collected from the ‘P3’ and ‘P3’ passage-equivalent ASC cultures, for 2D and 3D, respectively. Relative chemiluminescence was determined for each proteome array membrane. Average fold change was calculated and displayed as 3D:2D ratio. Assay was performed in triplicate (n = 3) and averaged. Significant differences in 3D relative to 2D are denoted (Teal Bars). Proteins indicating no significant difference are denoted with black bars. Error bars are standard deviation. One-way ANOVA with Tukey's post-hoc used for statistical analysis. Significance is denoted as *p < 0.05, **p < 0.001, ***p < 0.001 and ****p < 0.0001 for 2D versus 3D comparison.
FIGURE 5
FIGURE 5
Enhanced production of EVs within tissue-mimetic hydrogel. (A) ASCs seeded at ‘P2’ within the 3D hydrogel system or continuously subcultured for 2 weeks in traditional 2D culture until reaching ‘P5’. The ‘P5’ ASCs were used for characterisation in 2D and ‘P5’ passage-equivalent were used for 3D. ASC-CM was collected from the ‘P5’ and ‘P5’ passage-equivalent ASC cultures. The EV fraction of ASC-CM was isolated, purified and analysed for relative protein content via three different modalities, BCA (leftmost), Bradford (middle) and QuickDrop (rightmost). Concentration of EV protein fraction displayed as average ‘μg/mL’ within the initial cell culture volume before concentrating with 100-kDa filter. Concentration within control media was analysed and is displayed as dashed line (Black). (B) Isolated EV fractions were then analysed with NTA for determining concentration of particles/mL within media (leftmost) and to assess size distribution of the measured particles and the cumulative frequency of the different EV particle sizes (rightmost) to determine whether measure particles are truly within EV size range. Assays were performed in triplicate (n = 3) and averaged. Error bars are standard deviation. One-way ANOVA with Tukey's post-hoc used for statistical analysis. Significance denoted as ****p < 0.0001 for 2D versus 3D comparison and ####p < 0.0001 for 3D comparison relative to media control. (C) Representative images of fluorescent-labelled Keratinocytes (Top) and Fibroblasts (Bottom) that were treated with media supplemented with labelled-EVs from 3D ASC-CM for 18 h. Samples imaged with a 40× objective. Scale bar = 30 μm.
FIGURE 6
FIGURE 6
ASC secretome from tissue-mimetic culture enhances KC and FB activity. ASCs seeded at ‘P2’ within the 3D hydrogel system or continuously subcultured for 2 weeks in traditional 2D culture until reaching ‘P5’. The ‘P5’ ASCs were used for characterisation in 2D and ‘P5’ passage-equivalent were used for 3D. ASC-CM was collected from the ‘P5’ and ‘P5’ passage-equivalent ASC cultures, for 2D and 3D, respectively. ASC-CM from 2D and 3D was then used to treat KCs (A–D) and FBs (E–H). (A, E) KCs and FBs were assessed for morphological, (B, F) metabolic, (C, G) proliferative and (D, H) migratory changes. Metabolic activity was quantified via PrestoBlue and then standardised to relative fluorescence of Hoechst 33342 per 96-well, to provide an average R.F.U. value. Proliferative activity was quantified via PicoGreen and then average cell number per 96-well was determined. Average values for KCs and FBs treated with standard growth media is denoted by dashed line (Black). Metabolic and Proliferative activity was performed with five replicates (n = 5). Migratory activity was assessed via scratch assay recovery. The voided space created by a pipette tip was evaluated for recovery of area via migration of KCs and FBs. Whole well images were acquired and the recovery area of three different locations per well were averaged. Migration samples were performed in triplicate (n = 3) for a total of nine images per treatment group. Average area closed/recovered are denoted for each time point for KCs and FBs after treatment with ASC-CM from 2D (Black Circles) or 3D (Teal Diamonds). Significance is denoted as *p < 0.05, **p < 0.01 and ****p < 0.0001, and #p < 0.05 or ##p < 0.01 for 3D comparison relative to media control. Error bars are standard deviation. One-way ANOVA was used for Metabolic and Proliferative assays. Two-way ANOVA was used for Migratory assay. Scale bar = 200 μm.

Similar articles

Cited by

References

    1. Han Y, Li X, Zhang Y, Han Y, Chang F, Ding J. Mesenchymal stem cells for regenerative medicine. Cell. 2019;8:886. doi: 10.3390/cells8080886 - DOI - PMC - PubMed
    1. Tsuji W, Rubin JP, Marra KG. Adipose-derived stem cells: implications in tissue regeneration. World J Stem Cells. 2014;6:312–321. doi: 10.4252/wjsc.v6.i3.312 - DOI - PMC - PubMed
    1. Hass R, Kasper C, Bohm S, Jacobs R. Different populations and sources of human mesenchymal stem cells (MSC): a comparison of adult and neonatal tissue-derived MSC. Cell Commun Signal. 2011;9:12. doi: 10.1186/1478-811X-9-12 - DOI - PMC - PubMed
    1. Dominici M, le Blanc K, Mueller I, et al. Minimal criteria for defining multipotent mesenchymal stromal cells. The International Society for Cellular Therapy position statement. Cytotherapy. 2006;8:315–317. doi: 10.1080/14653240600855905 - DOI - PubMed
    1. Prabhakaran MP, Venugopal JR, Ramakrishna S. Mesenchymal stem cell differentiation to neuronal cells on electrospun nanofibrous substrates for nerve tissue engineering. Biomaterials. 2009;30:4996–5003. doi: 10.1016/j.biomaterials.2009.05.057 - DOI - PubMed

Publication types

LinkOut - more resources