

Resuscitation dynamics reveal persister partitioning after antibiotic treatment
- PMID: 36866643
- PMCID: PMC10090945
- DOI: 10.15252/msb.202211320
Resuscitation dynamics reveal persister partitioning after antibiotic treatment
Erratum in
-
Resuscitation dynamics reveal persister partitioning after antibiotic treatment.Mol Syst Biol. 2023 May 9;19(5):e11672. doi: 10.15252/msb.202311672. Epub 2023 May 4. Mol Syst Biol. 2023. PMID: 37143394 Free PMC article.
Abstract
Bacteria can survive antibiotics by forming dormant, drug-tolerant persisters. Persisters can resuscitate from dormancy after treatment and prolong infections. Resuscitation is thought to occur stochastically, but its transient, single-cell nature makes it difficult to investigate. We tracked the resuscitation of individual persisters by microscopy after ampicillin treatment and, by characterizing their dynamics, discovered that Escherichia coli and Salmonella enterica persisters resuscitate exponentially rather than stochastically. We demonstrated that the key parameters controlling resuscitation map to the ampicillin concentration during treatment and efflux during resuscitation. Consistently, we observed many persister progeny have structural defects and transcriptional responses indicative of cellular damage, for both β-lactam and quinolone antibiotics. During resuscitation, damaged persisters partition unevenly, generating both healthy daughter cells and defective ones. This persister partitioning phenomenon was observed in S. enterica, Klebsiella pneumoniae, Pseudomonas aeruginosa, and an E. coli urinary tract infection (UTI) isolate. It was also observed in the standard persister assay and after in situ treatment of a clinical UTI sample. This study reveals novel properties of resuscitation and indicates that persister partitioning may be a survival strategy in bacteria that lack genetic resistance.
Keywords: antibiotics; dynamics; partitioning; persister; resuscitation.
© 2023 The Authors. Published under the terms of the CC BY 4.0 license.
Conflict of interest statement
The authors declare that they have no conflict of interest.
Figures

Example micrographs of single‐cell persister resuscitation after ampicillin (100 μg/ml) treatment. Tiled images have been acquired and stitched. Scale bar: 2 μm.
Growth of persister progeny after resuscitation (illustrative data for 27 colonies, lineages are alternatingly colored black and red).
Cellular doubling time (δ) of persister progeny as a function of resuscitation time (t R ) (n = 127 cell lineages). Correlation coefficient (ρ) is indicated on plot.
Dynamical model of resuscitation as a two‐state process governed by rate parameter (k).

Normalized distribution of t R (n = 228 cell lineages), with stochastic model fit (dashed line).
Time‐dependence of k calculated from data in (A). Exponential fit (, red line) with R 2 and stochastic fit (dashed black line) are depicted.
Resuscitation curve (% persisters still dormant as a function of time) with stochastic (dashed black line) and exponential (red line) model fits.
Illustration of automated image analysis for fluorescence experiments to determine continuous‐time t R values. Tiled images have been acquired and stitched. The same representative image is used in Appendix Fig S5.
Resuscitation curve based continuous‐time t R , with stochastic (dashed black line) and exponential (red line) model fits (n = 645 microcolonies).

Resuscitation curves after cells were treated with different antibiotic (ampicillin) concentrations (black, 50 μg/ml, n = 279; blue, 100 μg/ml, n = 261; green, 150 μg/ml, n = 214; and red 200 μg/ml, n = 178. Data were binned into 10 time points). t R values calculated with continuous‐time approach; curves depict exponential‐model fits.
Resuscitation parameter α dependence on antibiotic treatment concentration, calculated from data presented in (A).
Resuscitation curve for wild‐type (BW25113; n = 330) and efflux‐impaired ΔtolC (n = 122) strains with exponential‐model fit curves.
Resuscitation curves for persisters incubated with different efflux inhibitor (PAβN) concentrations (black, 0 μg/ml, n = 121; blue, 50 μg/ml, n = 171; green, 100 μg/ml, n = 186; and red 200 μg/ml, n = 107) with exponential‐model fit curves.
Resuscitation parameter α dependence on PAβN concentration, calculated from data presented in (D).
Schematic representation of resuscitation dynamics, controlled by antibiotic concentration during treatment and molecular efflux after treatment.

Example micrographs of progeny derived from a single persister after resuscitation from ampicillin treatment. Cell structural damage is indicated by white arrow. Scale bar: 2 μm.
Representative example of resuscitation in persister carrying fluorescent transcriptional reporter pbpG‐GFP. Scale bar: 8 μm.
Fluorescence of healthy and damaged persister progeny cells containing pbpG‐GFP 2 h after the end of ampicillin treatment (values represent mean ± SD, n = 12, biological replicates; * indicates P < 0.01 by Student's t test).
Representative examples of the distinct resuscitation fates of individual cells observed after ampicillin treatment. Cells contained constitutive ompC‐GFP for visualization. Arrows indicate damaged cells. Scale bar: 5 μm.
Pie chart depicting the relative proportions of healthy, damaged, and failed persisters after ampicillin treatment. Results calculated from four data sets.
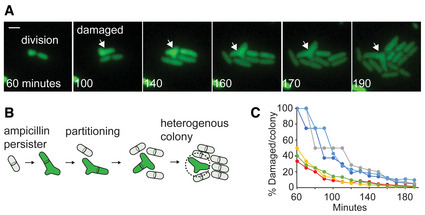
Representative example of resuscitation and partitioning in a persister after ampicillin treatment. Cells contained constitutive ompC‐GFP for visualization. 1st division is shown in 60‐min image and arrows indicate damaged cells. Scale bar: 2 μm.
Diagram illustrating the observed ampicillin persister partitioning during resuscitation.
Percentage of progeny with structural defects in microcolonies derived from damaged ampicillin persisters. Data obtained from six representative microcolonies.

Representative example of the resuscitation fates of individual cells observed after norfloxacin treatment. Cells contained constitutive ompC‐GFP for visualization. Arrows indicate non‐growing persister progeny cells. Scale bar: 5 μm.
Pie chart depicting the relative proportions of healthy, damaged, and failed persisters after norfloxacin treatment. Results calculated from three data sets. The same figure is used as wild‐type control in Appendix Fig S32.
Representative example of resuscitation and partitioning in a persister after norfloxacin treatment. Cells contained constitutive ompC‐GFP for visualization. 1st and 2nd divisions occur at the 140‐min image and arrows indicate nongrowing persister progeny cells. Scale bar: 2 μm.
Diagram illustrating the observed norfloxacin persister partitioning during resuscitation.
Percentage of damaged/nongrowing progeny in microcolonies derived from damaged norfloxacin persisters. Data obtained from six representative microcolonies.

Representative example of resuscitation in norfloxacin persister carrying fluorescent transcriptional reporter recA‐GFP. The same images are used in the Appendix Fig S30. Scale bar: 8 μm.
Fluorescence of healthy and damaged persister progeny cells containing recA‐GFP 6 h after the end of norfloxacin treatment (values represent mean ± SD, n = 27; * indicates P < 0.01 by Student's t test).
Maximum cell fluorescence in individual damaged or failed persisters containing recA‐GFP after norfloxacin treatment. Fluorescence values are plotted against resuscitation time (for damaged persisters, n = 63) or evident death time (for failed persisters, n = 23).
Survival curve wide‐type and lexA3 cells treated with 5 μg/ml norfloxacin (values represent mean ± SD, n = 3, biological replicates; * indicates P < 0.01 by student's t test).
Representative examples of 1st division in wild‐type and lexA3 persisters after norfloxacin treatment. Scale bar: 3 μm.
Pie chart depicting the relative proportions of healthy, damaged, and failed lexA3 persisters after norfloxacin treatment. Results calculated from three data sets.
Time of 1st division in damaged wild‐type persisters (n = 24) and lexA3 persisters (n = 12) after norfloxacin treatment (values represent mean ± SD). Tops and bottoms of boxes in box‐whisker plots correspond to the 25th and 75th percentiles, central lines correspond to medians, whisker extents correspond to 1.5× the interquartile range.
Cell area at 1st division for damaged wild‐type persisters (n = 24) and lexA3 persisters (n = 12) during resuscitation after norfloxacin treatment (values represent mean ± SD, * indicates P < 0.01 by student's t test). Tops and bottoms of boxes in box‐whisker plots correspond to the 25th and 75th percentiles, central lines correspond to medians, whisker extents correspond to 1.5× the interquartile range.
Non‐growing progeny cells within microcolonies derived from individual damaged wide‐type persisters (n = 19) and lexA3 persisters (n = 19) after norfloxacin treatment (values represent mean ± SD, * indicates P < 0.01 by Student's t test). Tops and bottoms of boxes in box‐whisker plots correspond to the 25th and 75th percentiles, central lines correspond to medians, whisker extents correspond to 1.5× the interquartile range.

Diagram illustrating agar outgrowth in the standard persister assay.
Representative examples of early microcolonies derived from single ampicillin persisters following standard persister assay with LB agar plating. Cells contained constitutive ompC‐GFP for visualization. Arrows indicate damaged cells. Left: fluorescence, right: DIC. Scale bar: 3 μm.
Representative examples of early microcolonies derived from single norfloxacin persisters following standard persister assay with LB agar plating. Cells contained constitutive ompC‐GFP for visualization. Arrows indicate non‐growing progeny cells. Left: fluorescence, right: DIC. Scale bar: 3 μm.
Survival of in situ‐treated UTI sample (red) and in vitro‐treatment (blue) of the same strains with imipenem or norfloxacin (values represent mean ± SD; in vitro: n = 3, biological replicates, in situ: n = 1; * indicates P < 0.01 by t test).
Representative examples of progeny from partitioned (left) and healthy (right) persisters following in situ (upper) and in vitro (lower) imipenem treatment of an E. coli UTI sample. Arrows indicate damaged cells. Scale bar: 3 μm.
Representative examples of progeny from partitioned (left) and healthy (right) persisters following in situ (upper) and in vitro (lower) norfloxacin treatment of an E. coli UTI sample. Arrows indicate non‐growing progeny cells. Scale bar: 6 μm.
References
Publication types
MeSH terms
Substances
Grants and funding
LinkOut - more resources
Full Text Sources
Medical
Molecular Biology Databases
