. 2023 Mar 28;42(3):112200.
doi: 10.1016/j.celrep.2023.112200. Epub 2023 Mar 1.

Thalamic control of sensory processing and spindles in a biophysical somatosensory thalamoreticular circuit model of wakefulness and sleep

Affiliations

Thalamic control of sensory processing and spindles in a biophysical somatosensory thalamoreticular circuit model of wakefulness and sleep

Elisabetta Iavarone et al. Cell Rep. .

Abstract

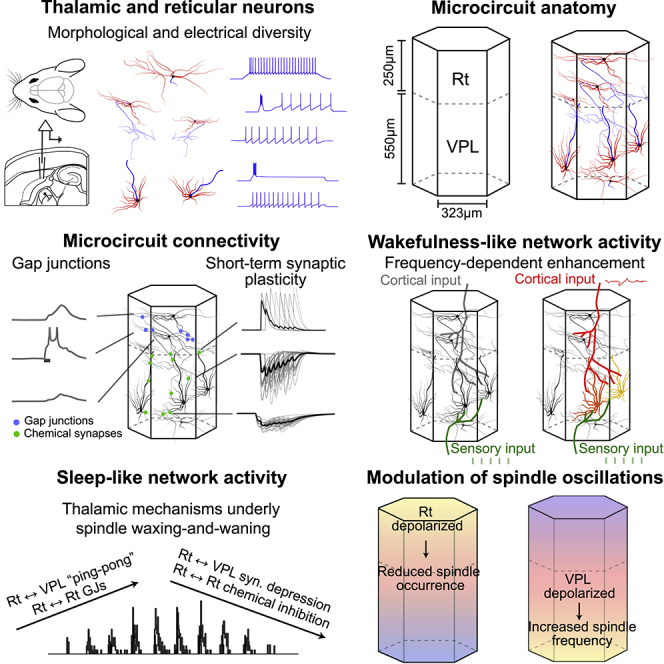
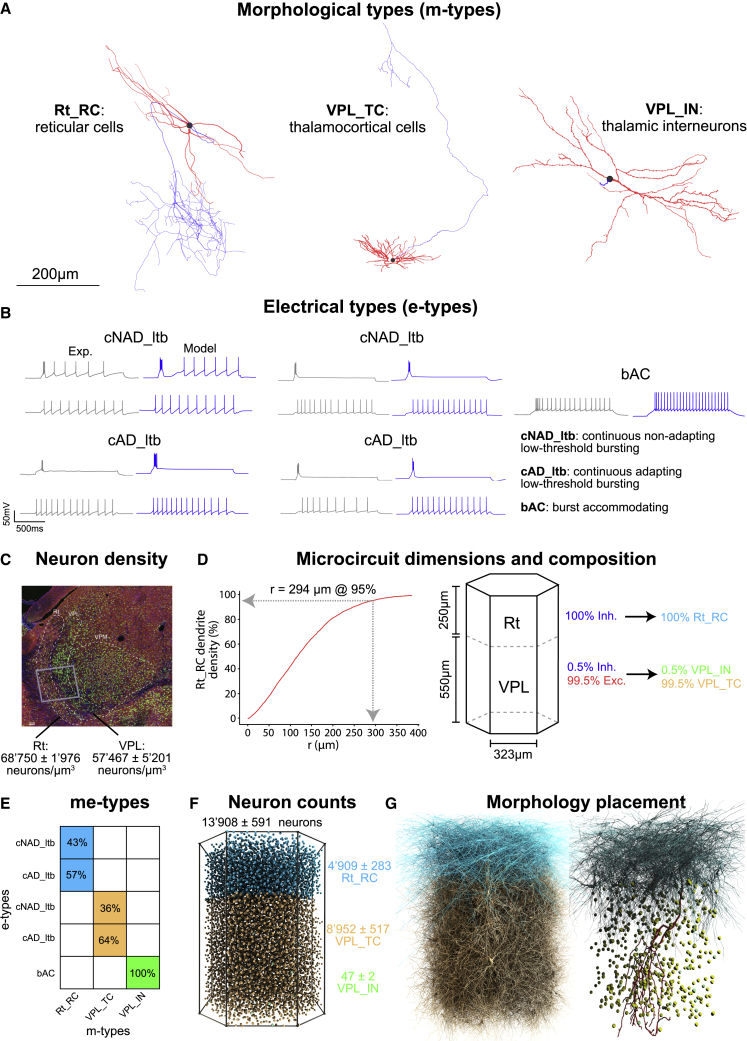
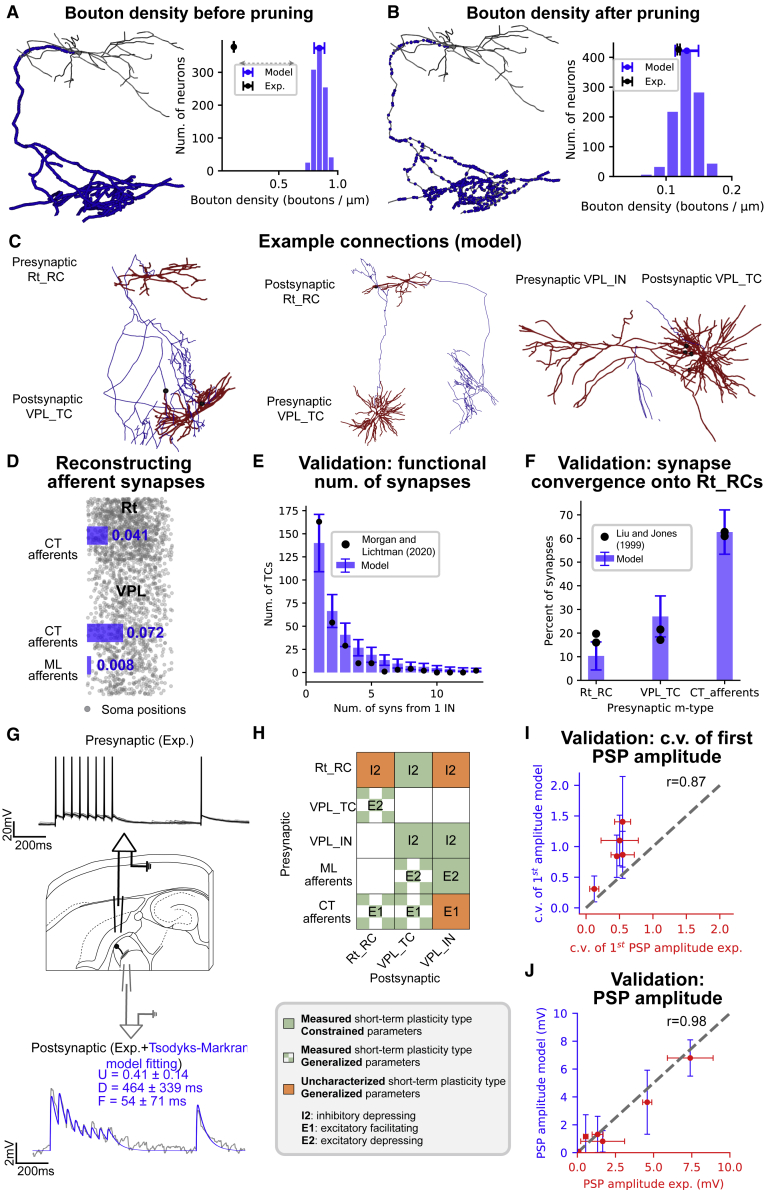
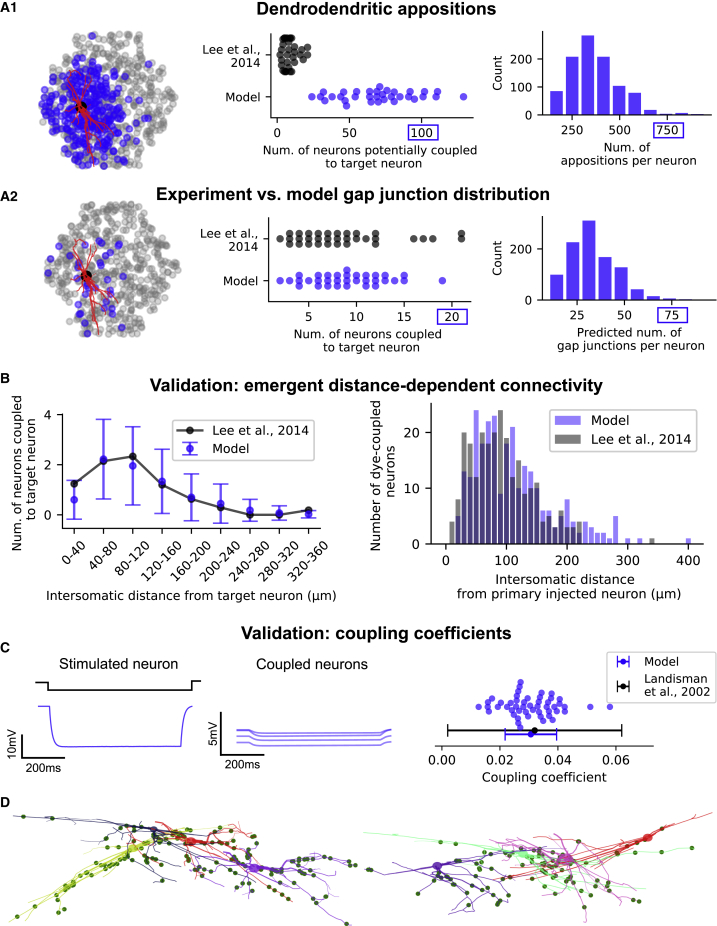
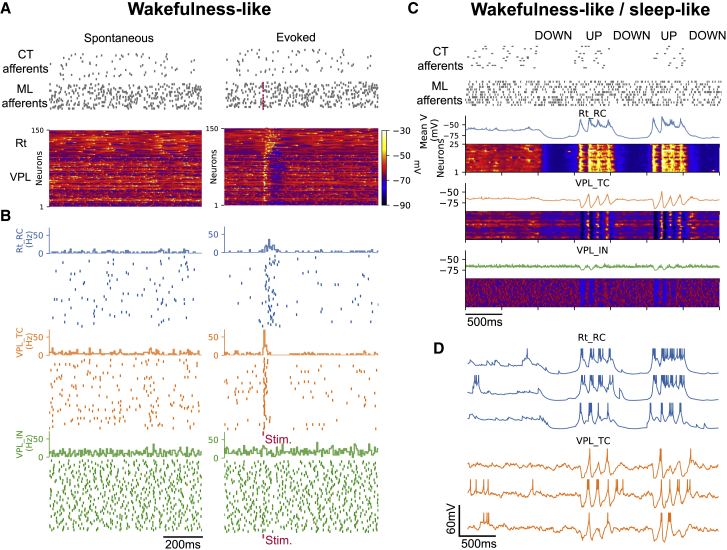
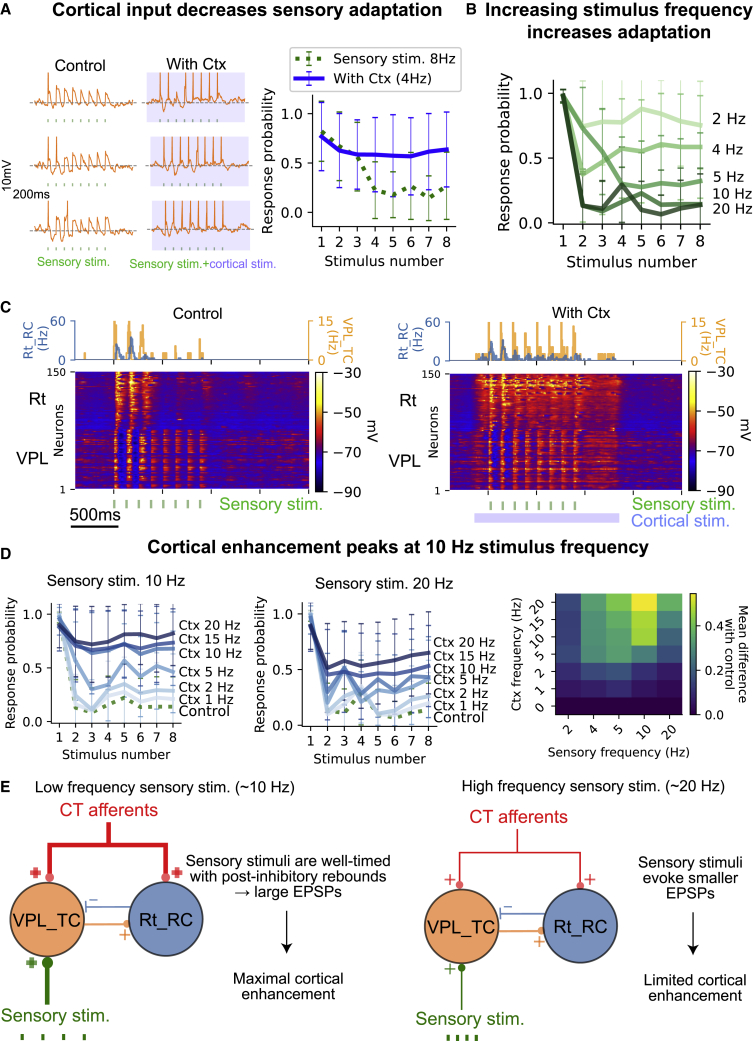
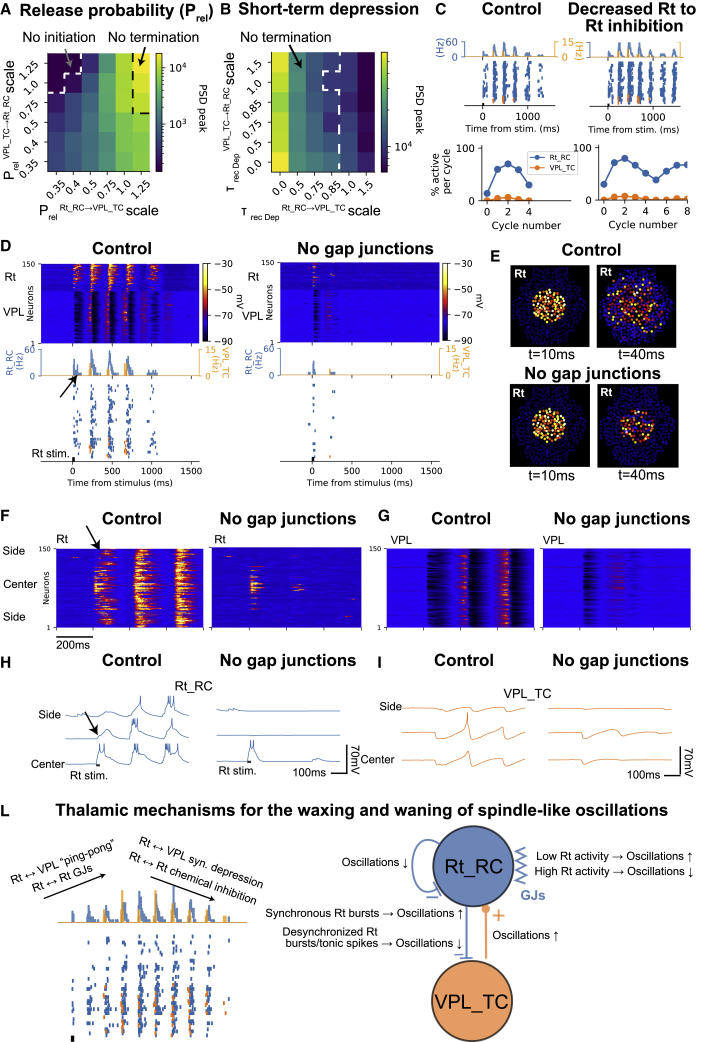
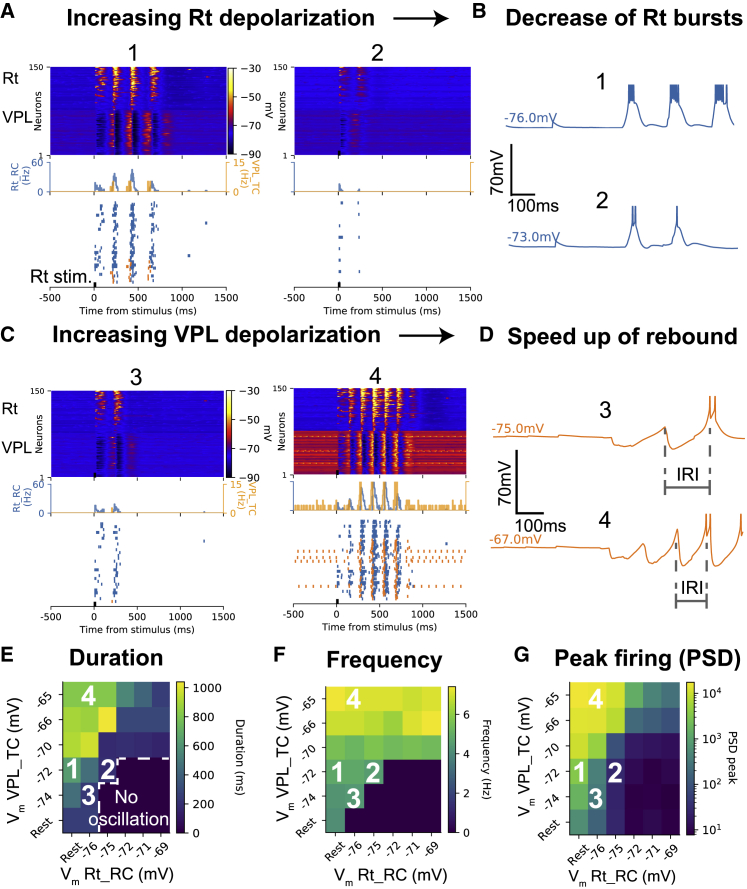
Thalamoreticular circuitry plays a key role in arousal, attention, cognition, and sleep spindles, and is linked to several brain disorders. A detailed computational model of mouse somatosensory thalamus and thalamic reticular nucleus has been developed to capture the properties of over 14,000 neurons connected by 6 million synapses. The model recreates the biological connectivity of these neurons, and simulations of the model reproduce multiple experimental findings in different brain states. The model shows that inhibitory rebound produces frequency-selective enhancement of thalamic responses during wakefulness. We find that thalamic interactions are responsible for the characteristic waxing and waning of spindle oscillations. In addition, we find that changes in thalamic excitability control spindle frequency and their incidence. The model is made openly available to provide a new tool for studying the function and dysfunction of the thalamoreticular circuitry in various brain states.

Keywords: CP: Neuroscience; computer model; sensory processing; sleep; spindles; thalamic reticular nucleus; thalamus; wakefulness.


Conflict of interest statement

Declaration of interests The authors declare no competing interests.

Figures

None
Graphical abstract
Figure 1
Figure 1
Single-cell reconstructions, neuron densities, and microcircuit features (A) 3D reconstructions of three different thalamic and reticular cell types (m-types) from a mouse. Axons are shown in blue, dendrites in red, and the cell bodies in black. (B) Electrical types (e-types) and the models that match them. From left to right: examples of recordings (gray) and models (blue) that correspond to the Rt_RC, VPL_TC, and VPL_IN m-types. The two different firing modes of the cNAD_ltb and cAD_ltb e-types are shown: low-threshold bursting (first row) and tonic firing (second row). (C) Average number of neurons in the Rt and VPL regions of the thalamus. A slice was stained with anti-GABA (red), anti-NeuN (green), and DAPI (blue), and the average number of neurons was calculated. The gray box shows a thalamic microcircuit. (D) Dimensions of the microcircuit (lateral and vertical). The lateral size was determined by the smallest circle that captured the Rt_RC dendritic density in the center of the microcircuit. The vertical size was calculated from the Allen Reference Atlas. The excitatory/inhibitory ratios and m-type compositions are also shown. (E) The fraction of e-types for each m-type found in our single-cell recordings. (F) Predicted number of neurons and their positions in the microcircuit (mean and standard deviation of five microcircuits). (G) The placement of cell morphologies in the microcircuit. Only 10% of the neurons are shown (left) and axons are not shown for clarity. The right image shows one example of an Rt_RC axon (red) innervating the VPL.
Figure 2
Figure 2
Reconstructing and validating intrathalamic and thalamic afferent connectivity, short-term synaptic plasticity, and PSP amplitudes (A and B) Neuron morphologies and bouton densities are used to constrain intrathalamic connectivity. (A) Putative synapses are identified using axodendritic appositions. High bouton densities (number of boutons per axonal length) characterize the resulting connectivity. Exemplar Rt_RC neuron (red, dendrites; blue, axon; black, soma) with putative synapse locations is shown on the left, and bouton density distribution for 1,000 Rt_RC morphologies in the model and experiment (n = 2 Rt_RC morphologies) on the right. (B) Bouton densities from experiments are used to remove a fraction of axodendritic appositions. (C) Resulting mono- and multi-synapse connections between neuron pairs are shown with black dots representing functional synapses. (D) Volumetric bouton densities (boutons/μm3) were used to add synapses from medial lemniscal (ML) and corticothalamic (CT) afferents. (E) Comparison of synapses per connection in the model and from an electron microscopy (EM) reconstruction of one IN in the mouse (Morgan and Lichtman; N = 47 VPL_IN in the model). (F) Validation of synapse convergence onto Rt_RC neurons in the model with EM experiments in the rat (N = 2, Liu and Jones, N = 4,909 Rt_RCs in the model). (G) In vitro paired recordings (eight pulses at 40 Hz followed by recovery stimulus) constrain the parameters of the Tsodyks-Markram model of short-term plasticity. (H) Map of short-term plasticity types in the model (green, in-house experimentally characterized pathways; green checked, literature-derived pathways; orange, uncharacterized pathways). (I) Validation of the coefficient of variation (c.v.) of first PSP amplitudes for five in vitro-characterized pathways (see Table S2). (J) Comparison of PSP amplitudes in the model for seven characterized pathways in house or in the literature (see Table S3).
Figure 3
Figure 3
Dendrodendritic overlap predicts Rt GJ connectivity (A1) Potential connectivity based on dendrodendritic and somatic appositions between Rt_RC dendrites. The left panel shows the microcircuit from the Rt side, including a sample of 500 Rt_RC neurons (gray dots), a target Rt_RC morphology (2D projection, dendrites in red), and the location of Rt_RC neurons connected to the target (blue dots). The middle panel shows neuron divergence (number of postsynaptic neurons) in the model and literature (N = 33 for both experiment and model), with each dot representing one target neuron. The right panel displays the distribution of potential connectivity divergence (number of appositions per neuron, for a sample of 1,000 Rt_RC neurons in the model). (A2) Predicted GJs after removing dendrodendritic appositions to match average GJ divergence. The left panel is similar to A1. The middle panel shows that the neuron divergence in the model matches experimental findings, while the right panel shows that the resulting GJ divergence is reduced by an order of magnitude. Note the different maximal values in A1 and A2. (B) Validation of distance-dependent GJs connectivity. The right panel shows results from in silico dye injections that reproduce dye-coupling experiments (n = 500 neurons in the model, n = 33 in the experiment), including mean and standard deviation. (C) Validation of GJs functional properties. The left panel shows an example of in silico paired recordings, where an Rt_RC is stimulated with a hyperpolarizing current step, and its somatic potential, along with the somatic potential of all coupled neurons, is recorded. The ratio of the voltage response between a coupled neuron and the stimulated neuron is the coupling coefficient (CC). The right panel compares CC values in the model (n = 50 pairs, each one represented by a dot) with paired recordings from the literature, including mean and standard deviation. (D) Resulting GJ connectivity, including an example of clusters of four Rt_RC neurons coupled by GJs and GJ locations. Each neuron morphology is represented by a different color, with axons omitted for clarity. Green dots show the detailed morphological location of GJs received by each of the neurons from the other three and from other Rt_RC neurons not shown.
Figure 4
Figure 4
Wakefulness and sleep-like activity in the simulated thalamoreticular microcircuit (A) Population voltage raster displays the membrane potential of a sample of 50 active neurons per m-type (group of neurons) in response to brief activation of 160 ML fibers. The activity is sorted by microcircuit depth and shows increased responses in both Rt and VPL and visible hyperpolarization in the VPL after the stimulus. (B) Spike rasters and firing rate histograms of uncorrelated spiking activity in all m-types. VPL_IN neurons have higher firing rates. Rt_RCs show increased activity for a longer time after the stimulus compared with VPL neurons. (C) The network is simulated in wakefulness-like conditions for the first 1,000 ms. Then, background activity from CT afferents is removed for 500 ms to approximate a cortical down state, followed by a 500-ms re-activation to simulate an up state. A sample of 25 neurons per each m-type is shown and color coded according to its membrane potential. The down state results in marked hyperpolarization in the Rt while spindle-like oscillations emerge during the up state. (D) Sample of single-cell recordings from the neurons shown in (C). There is a change in firing mode during the NREM-like phase, where Rt_RC and VPL_TC fire mainly low-threshold bursts. Spikes are truncated at −25 mV.
Figure 5
Figure 5
Frequency-dependent sensory adaptation and cortical modulation of sensory responses in wakefulness (A) Left: example of a VPL_TC cell response to a train of eight sensory stimuli delivered at 8 Hz (green). The cell only responded to the first stimulus in the train, demonstrating adaptation. Right: comparison of the firing probability of VPL_TC cells in response to the sensory stimulus alone (red) and with cortical activation (blue). The blue line represents an increase in firing probability with cortical activation. The markers indicate the mean probability in response to each stimulus, with the vertical line showing the standard deviation. (B) The adaptation in the VPL to sensory responses increases with increasing frequency of the sensory stimulus. (C) Comparison of population voltage rasters in the control condition and with cortical activation. The Rt responds to the first two or three stimuli in the train in both conditions, with visible hyperpolarization in the VPL. (D) Left: the effect of different mean firing rates of cortical input on response probabilities for sensory stimuli at 10 and 20 Hz. Right: a map showing the efficacy of cortical input in counterbalancing sensory adaptation for different sensory frequencies and cortical mean firing rates. (E) A schematic explaining why cortical enhancement is greater for sensory stimuli at around 10 Hz compared with higher frequencies (around 20 Hz). Sensory stimuli around 10 Hz are timed with post-inhibitory rebounds and activation of low-threshold calcium and produce larger EPSPs that can reach firing threshold with cortical activation. For higher stimulus frequencies, EPSPs decrease in amplitude due to synaptic depression, and cortical inputs are no longer sufficient to reach the firing threshold and counterbalance the adaptation.
Figure 6
Figure 6
Spindle-like oscillations arise from intrinsic cellular and synaptic dynamics, with GJs enhancing the oscillations by recruiting low-threshold spikes in reticular cells (A and B) In this figure, the circuit is in an in vitro-like environment, leading to hyperpolarized membrane potentials and stronger synaptic interactions. One-thousand Rt_RC cells are stimulated with a 20-ms current pulse. The parameter map in (A) shows the effect of synapse release probability between Rt_RC and VPL_TC cells on oscillation strength. In (B), the map shows the effect of short-term synaptic depression on the evoked oscillations. (C) The inhibitory connections between Rt_RC cells play a role in termination. (D) The spindle-like oscillation in control conditions (left) and with GJs removed (right). (E) The topographical activity maps at 10 and 40 ms after the stimulus. (F) The membrane potential along the lateral extent of the microcircuit. (G) The same for VPL_TC cells. (H) Single-cell recordings of Rt_RC. (I) The same for VPL_TCs. (L) Left: schematic of mechanisms underlying the waxing and waning of spindle-like oscillations. Right: connections can have positive/negative effects on oscillations.
Figure 7
Figure 7
Depolarization levels affect spindle-like oscillation properties (A) Voltage rasters and firing rate histograms of Rt_RCs showing decrease in oscillation duration with increased Rt depolarization. (B) Single Rt_RC showing fewer spikes per burst with increased depolarization. (C) Voltage rasters and firing rate histograms of VPL_TCs showing increase in oscillation duration and frequency with VPL depolarization. (D) Single VPL_TC recording showing increased rebound responses and faster responses with VPL depolarization. (E–G) Parameter maps showing effect of depolarizing VPL and Rt on oscillation (E) duration, (F) frequency, and (G) peak firing rate/power spectral density (PSD), respectively. VPL depolarization increases duration and frequency, while Rt depolarization decreases them.

References

    1. Dai K., Hernando J., Billeh Y.N., Gratiy S.L., Planas J., Davison A.P., Dura-Bernal S., Gleeson P., Devresse A., Dichter B.K., et al. The SONATA data format for efficient description of large-scale network models. PLoS Comput. Biol. 2020;16 doi: 10.1371/journal.pcbi.1007696. - DOI - PMC - PubMed
    1. Jones E.G. Second edition. Cambridge University Press; 2007. The Thalamus. 1939-2011.
    1. Ohara P.T., Lieberman A.R. The thalamic reticular nucleus of the adult rat: experimental anatomical studies. J. Neurocytol. 1985;14:365–411. - PubMed
    1. Pinault D. The thalamic reticular nucleus: structure, function and concept. Brain Res. Brain Res. Rev. 2004;46:1–31. doi: 10.1016/j.brainresrev.2004.04.008. - DOI - PubMed
    1. Scheibel M.E., Scheibel A.B. The organization of the nucleus reticularis thalami: a Golgi study. Brain Res. 1966;1:43–62. doi: 10.1016/0006-8993(66)90104-1. - DOI - PubMed

Publication types

LinkOut - more resources