. 2023 Mar 28;42(3):112198.
doi: 10.1016/j.celrep.2023.112198. Epub 2023 Mar 3.

Tumor suppressor p53 regulates heat shock factor 1 protein degradation in Huntington's disease

Affiliations

Tumor suppressor p53 regulates heat shock factor 1 protein degradation in Huntington's disease

Rachel H Mansky et al. Cell Rep. .

Abstract

p53 and HSF1 are two major transcription factors involved in cell proliferation and apoptosis, whose dysregulation contributes to cancer and neurodegeneration. Contrary to most cancers, p53 is increased in Huntington's disease (HD) and other neurodegenerative diseases, while HSF1 is decreased. p53 and HSF1 reciprocal regulation has been shown in different contexts, but their connection in neurodegeneration remains understudied. Using cellular and animal models of HD, we show that mutant HTT stabilized p53 by abrogating the interaction between p53 and E3 ligase MDM2. Stabilized p53 promotes protein kinase CK2 alpha prime and E3 ligase FBXW7 transcription, both of which are responsible for HSF1 degradation. Consequently, p53 deletion in striatal neurons of zQ175 HD mice restores HSF1 abundance and decrease HTT aggregation and striatal pathology. Our work shows the mechanism connecting p53 stabilization with HSF1 degradation and pathophysiology in HD and sheds light on the broader molecular differences and commonalities between cancer and neurodegeneration.

Keywords: CP: Molecular biology; CP: Neuroscience; HSF1; Huntington’s disease; MDM2; p53; striatal pathology.


Conflict of interest statement

Declaration of interests The authors declare no competing interests.

Figures
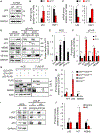
Figure 1.
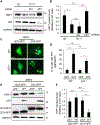
Figure 1.. PolyQ-expanded HTT stabilizes p53 protein levels by interfering with p53-MDM2 interaction
(A and B) p53 and HSF1 protein levels in Q111 cells relative to Q7 (n = 5). (C) p53 and HSF1 mRNA levels in Q111 cells relative to Q7 (n = 3). (D) p53 immunoprecipitation (IP) in Q7 and Q111 cells using IgG as a negative control. GAPDH was used as a loading control of the whole-cell extract (WCE). Arrow points to pulled down αB-crys, unspecific bands in the IgG presented a higher molecular weight and were not considered in the analysis. (E) HTT, MDM2, MDM4, and αB-crys protein levels in the WCE of Q111 relative to Q7 cells (n = 3). (F) p53, HTT, MDM2, MDM4, and αB-crys protein levels pulled down by p53 in Q7 and Q111 cells. Data were normalized to total levels of each protein in the WCE and relativized to Q7 cells (n = 3). (G) FLAG-IP in Q7 cells co-transfected with human HTT exon 1 containing Q23-GFP (non-pathogenic) or Q74-GFP (pathogenic) and human p53-FLAG. (H) p53, HTT, and MDM2 protein levels pulled down by FLAG and relativized to Q23-expressing cells (n = 4). (I) p53-IP in striatum samples from unaffected (control, C) and HD patients. IgG was used as a negative control. (J) HTT, MDM2, and p53 protein levels pulled down by p53 or IgG and relativized to control (n = 3). Error bars represent mean ± SEM. Unpaired t test; *p < 0.05, **p < 0.01, ***p < 0.001; not significant (n.s.). See also Figure S1 for supporting information and Data S1 for uncropped immunoblots.
Figure 2.
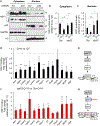
Figure 2.. Stabilization of p53 in HD cell models is necessary for HSF1 pathological degradation
(A and B) HSF1 and p53 protein levels in Q7 and Q111 non-transfected cells (−) and Q111 treated cells with scramble (scr.) or sip53 (n = 3). (C) WT and p53−/− MEFs transfected with human HTT exon 1 Q23-GFP or Q74-GFP. Scale bar, 5 μm. (D) Percent of WT and p53−/− MEFs cells containing GFP-HTT-Q74 aggregates (n = 200 cells, n = 3 experiments). (E) Immunoblotting in WT and p53−/− MEFs transfected with human HTT exon 1 Q23-GFP or Q74-GFP. (F) HSF1 protein levels from images in (E). Data were relativized to WT-Q23-expressing cells (n = 3). Error bars represent mean ± SEM. One-way ANOVA with Tukey’s post hoc test. *p < 0.05, **p < 0.01, ***p < 0.001; not significant (n.s.). See Data S1 for uncropped immunoblots.
Figure 3.
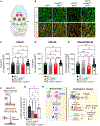
Figure 3.. p53 depletion restores HSF1 nuclear accumulation and HSF1 DNA binding to target genes dysregulated in HD cells
(A) Immunoblotting in cytoplasm and nuclear fractions of Q7 and Q111 cells treated cells with scr. or sip53. HSF1 is shown at two different exposures (long and short). (B and C) HSF1 protein levels in the cytoplasmic (B) and nuclear (C) fractions of Q111 relative to Q7 cells (n = 3). (D) HSF1 ChIP in Q7 and Q111 cells on HSF1 gene targets shown by Riva et al. (n = 3). (E) Diagram showing the silencing effect of p53 on HSF1 DNA binding. (F) HSF1 ChIP in Q111 cells treated with scr. or sip53 (n = 3). (G) Diagram showing the enhancing effect of silencing p53 on HSF1 DNA binding. Error bars represent mean ± SEM. One-way ANOVA with Tukey’s post hoc test (B and C), unpaired t test (D and F). *p < 0.05, **p < 0.01, ***p < 0.001; not significant (n.s.). See also Figure S2 for supporting information and Data S1 for uncropped immunoblots.
Figure 4.
Figure 4.. p53 regulates the transcriptional activation of components of the HSF1 degradation pathway
(A) Consensus p53 DNA-binding motif represented by Motif Express. (B) Genomic mapping of p53 DNA-binding motifs in Bax, Fbxw7, and Csnk2a2 (CK2α′). Bolded base pairs are present in the consensus p53 DNA-binding motif. (C) p53 ChIP in Q111 cells treated with scr. or sip53 (n = 6). (D) p53, FBXW7α, and CK2α′ mRNA levels analyzed by qRT-PCR (n = 3). (E) Immunoblotting in Q7 and Q111 cells treated cells with scr. or sip53. HSF1 is shown at a long and short exposure. (F and G) (F) HSF1 and (G) p53, FBXW7α, and CK2α′ protein levels were quantified from images in (E) (n = 3). Error bars represent mean ± SEM. One-way ANOVA with Tukey’s post hoc test (D–G), unpaired t test (C). *p < 0.05, **p < 0.01, ***p < 0.001; not significant (n.s.). See also Figures S3 and S4 for supplemental information and Data S1 for uncropped immunoblots.
Figure 5.
Figure 5.. Conditional deletion of p53 in MSNs of the zQ175 prevented HSF1 protein degradation in MSNs
(A and B) p53, HSF1, and DARPP-32 protein levels in striatum samples from 12-month-old WT and zQ175 mice (n = 3). (C) GFP and Ctip2 in the dorsal striatum (Str.), corpus callosum (C.c.), and cortex (Ctx) of 6 month-old p53fl/fl and p53fl/fl:Gpr88Cre/+ (n = 3). (D) p53 immunostaining in striatum samples from 6-month-old WT (p53+/+), p53fl/fl, and p53fl/fl:Gpr88Cre/+ (n = 3 mice/genotype). (E) p53 in the dorsal striatum of p53fl/fl and p53fl/fl:Gpr88Cre/+ (n = 3 mice/genotype). (F) HSF1 and FOXP1 immunofluorescence in the dorsal striatum of p53fl/fl, zQ175:p53fl/fl, and zQ175:p53fl/fl:Gpr88Cre/+. (G and H) Number of HSF1+ (G) and FoxP1+ cells (H) in the dorsal striatum of p53fl/fl, zQ175:p53fl/fl, and zQ175:p53fl/fl:Gpr88Cre/+ from representative images in (F) (n = 27 images from 3 different ROIs and 3 coronal brain slices spanning the striatum region and 3 mice/genotype). Scale bars, 100 μm (C), 50 μm (E and F). Error bars represent SEM. One-way ANOVA with Tukey’s post hoc test. *p < 0.05, **p < 0.01; not significant (n.s.). See also Figures S5 and S6 for supplemental information and Data S1 for uncropped immunoblots.
Figure 6.
Figure 6.. Conditional deletion of p53 in MSNs of the zQ175-ameliorated HTT aggregation in the striatum
(A) Representative images of HTT puncta (ab109115) in the dorsal striatum of zQ175:p53fl/fl and zQ175:p53fl/fl:Gpr88Cre/+ (n = 3 mice/genotype). Scale bar, 10 μm. The right panels represent an inlet of the left panels with nuclei surrounded by a circle. All mice were analyzed at age 6 months. Arrows indicate representative cytoplasmic puncta. DAPI stains nuclei (B) HTT dot blot analysis in striatum pellet fractions solubilized with Urea 8M at different protein concentrations (5, 10, 20 μg). (C) Total HTT puncta in 11.23 mm2 area in the dorsal striatum of zQ175:p53fl/fl and zQ175:p53fl/fl: Gpr88Cre/+. (D and E) Cytoplasmic (D) and nuclear (E) HTT puncta number per 11.23 mm2 area in the dorsal striatum of zQ175:p53fl/fl and zQ175:p53fl/fl: Gpr88Cre/+. (F) Total HTT puncta number in the cortex of zQ175:p53fl/fl and zQ175:p53fl/fl:Gpr88Cre/+. HTT puncta number was calculated using the Puncta Analyzer plugin from ImageJ (n = 27 images from 3 different ROIs and 3 coronal brain slices spanning the striatum region and 3 mice/genotype). Error bars represent SEM. One-way ANOVA with Tukey’s post hoc test. *p < 0.05, **p < 0.01; not significant (n.s.).
Figure 7.
Figure 7.. Synapse density loss in the dorsal striatum and motor deficits are ameliorated in zQ175 lacking p53 in MSNs
(A) Diagram of a T-S synapse showing PSD-95 (postsynaptic marker) and VGlut2 (presynaptic marker). Graphic was created with Biorender.com. (B) VGlut2 and PSD-95 immunofluorescence in p53fl/fl, p53fl/fl:Gpr88Cre/+, zQ175:p53fl/fl, and zQ175:p53fl/fl:Gpr88Cre/+ mice. Images were edited and oversaturated to better illustrate the colocalization between VGlut2 and PSD-95 (see Figures S7A and S7B for representative unedited images). Scale bar, 5 μm. Closed arrows indicate VGlut2/PSD-95 colocalization, open arrows indicate non-colocalizing puncta. (C–E) Puncta number for VGlut2 (C), PSD-95 (D), and colocalization VGlut2/PSD-95 (E) was calculated from unedited immunofluorescence images (n = 27 slices from 3 coronal brain slices spanning the striatum region, each slice containing a z stack of 15 images, 3 mice/genotype). (F) Latency to descend pole in 6-month-old p53fl/+, p53fl/+:Gpr88Cre/+, zQ175:p53fl/+, and zQ175: p53fl/+:Gpr88Cre/+ mice (n = 3–5 mice/group). The right panel represents expected outcomes for “healthy” and “abnormal” motor behavior. (G) Summary schematic for the mechanistic connection between mtHTT, p53, and HSF1 in HD. Error bars represent mean ± SEM. One-way ANOVA with Tukey’s post hoc test. *p < 0.05, **p < 0.01, ***p < 0.001, ****p < 0.0001; not significant (n.s.). See also Figurse S7C and S7D for supporting information.

References

    1. Macdonald M, Ambrose CM, Duyao MP, Myers RH, Lin C, Srinidhi L, Barnes G, Taylor SA, James M, Groot N, et al. (1993). A novel gene containing a trinucleotide repeat that is expanded and unstable on Huntington’s disease chromosomes. Cell 72, 971–983. 10.1016/0092-8674(93)90585-e. - DOI - PubMed
    1. DiFiglia M, Sapp E, Chase KO, Davies SW, Bates GP, Vonsattel JP, and Aronin N (1997). Aggregation of huntingtin in neuronal intranuclear inclusions and dystrophic neurites in brain. Science 277, 1990–1993. 10.1126/science.277.5334.1990. - DOI - PubMed
    1. Rosas HD, Lee SY, Bender AC, Zaleta AK, Vangel M, Yu P, Fischl B, Pappu V, Onorato C, Cha JH, et al. (2010). Altered white matter microstructure in the corpus callosum in Huntington’s disease: implications for cortical "disconnection. Neuroimage 49, 2995–3004. 10.1016/j.neuroimage.2009.10.015. - DOI - PMC - PubMed
    1. Tabrizi SJ, Scahill RI, Durr A, Roos RA, Leavitt BR, Jones R, Landwehrmeyer GB, Fox NC, Johnson H, Hicks SL, et al. (2011). Biological and clinical changes in premanifest and early stage Huntington’s disease in the TRACK-HD study: the 12-month longitudinal analysis. Lancet Neurol. 10, 31–42. 10.1016/S1474-4422(10)70276-3. - DOI - PubMed
    1. Shirasaki DI, Greiner ER, Al-Ramahi I, Gray M, Boontheung P, Geschwind DH, Botas J, Coppola G, Horvath S, Loo JA, and Yang XW (2012). Network organization of the huntingtin proteomic interactome in mammalian brain. Neuron 75, 41–57. 10.1016/j.neuron.2012.05.024. - DOI - PMC - PubMed

Publication types

MeSH terms

Substances