

Applied machine learning to identify differential risk groups underlying externalizing and internalizing problem behaviors trajectories: A case study using a cohort of Asian American children
- PMID: 36867610
- PMCID: PMC9983857
- DOI: 10.1371/journal.pone.0282235
Applied machine learning to identify differential risk groups underlying externalizing and internalizing problem behaviors trajectories: A case study using a cohort of Asian American children
Abstract
Background: Internalizing and externalizing problems account for over 75% of the mental health burden in children and adolescents in the US, with higher burden among minority children. While complex interactions of multilevel factors are associated with these outcomes and may enable early identification of children in higher risk, prior research has been limited by data and application of traditional analysis methods. In this case example focused on Asian American children, we address the gap by applying data-driven statistical and machine learning methods to study clusters of mental health trajectories among children, investigate optimal predictions of children at high-risk cluster, and identify key early predictors.
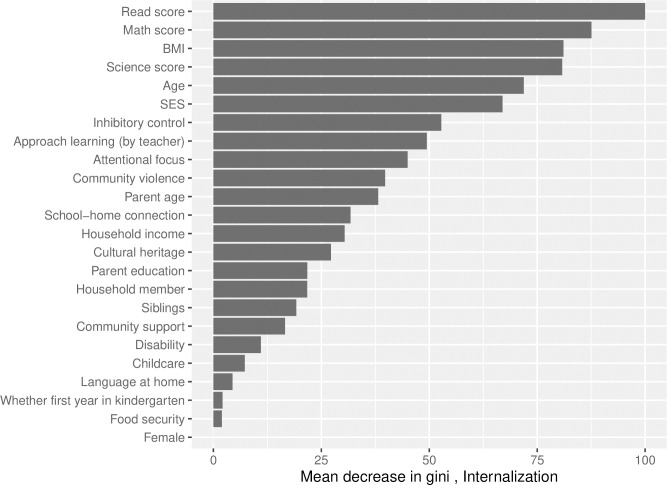
Methods: Data from the US Early Childhood Longitudinal Study 2010-2011 were used. Multilevel information provided by children, families, teachers, schools, and care-providers were considered as predictors. Unsupervised machine learning algorithm was applied to identify groups of internalizing and externalizing problems trajectories. For prediction of high-risk group, ensemble algorithm, Superlearner, was implemented by combining several supervised machine learning algorithms. Performance of Superlearner and candidate algorithms, including logistic regression, was assessed using discrimination and calibration metrics via crossvalidation. Variable importance measures along with partial dependence plots were utilized to rank and visualize key predictors.
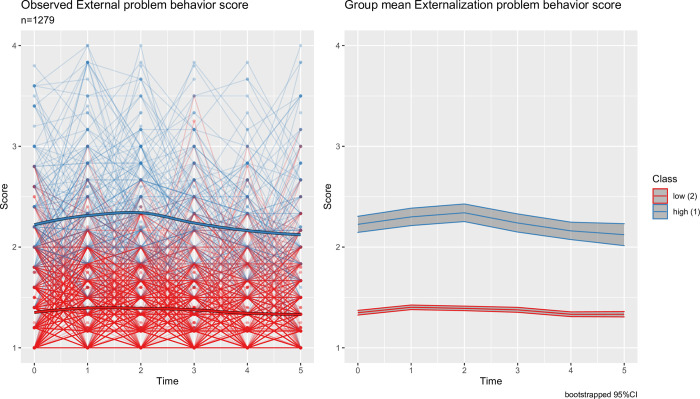
Findings: We found two clusters suggesting high- and low-risk groups for both externalizing and internalizing problems trajectories. While Superlearner had overall best discrimination performance, logistic regression had comparable performance for externalizing problems but worse for internalizing problems. Predictions from logistic regression were not well calibrated compared to those from Superlearner, however they were still better than few candidate algorithms. Important predictors identified were combination of test scores, child factors, teacher rated scores, and contextual factors, which showed non-linear associations with predicted probabilities.
Conclusions: We demonstrated the application of data-driven analytical approach to predict mental health outcomes among Asian American children. Findings from the cluster analysis can inform critical age for early intervention, while prediction analysis has potential to inform intervention programing prioritization decisions. However, to better understand external validity, replicability, and value of machine learning in broader mental health research, more studies applying similar analytical approach is needed.
Copyright: © 2023 Adhikari et al. This is an open access article distributed under the terms of the Creative Commons Attribution License, which permits unrestricted use, distribution, and reproduction in any medium, provided the original author and source are credited.
Conflict of interest statement
The authors have declared that no competing interests exist.
Figures


Similar articles
-
Joint developmental trajectories of internalizing and externalizing problems from mid-childhood to late adolescence and childhood risk factors: Findings from a prospective pre-birth cohort.Dev Psychopathol. 2025 Feb;37(1):176-191. doi: 10.1017/S0954579423001505. Epub 2024 Jan 4. Dev Psychopathol. 2025. PMID: 38174409
-
Polygenic risks for joint developmental trajectories of internalizing and externalizing problems: findings from the ALSPAC cohort.J Child Psychol Psychiatry. 2022 Aug;63(8):948-956. doi: 10.1111/jcpp.13549. Epub 2021 Dec 2. J Child Psychol Psychiatry. 2022. PMID: 34856637
-
Predicting Adolescent Mental Health Outcomes Across Cultures: A Machine Learning Approach.J Youth Adolesc. 2023 Aug;52(8):1595-1619. doi: 10.1007/s10964-023-01767-w. Epub 2023 Apr 19. J Youth Adolesc. 2023. PMID: 37074622 Free PMC article.
-
The Association between Coparenting Behavior and Internalizing/Externalizing Problems of Children and Adolescents: A Meta-Analysis.Int J Environ Res Public Health. 2022 Aug 19;19(16):10346. doi: 10.3390/ijerph191610346. Int J Environ Res Public Health. 2022. PMID: 36011980 Free PMC article. Review.
-
Bullying Victimization and Developmental Trajectories of Internalizing and Externalizing Problems: The Moderating Role of Locus of Control Among Children.Res Child Adolesc Psychopathol. 2021 Mar;49(3):351-366. doi: 10.1007/s10802-020-00752-2. Epub 2021 Jan 6. Res Child Adolesc Psychopathol. 2021. PMID: 33404945 Review.
References
-
- Murray C.J., et al.., Disability-adjusted life years (DALYs) for 291 diseases and injuries in 21 regions, 1990–2010: a systematic analysis for the Global Burden of Disease Study 2010. Lancet, 2013. 380: p. 2197–223. - PubMed
-
- WHO. Health for the world’s adolescents: A second chance in the second decade. 2014. [cited 2019 Oct]; Available from: https://www.who.int/maternal_child_adolescent/documents/second-decade/en/.
-
- WHO Adolescent mental health: mapppying actions of nongovernmental organizations and other international development organizations. 2012.
Publication types
MeSH terms
Grants and funding
LinkOut - more resources
Full Text Sources
Miscellaneous
