. 2023 Mar 3;9(9):eadd2146.
doi: 10.1126/sciadv.add2146. Epub 2023 Mar 3.

Philopatry yields higher fitness than dispersal in a cooperative breeder with sex-specific life history trajectories

Affiliations

Philopatry yields higher fitness than dispersal in a cooperative breeder with sex-specific life history trajectories

Arne Jungwirth et al. Sci Adv. .

Abstract

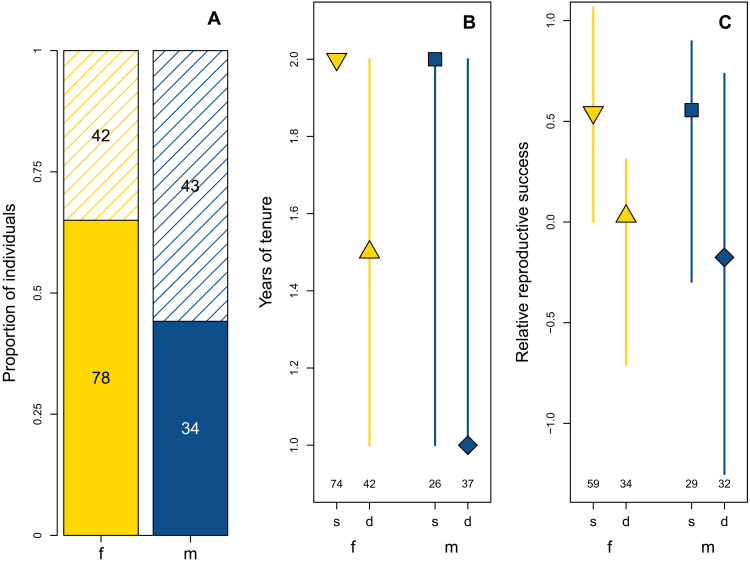
Social evolution is tightly linked to dispersal decisions, but the ecological and social factors selecting for philopatry or dispersal often remain obscure. Elucidating selection mechanisms underlying alternative life histories requires measurement of fitness effects in the wild. We report on a long-term field study of 496 individually marked cooperatively breeding fish, showing that philopatry is beneficial as it increases breeding tenure and lifetime reproductive success in both sexes. Dispersers predominantly join established groups and end up in smaller groups when they ascend to dominance. Life history trajectories are sex specific, with males growing faster, dying earlier, and dispersing more, whereas females more likely inherit a breeding position. Increased male dispersal does not seem to reflect an adaptive preference but rather sex-specific differences in intrasexual competition. Cooperative groups may thus be maintained because of inherent benefits of philopatry, of which females seem to get the greater share in social cichlids.


Figures

Fig. 1.
Fig. 1.. Annual growth of 195 individually marked N. pulcher caught in the wild.
Increases in standard length [SL (in centimeters)] between two consecutive years (y axis) plotted as a function of SL in the first of these 2 years (x axis). Annual growth declined with increasing size at a similar rate in both sexes. Males (blue) had a higher size-specific growth rate and grew to a larger size than females (yellow). In both sexes, dispersing individuals (dashed lines; females, upward-pointing triangles; males, diamonds) grew at a faster size-specific rate than individuals that stayed in their territory throughout the observation period (solid lines; females, downward-pointing triangles; males, squares). Points give individual measurements and are slightly offset if overlapping to improve visibility. Statistical details are given in the main text and in sections S1 and S2.
Fig. 2.
Fig. 2.. The estimated age at death in full years of all 496 individual N. pulcher considered in this study.
Columns give the absolute counts (left y axis), while density curves show the respective proportions of all fish in the current study [e.g., 60 males estimated to have died at age 1 (blue bar; left y axis) from a total of 232 males, i.e., ~26% (blue line; right y axis)]. Females (yellow) had on average longer lives than males (blue). Statistical details are given in the main text and in sections S3 and S4.
Fig. 3.
Fig. 3.. A fish’s probability of being the dominant breeder in its group.
Dominance status (y axis; 0, subordinate; 1, dominant) is plotted as a function of body size [lower x axis; SL (in centimeters)] for 761 measurements of size and social status of females (yellow) and males (blue). Solid lines represent values predicted by the respective generalized bGLMM. The upper x axis indicates the corresponding estimated ages for both sexes. The horizontal gray line identifies the 0.5 probability of being dominant and the dashed lines denote the respective intersection with the predicted curves. In both sexes, the probability of being dominant increased with increasing size, but males ascended to dominance at a larger size than females, whereas the corresponding age estimates were similar between the sexes. Points give individual measurements and are slightly offset to improve visibility. Statistical details are given in the main text and in section S5.
Fig. 4.
Fig. 4.. The propensity for dispersal and its fitness-related consequences for female and male N. pulcher.
In all three plots, females (f) are represented in yellow and males (m) in blue. Nondispersing individuals (s) are represented by solid-fill areas of bars in (A), and by downward-pointing triangles (females) and squares (males) in (B) and (C). Dispersing individuals (d) are represented by dashed areas of bars in (A), and by upward-pointing triangles (females) and diamonds (males) in (B) and (C). Numbers in all plots show the sample sizes representing individual fish. Males had a higher propensity for dispersal than females, as shown in (A) for the 197 recaptured individuals, but both sexes suffered similar costs of dispersal as shown in (B) and (C). (B) shows the recorded tenure times of 179 individuals that were observed as dominant and recaptured at least once. Dispersers had shorter dominance tenure than nondispersers. (C) denotes the relative reproductive success, i.e., sex- and status-specific Z scores of estimated reproductive success, for 154 individuals of which their dispersal decisions and at least one estimate of their relative reproductive success were known. Dispersers had significantly lower relative reproductive success than nondispersers. Statistical details are given in the main text and in sections S6, S12, and S14.
Fig. 5.
Fig. 5.. The change in group size experienced by dispersing fish.
Plotted is group size after dispersal minus group size prior to dispersal (y axis). Positive values thus indicate that fish dispersed into groups that were larger than their group of origin, while negative values indicate a reduction in group size due to dispersal. Females are represented in yellow (f; triangles) and males in blue (m; diamonds). Data were sorted according to the three observed types of dispersal (SS, subordinate to subordinate; SD, subordinate to dominant; DD, dominant to dominant). The type of dispersal affected the ensuing changes in group size, with fish ascending to dominance from subordinate status via dispersal (SD) experiencing a significant reduction in group size. Symbols indicate median values and vertical lines show interquartile ranges. Numbers below symbols give the respective sample sizes (numbers of individual fish). Statistical details are given in the main text and in section S13.

References

    1. M. E. Hochberg, D. J. Rankin, M. Taborsky, The coevolution of cooperation and dispersal in social groups and its implications for the emergence of multicellularity. BMC Evol. Biol. 8, 238 (2008). - PMC - PubMed
    1. S. A. West, R. M. Fisher, A. Gardner, E. T. Kiers, Major evolutionary transitions in individuality. Proc. Natl. Acad. Sci. U.S.A. 112, 10112–10119 (2015). - PMC - PubMed
    1. W. D. Koenig, F. A. Pitelka, W. J. Carmen, R. L. Mumme, M. T. Stanback, The evolution of delayed dispersal in cooperative breeders. Q. Rev. Biol. 67, 111–150 (1992). - PubMed
    1. M. Griesser, S. M. Drobniak, S. Nakagawa, C. A. Botero, Family living sets the stage for cooperative breeding and ecological resilience in birds. PLOS Biol. 15, e20000483 (2017). - PMC - PubMed
    1. C. Mullon, L. Keller, L. Lehmann, Social polymorphism is favoured by the co-evolution of dispersal with social behaviour. Nat. Ecol. Evol. 2, 132–140 (2018). - PubMed