. 2023 Mar:173:107743.
doi: 10.1016/j.envint.2023.107743. Epub 2023 Jan 7.

Wastewater-based prediction of COVID-19 cases using a highly sensitive SARS-CoV-2 RNA detection method combined with mathematical modeling

Affiliations

Wastewater-based prediction of COVID-19 cases using a highly sensitive SARS-CoV-2 RNA detection method combined with mathematical modeling

Hiroki Ando et al. Environ Int. 2023 Mar.

Abstract

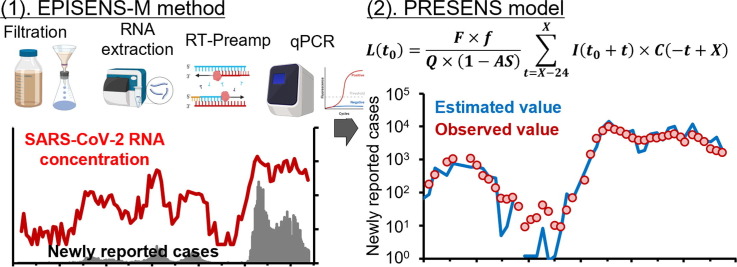
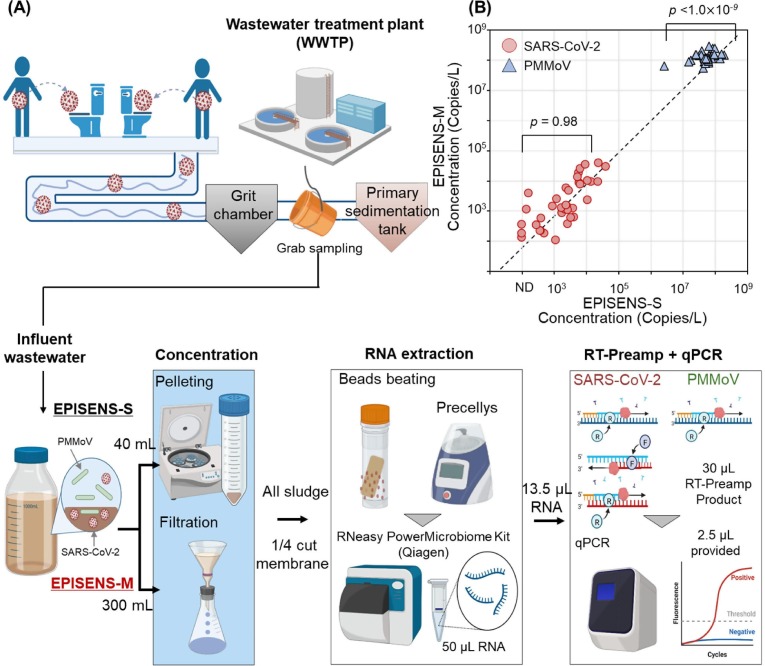
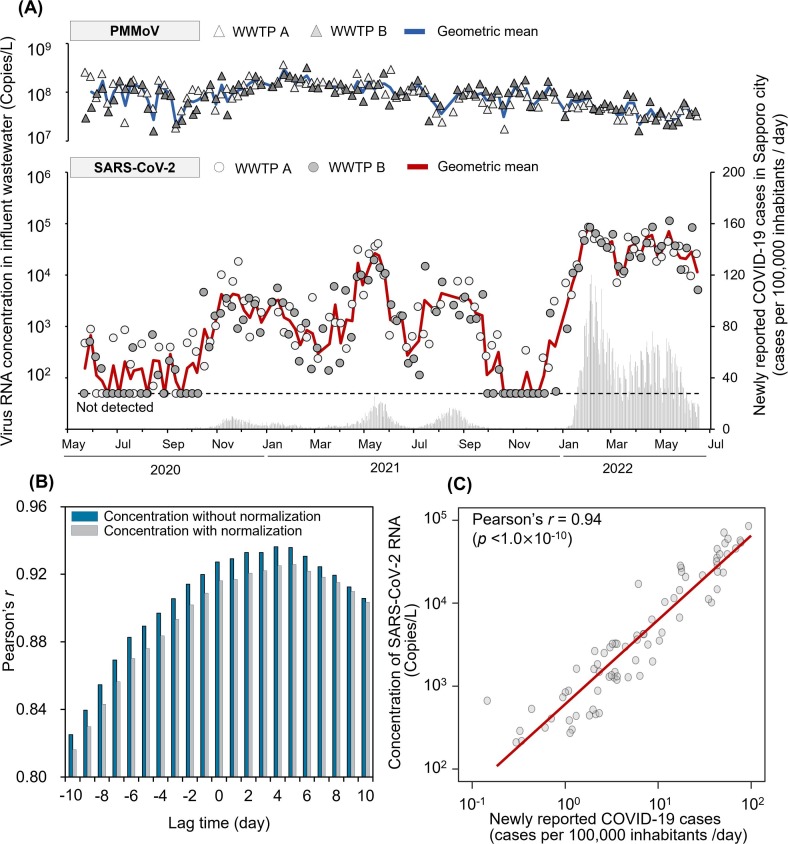
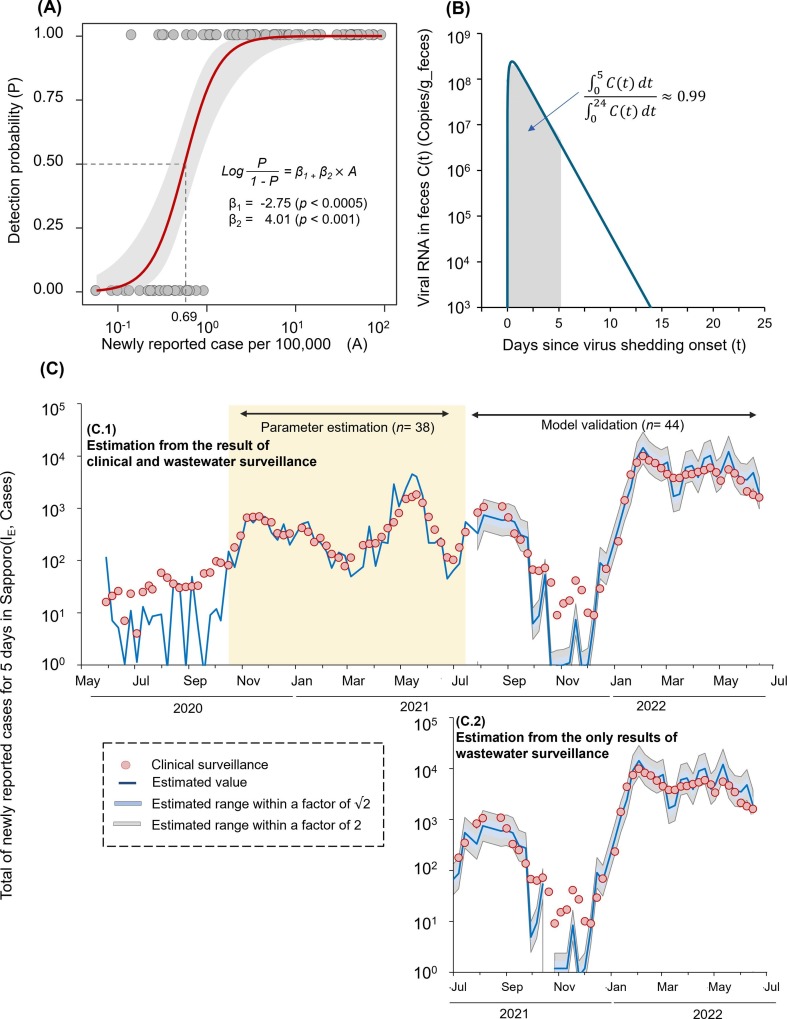
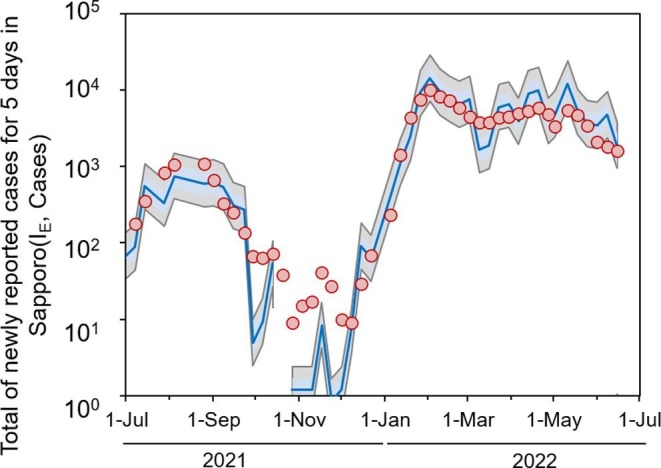
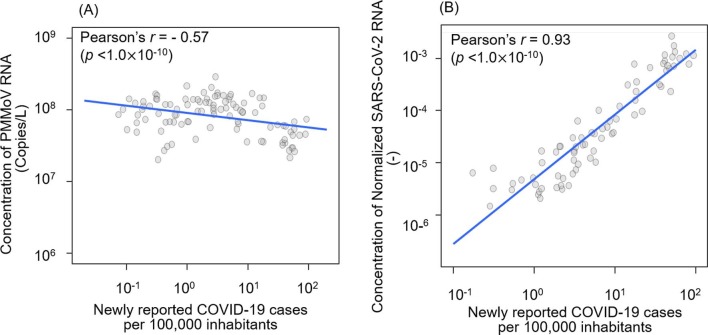
Wastewater-based epidemiology (WBE) has the potential to predict COVID-19 cases; however, reliable methods for tracking SARS-CoV-2 RNA concentrations (CRNA) in wastewater are lacking. In the present study, we developed a highly sensitive method (EPISENS-M) employing adsorption-extraction, followed by one-step RT-Preamp and qPCR. The EPISENS-M allowed SARS-CoV-2 RNA detection from wastewater at 50 % detection rate when newly reported COVID-19 cases exceed 0.69/100,000 inhabitants in a sewer catchment. Using the EPISENS-M, a longitudinal WBE study was conducted between 28 May 2020 and 16 June 2022 in Sapporo City, Japan, revealing a strong correlation (Pearson's r = 0.94) between CRNA and the newly COVID-19 cases reported by intensive clinical surveillance. Based on this dataset, a mathematical model was developed based on viral shedding dynamics to estimate the newly reported cases using CRNA data and recent clinical data prior to sampling day. This developed model succeeded in predicting the cumulative number of newly reported cases after 5 days of sampling day within a factor of √2 and 2 with a precision of 36 % (16/44) and 64 % (28/44), respectively. By applying this model framework, another estimation mode was developed without the recent clinical data, which successfully predicted the number of COVID-19 cases for the succeeding 5 days within a factor of √2 and 2 with a precision of 39 % (17/44) and 66 % (29/44), respectively. These results demonstrated that the EPISENS-M method combined with the mathematical model can be a powerful tool for predicting COVID-19 cases, especially in the absence of intensive clinical surveillance.

Keywords: COVID-19; EPISENS-M; Mathematical model; Quantification method; SARS-CoV-2; Wastewater-based epidemiology.


Conflict of interest statement

Declaration of Competing Interest The authors declare that they have no known competing financial interests or personal relationships that could have appeared to influence the work reported in this paper.

Figures

None
Graphical abstract
Fig. 1
Fig. 1
(A) Detection flow of the EPISENS-M method and the EPISENS-S method. (B) Comparison of the EPISENS-M and EPISENS-S methods. Red circles and blue triangles denote observed SARS-CoV-2 RNA and PMMoV RNA concentrations in influent wastewater, respectively (n = 37). The EPISENS-M method exhibits higher recovery of PMMoV RNA (p < 1.0 × 10⁻⁹, Cohen’s d = 1.56, paired t-test; n = 37), but comparable recovery of SARS-CoV-2 RNA (p = 0.98, Cohen’s d = 0.004, paired t-test; n = 34, quantified samples used) as compared to the EPISENS-S method. (For interpretation of the references to colour in this figure legend, the reader is referred to the web version of this article.)
Fig. 2
Fig. 2
(A) The dynamics of viral RNA concentrations in influent wastewater and newly reported COVID-19 cases/100,000 inhabitants in Sapporo between May 28, 2020 and June 16, 2022. The circle plots denote SARS-CoV-2 RNA concentrations in wastewater (CRNA) and the triangle plots denote PMMoV RNA concentrations in wastewater collected at two WWTPs. The red and blue lines denote geometric means of CRNA and PMMoV RNA concentrations, respectively. In Sapporo, less stringent countermeasures, such as declaration of a state of emergency and pre-emergency measures, were practiced three times during the study period (i.e., April 14 to May 31, 2020; May 9 to June 11, 2021; August 2 to September 30, 2021) (B) Comparison of Pearson’s r values with and without normalization by PMMoV. The blue vertical bars denote the correlation coefficients between the 7-day moving average of newly reported cases and CRNA without normalization, while the gray vertical bars represent the concentration with normalization by PMMoV. Time lag refers to the difference between the sampling day and the day set as the center date of the 7-day moving average. PMMoV normalization did not improve the value of Pearson’s r. The CRNA without normalization showed the highest value of Pearson’s r with the 7-day moving average centered four days after the sampling day. (C) Correlation of the CRNA and newly reported COVID-19 cases/ 100,000 inhabitants in Sapporo. SARS-CoV-2 RNA concentration in the Y-axis refers to the geometric CRNA at two WWTPs in the same week. Newly reported COVID-19 cases on the X-axis are made up of the 7-day moving average centered on the 4-day after sampling day (Pearson’s r = 0.94, p < 1.0 × 10⁻¹⁰, quantified sample used n = 76). (For interpretation of the references to colour in this figure legend, the reader is referred to the web version of this article.)
Fig. 3
Fig. 3
(A) Estimation of the detection probability of the EPISENS-M method with the logistic regression model. The circle plots denote the empirical data. The blue line denotes the logistic regression model with a 95 % confidential interval (gray shadow). From the result of Fig. 2B, a 7-day moving average centered four days after sampling day was used for the analysis. The EPISENS-M method exhibited a detection probability of > 50 % when the number of newly reported cases/ 100,000 inhabitants in Sapporo exceeded 0.69 (95 % CI: 0.39 to 0.81). (B) The fecal shedding dynamics of COVID-19 patients estimated using wastewater-based data and clinical surveillance data. The SARS-CoV-2 RNA concentrations in feces are abundant in the early stage of infection, peaking of 2.44 × 10⁸ copies/g-feces on 0.46 days post-symptom onset. (C) The estimation of newly reported cases for 5 days (1–5 days after sampling day) with the use of two mathematical models and measured SARS-CoV-2 RNA concentration in wastewater (CRNA). The red circle plots denote the newly confirmed cases reported by clinical surveillance. The blue line denotes the estimation values based on the developed models and the geometric CRNA at two WWTPs in the same week. When SARS-CoV-2 RNA was not detected (from September 30, 2021 to December 9, 2021), the CRNA was assumed to be 7.03 copies/L, which corresponds to the square root of the LOD of the EPISENS-M method. The blue and gray shadows denote ranges within a factor of 2 and 2 estimated, respectively. (C.1) The yellow shadow represents the data area used for parameter estimation. The test result of estimation from the developed model and the data on CRNA and recent results of clinical surveillance showed that 39 % (17/44) and 68 % (30/44) of tested samples between 23 July 2021, and 16 June 2022 (n = 44) were within the blue area and the gray area, respectively. (C.2) The test result of estimation from the developed model and CRNA data showed that 41 % (18/44) and 75 % (33/44) of the tested samples between 23 July 2021 and 16 June 2022 (n = 44) were within the blue area and the gray area, respectively. SARS-CoV-2 RNA was not detected from September 19 to December 9, 2021, which could have led to the underestimation of predicted cases. (For interpretation of the references to colour in this figure legend, the reader is referred to the web version of this article.)
Supplementary figure 1
Supplementary figure 2
Supplementary figure 3
Supplementary figure 4

Similar articles

Cited by

References

    1. Ahmed W., et al. Comparison of virus concentration methods for the RT-qPCR-based recovery of murine hepatitis virus, a surrogate for SARS-CoV-2 from untreated wastewater. Sci. Total Environ. 2020;739 - PMC - PubMed
    1. Ahmed W., et al. First confirmed detection of SARS-CoV-2 in untreated wastewater in Australia: A proof of concept for the wastewater surveillance of COVID-19 in the community. Sci. Total Environ. 2020;728 - PMC - PubMed
    1. Ahmed W., et al. Evaluation of process limit of detection and quantification variation of SARS-CoV-2 RT-qPCR and RT-dPCR assays for wastewater surveillance. Water Res. 2022;213 - PMC - PubMed
    1. Ahmed, W. et al. Minimizing errors in RT-PCR detection and quantification of SARS-CoV-2 RNA for wastewater surveillance. Science of the Total Environment vol. 805 Preprint at https://doi.org/10.1016/j.scitotenv.2021.149877 (2022). - PMC - PubMed
    1. Ai Y., et al. Wastewater SARS-CoV-2 monitoring as a community-level COVID-19 trend tracker and variants in Ohio, United States. Sci. Total Environ. 2021;801 - PMC - PubMed

Further reading

    1. Bi Q., et al. Epidemiology and transmission of COVID-19 in 391 cases and 1286 of their close contacts in Shenzhen, China: a retrospective cohort study. Lancet Infect. Dis. 2020;20:911–919. - PMC - PubMed
    1. Sah, P. et al. Asymptomatic SARS-CoV-2 infection: A systematic review and meta-analysis. doi:10.1073/pnas.2109229118/-/DCSupplemental. - PMC - PubMed

Publication types