. 2023 Mar 2;186(5):923-939.e14.
doi: 10.1016/j.cell.2023.01.042.

Whole-genome sequencing reveals a complex African population demographic history and signatures of local adaptation

Affiliations

Whole-genome sequencing reveals a complex African population demographic history and signatures of local adaptation

Shaohua Fan et al. Cell. .

Abstract

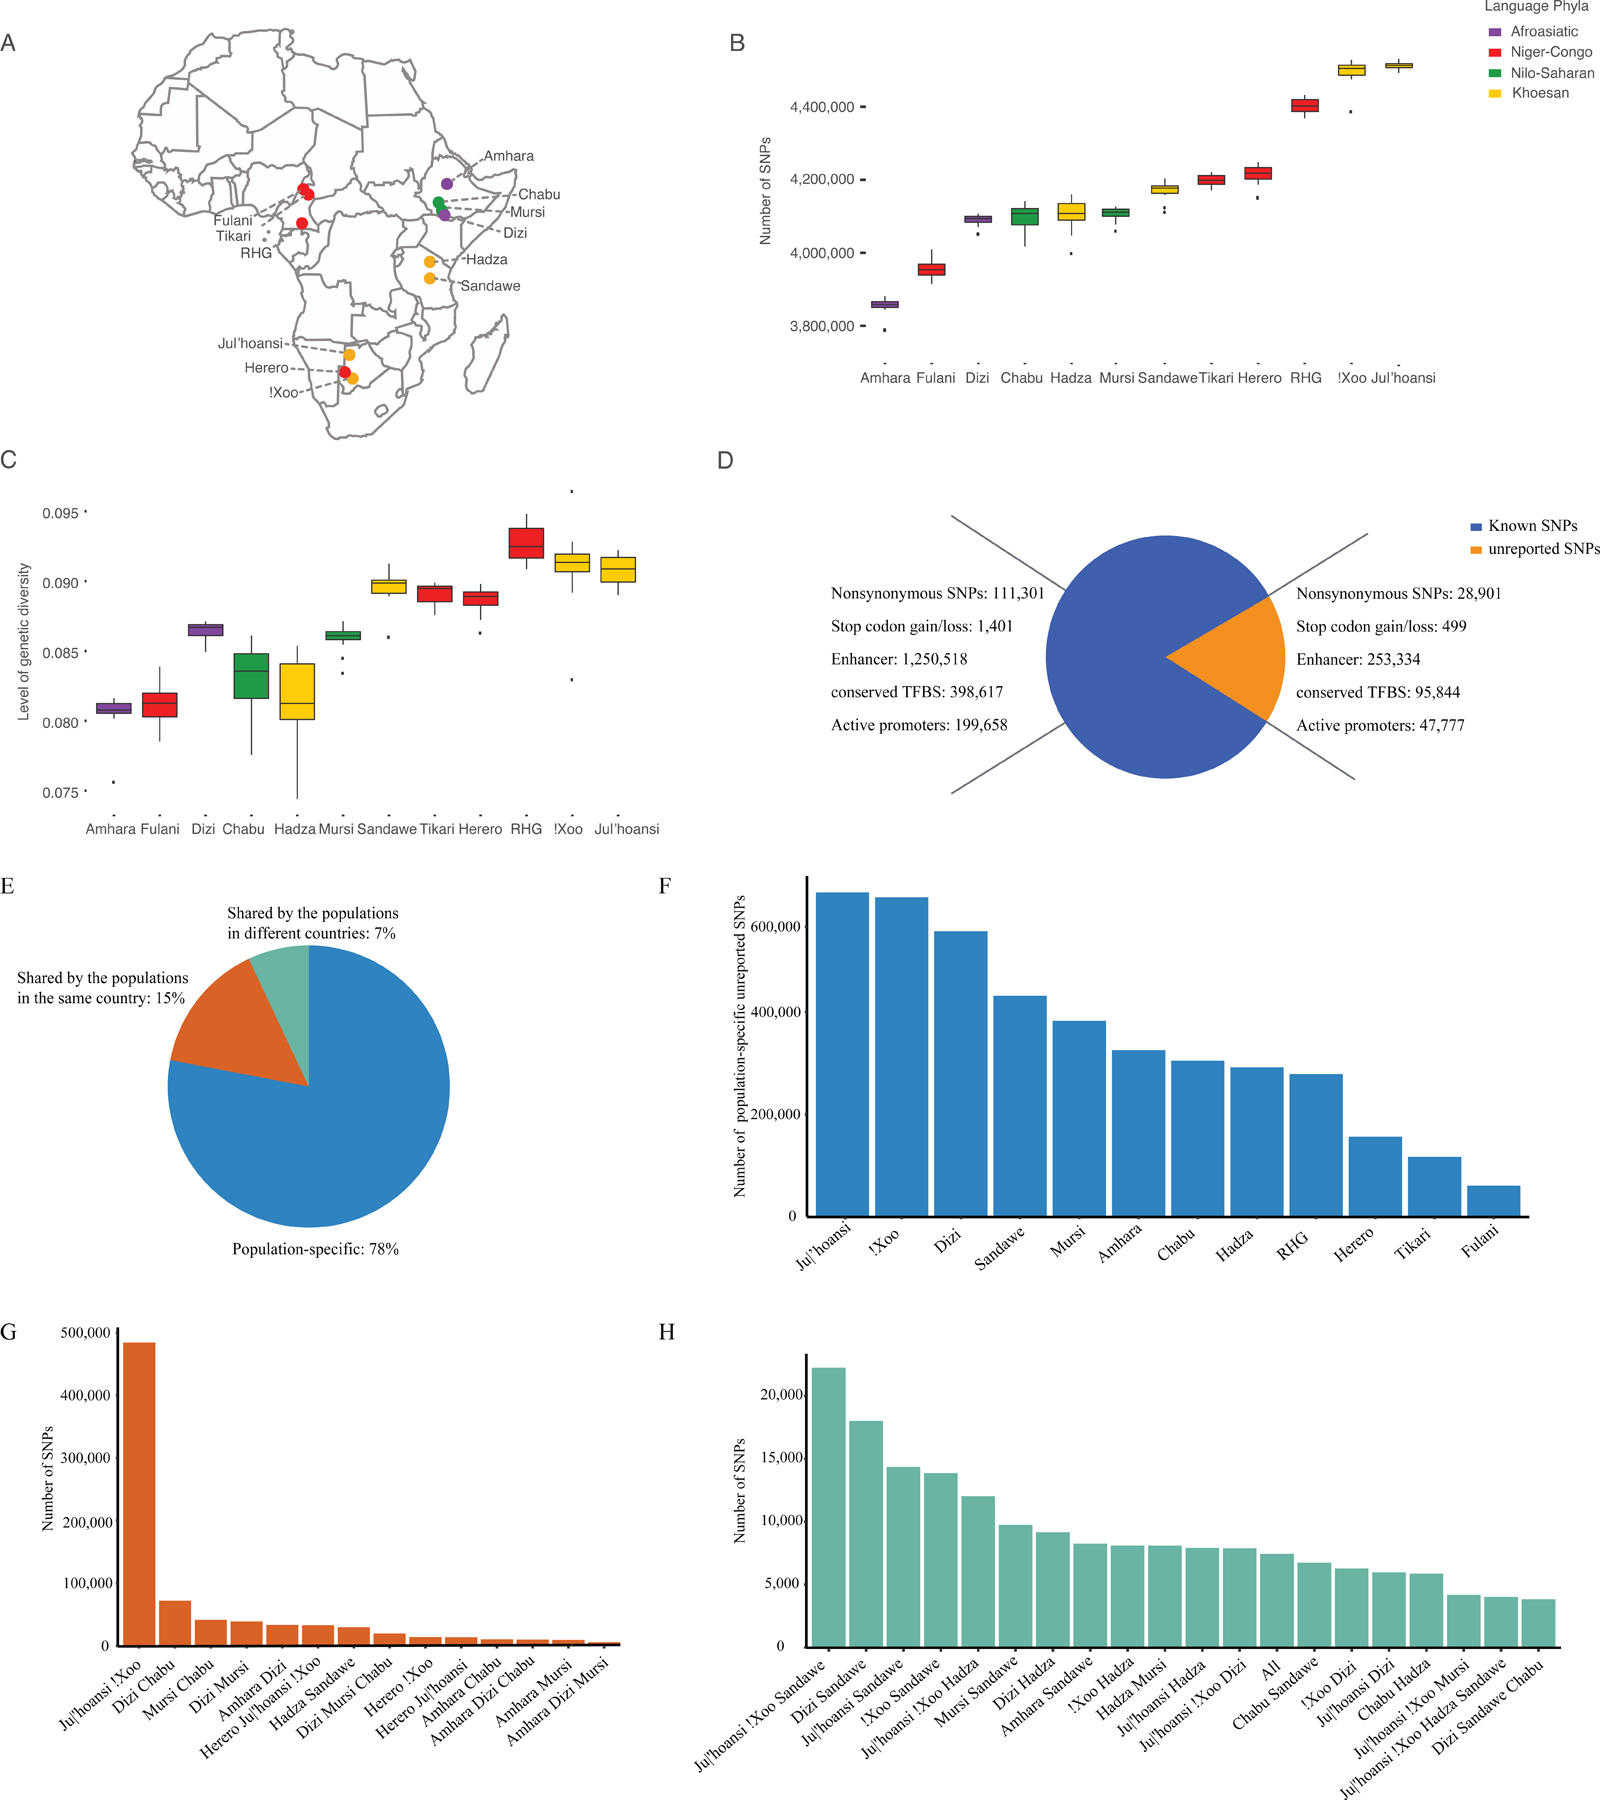
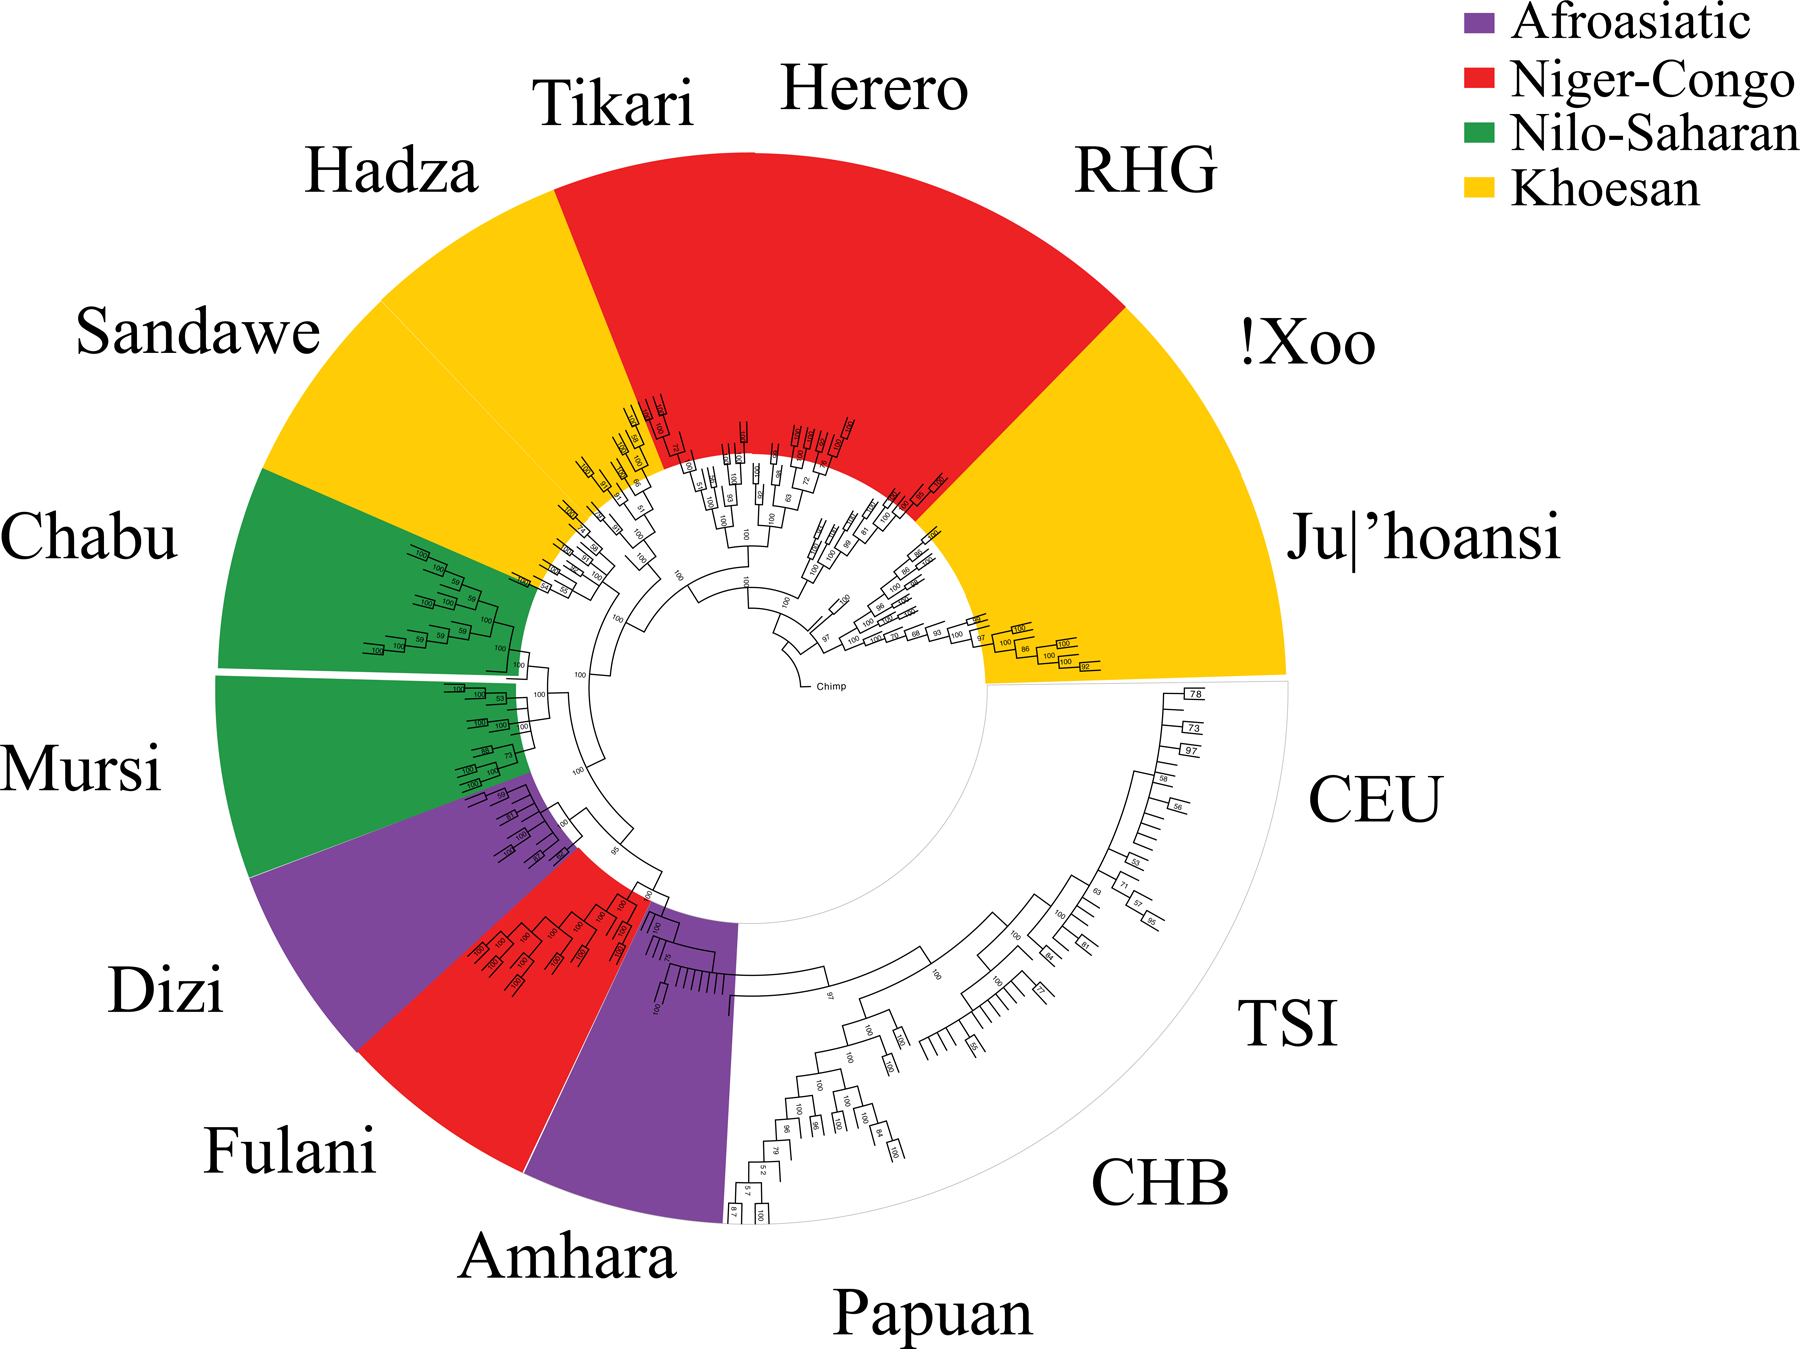
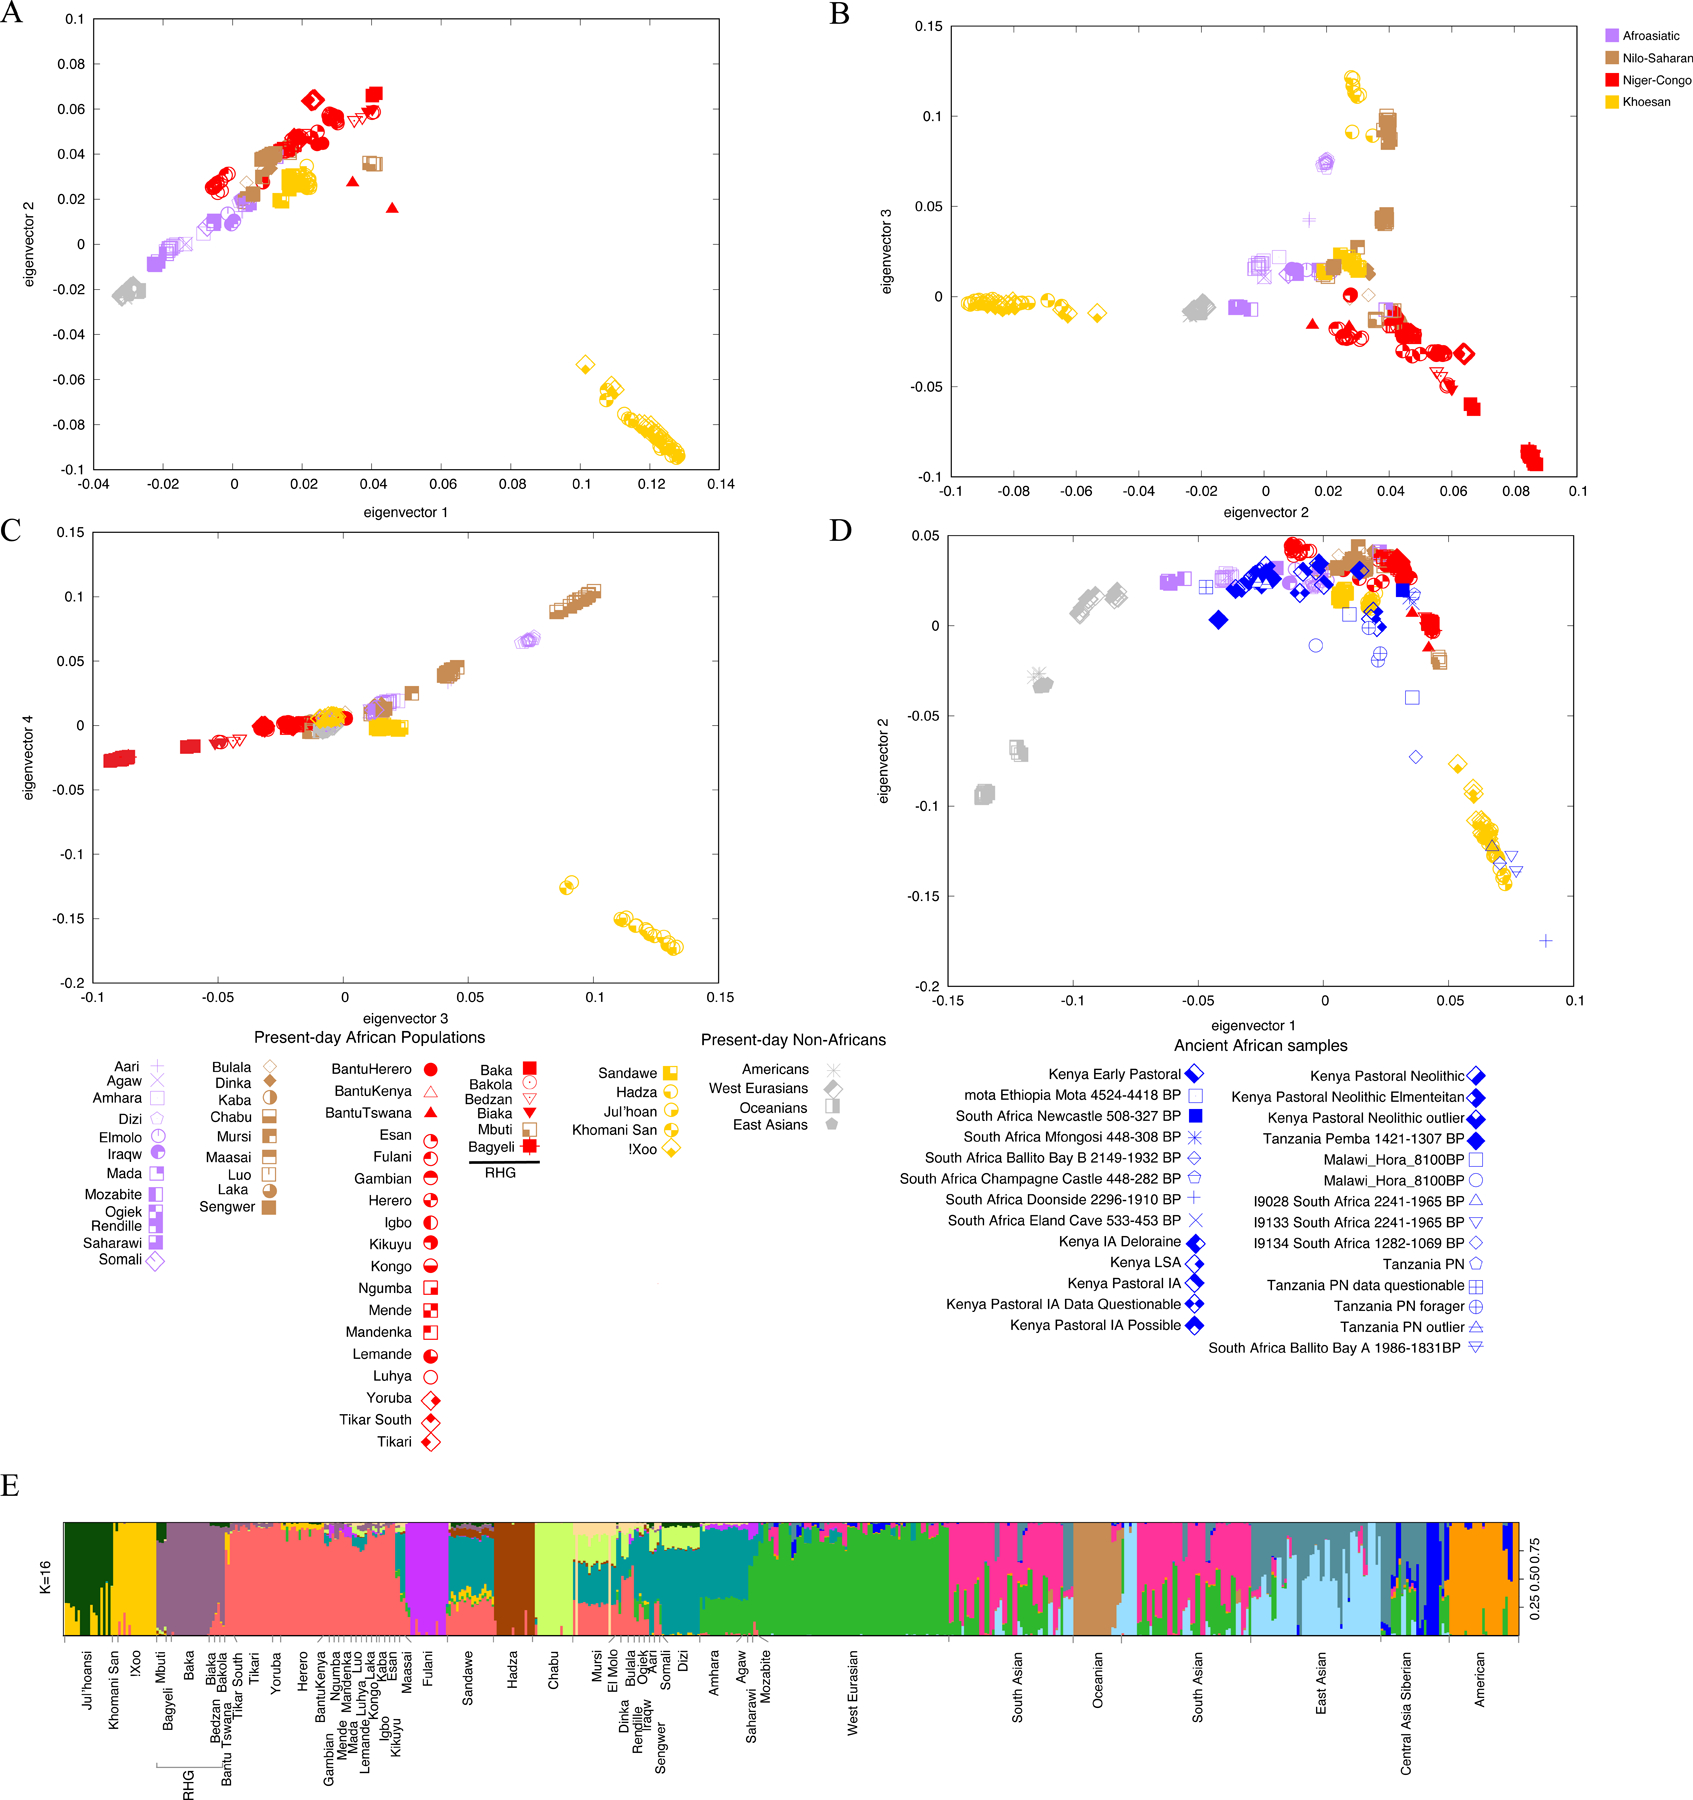
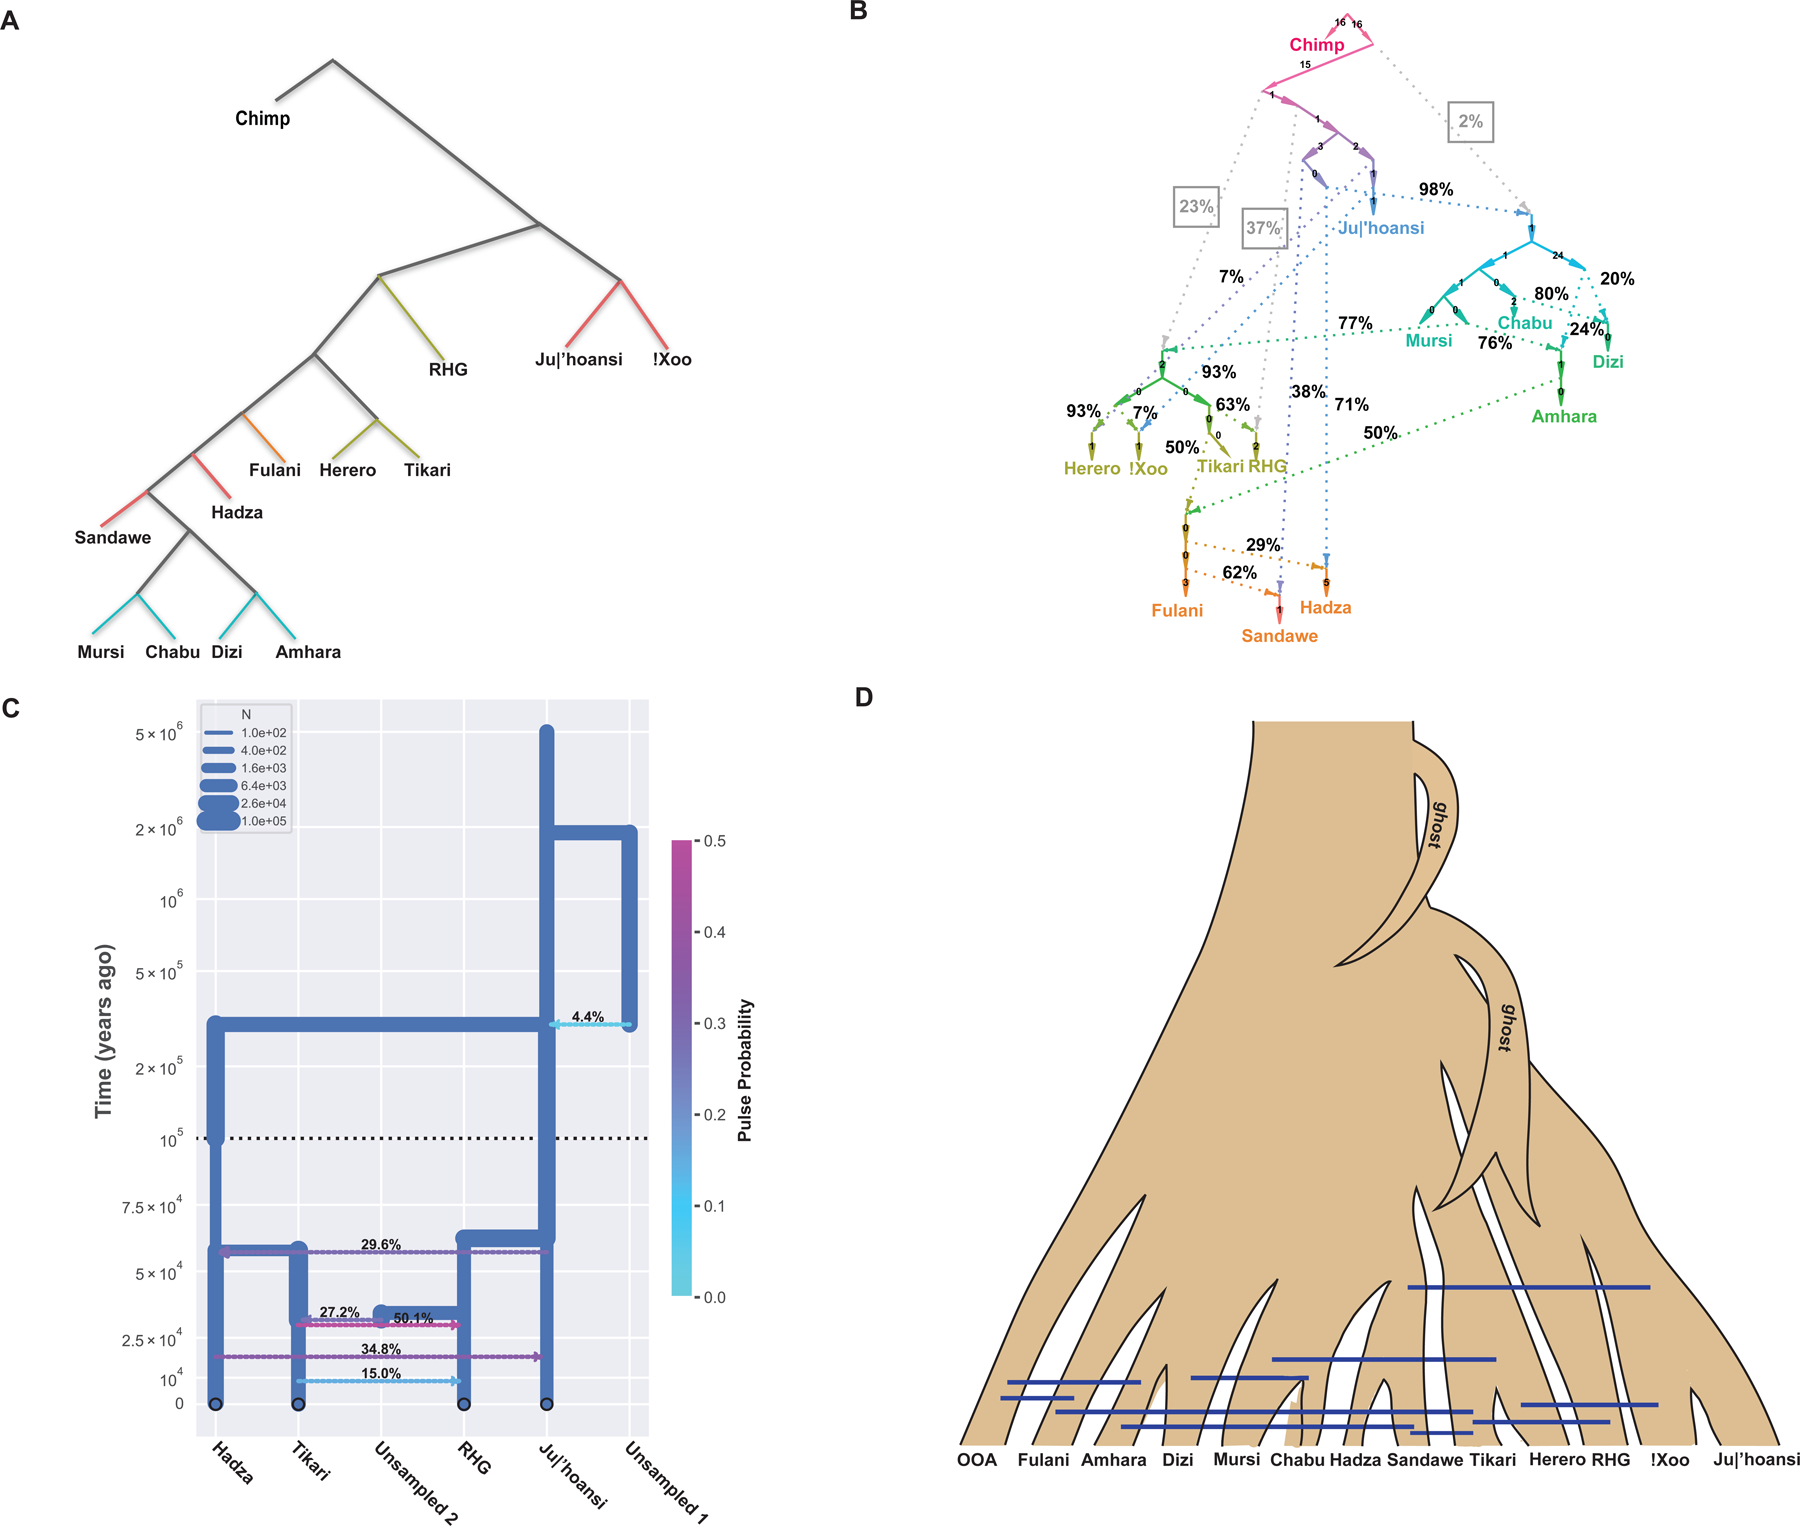
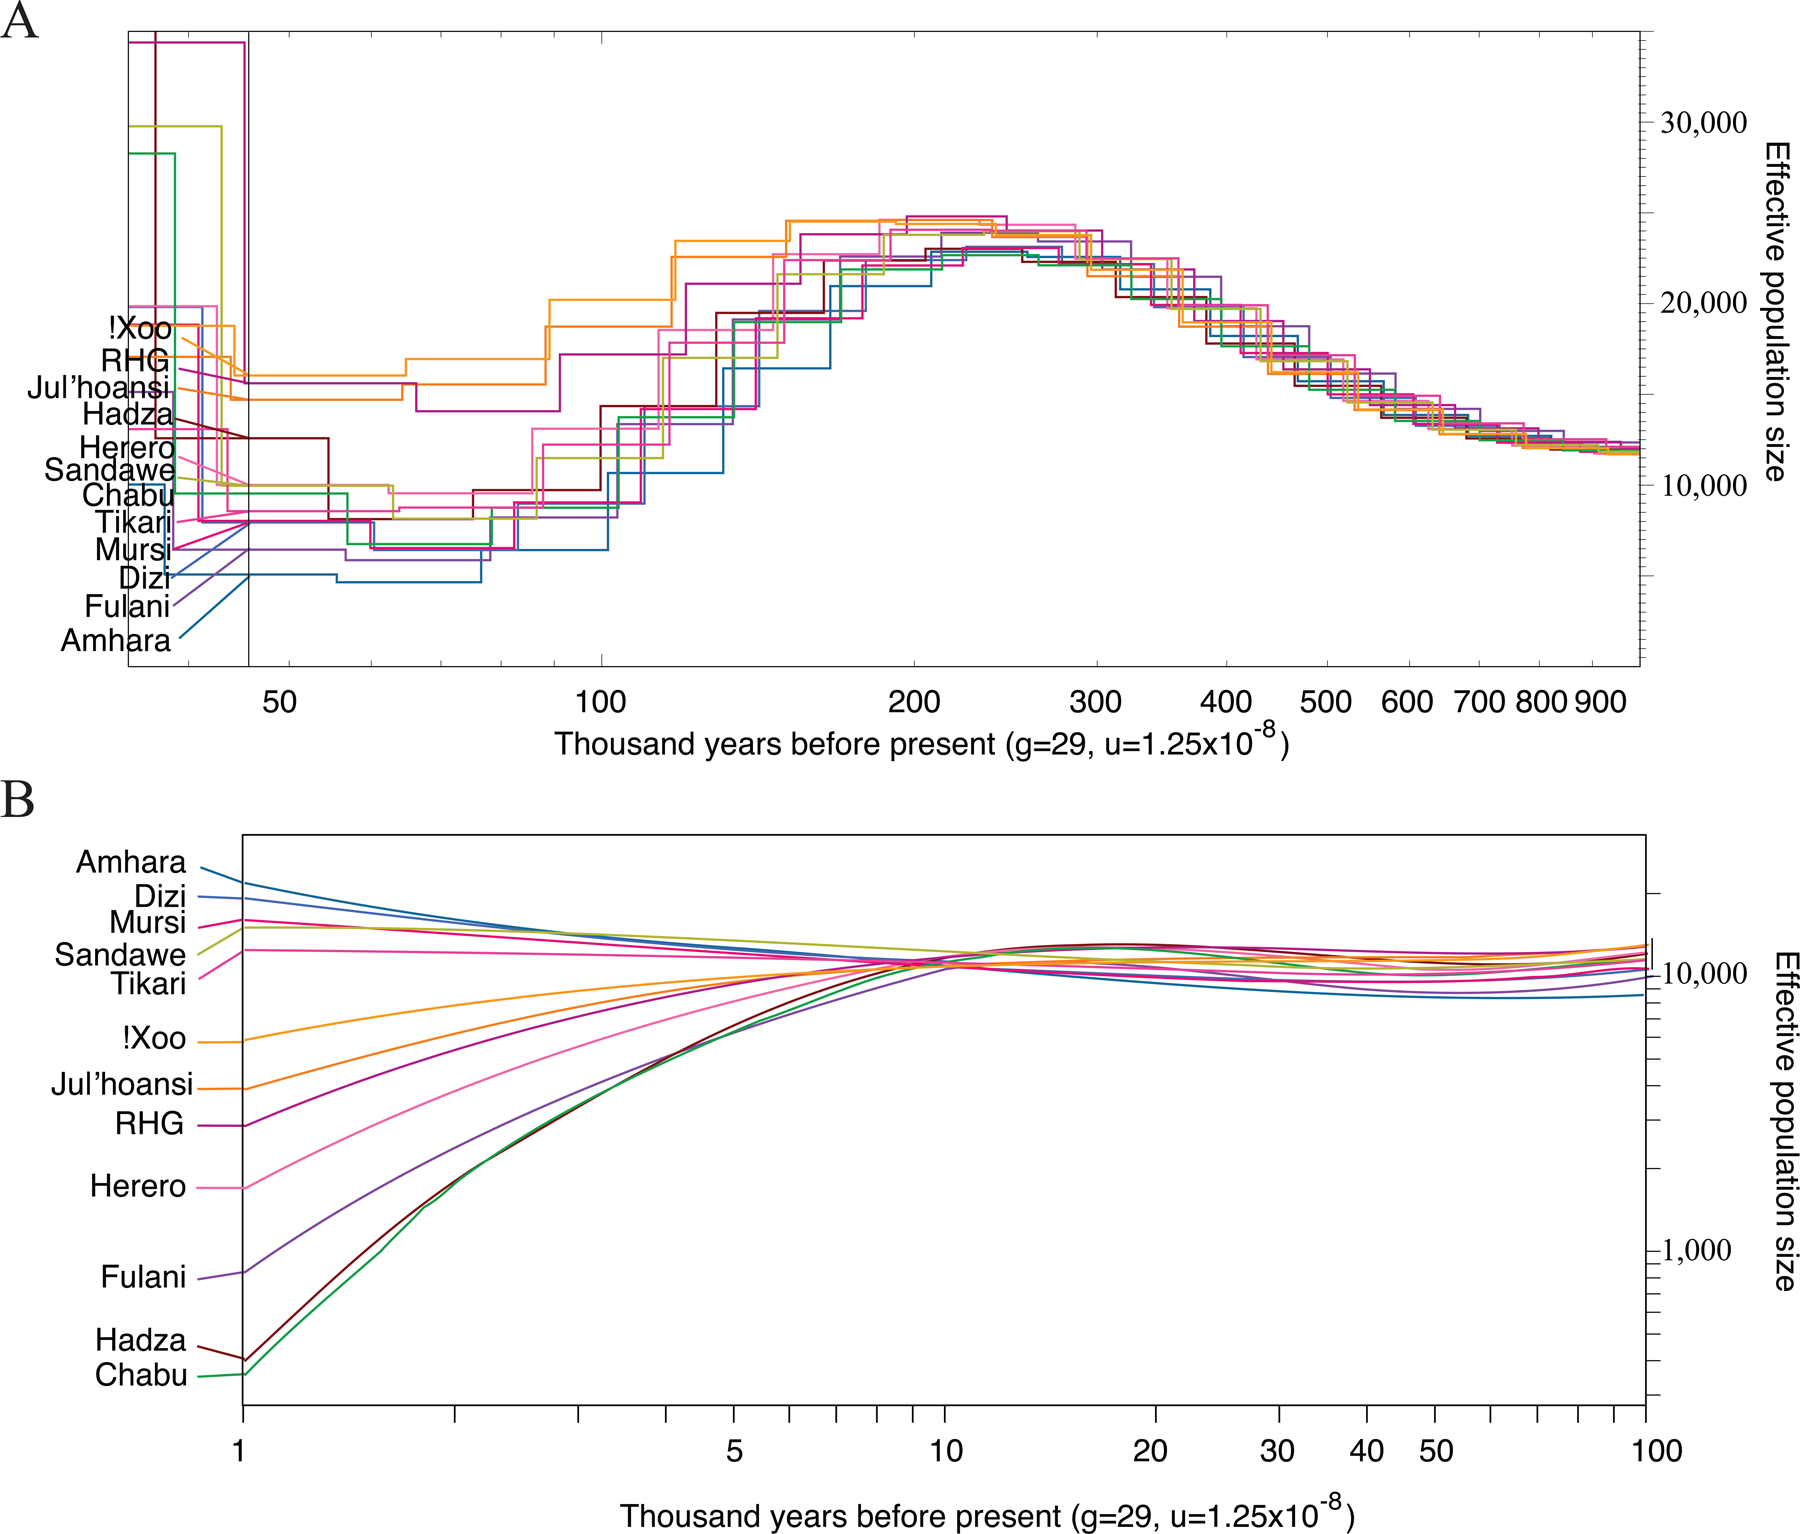
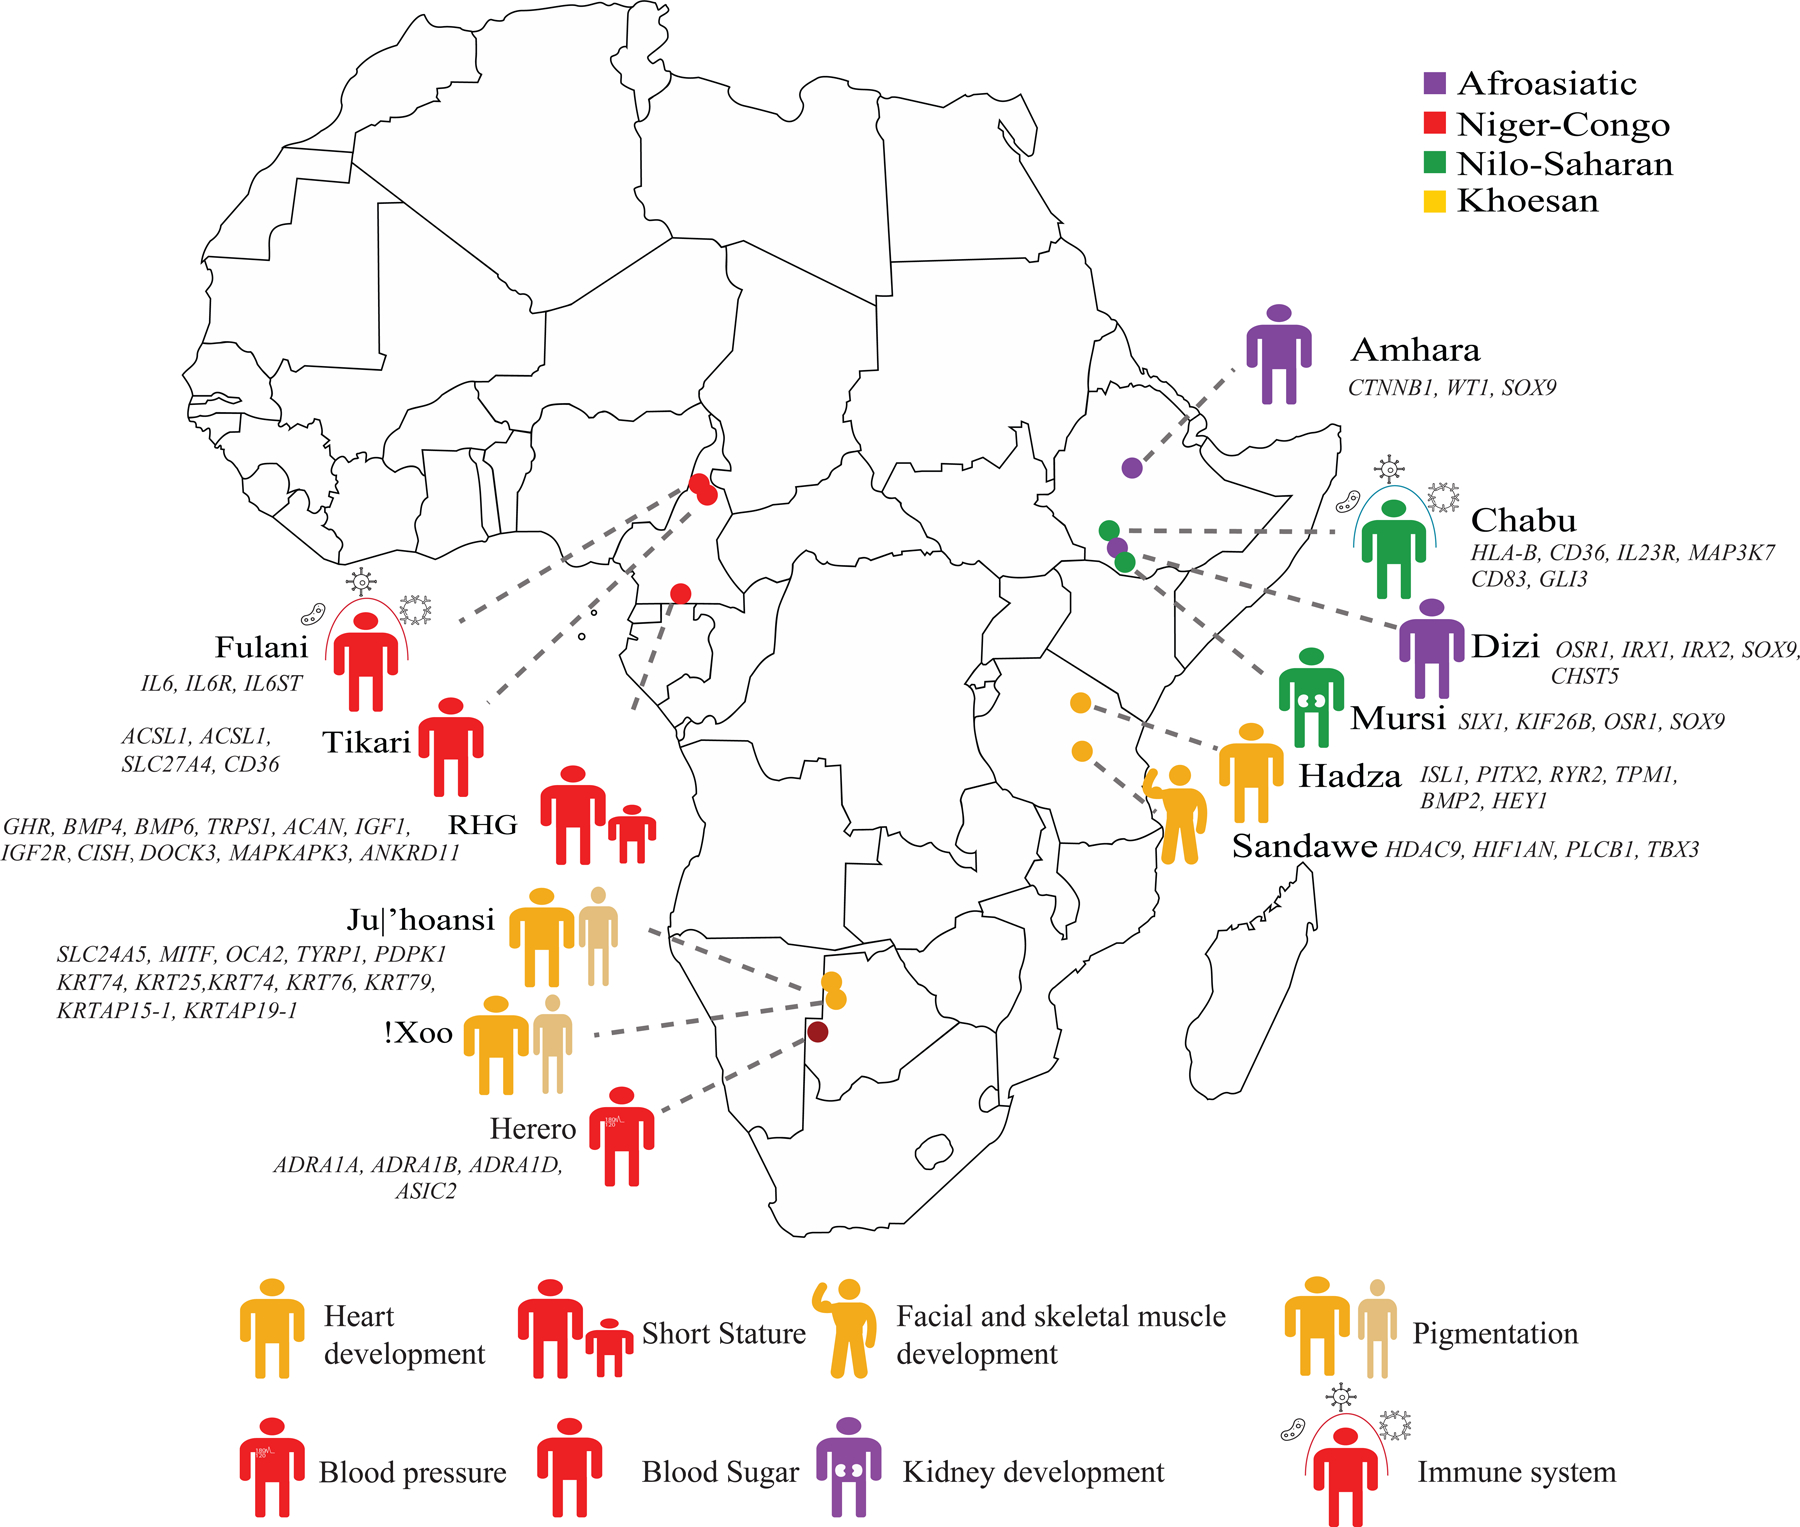
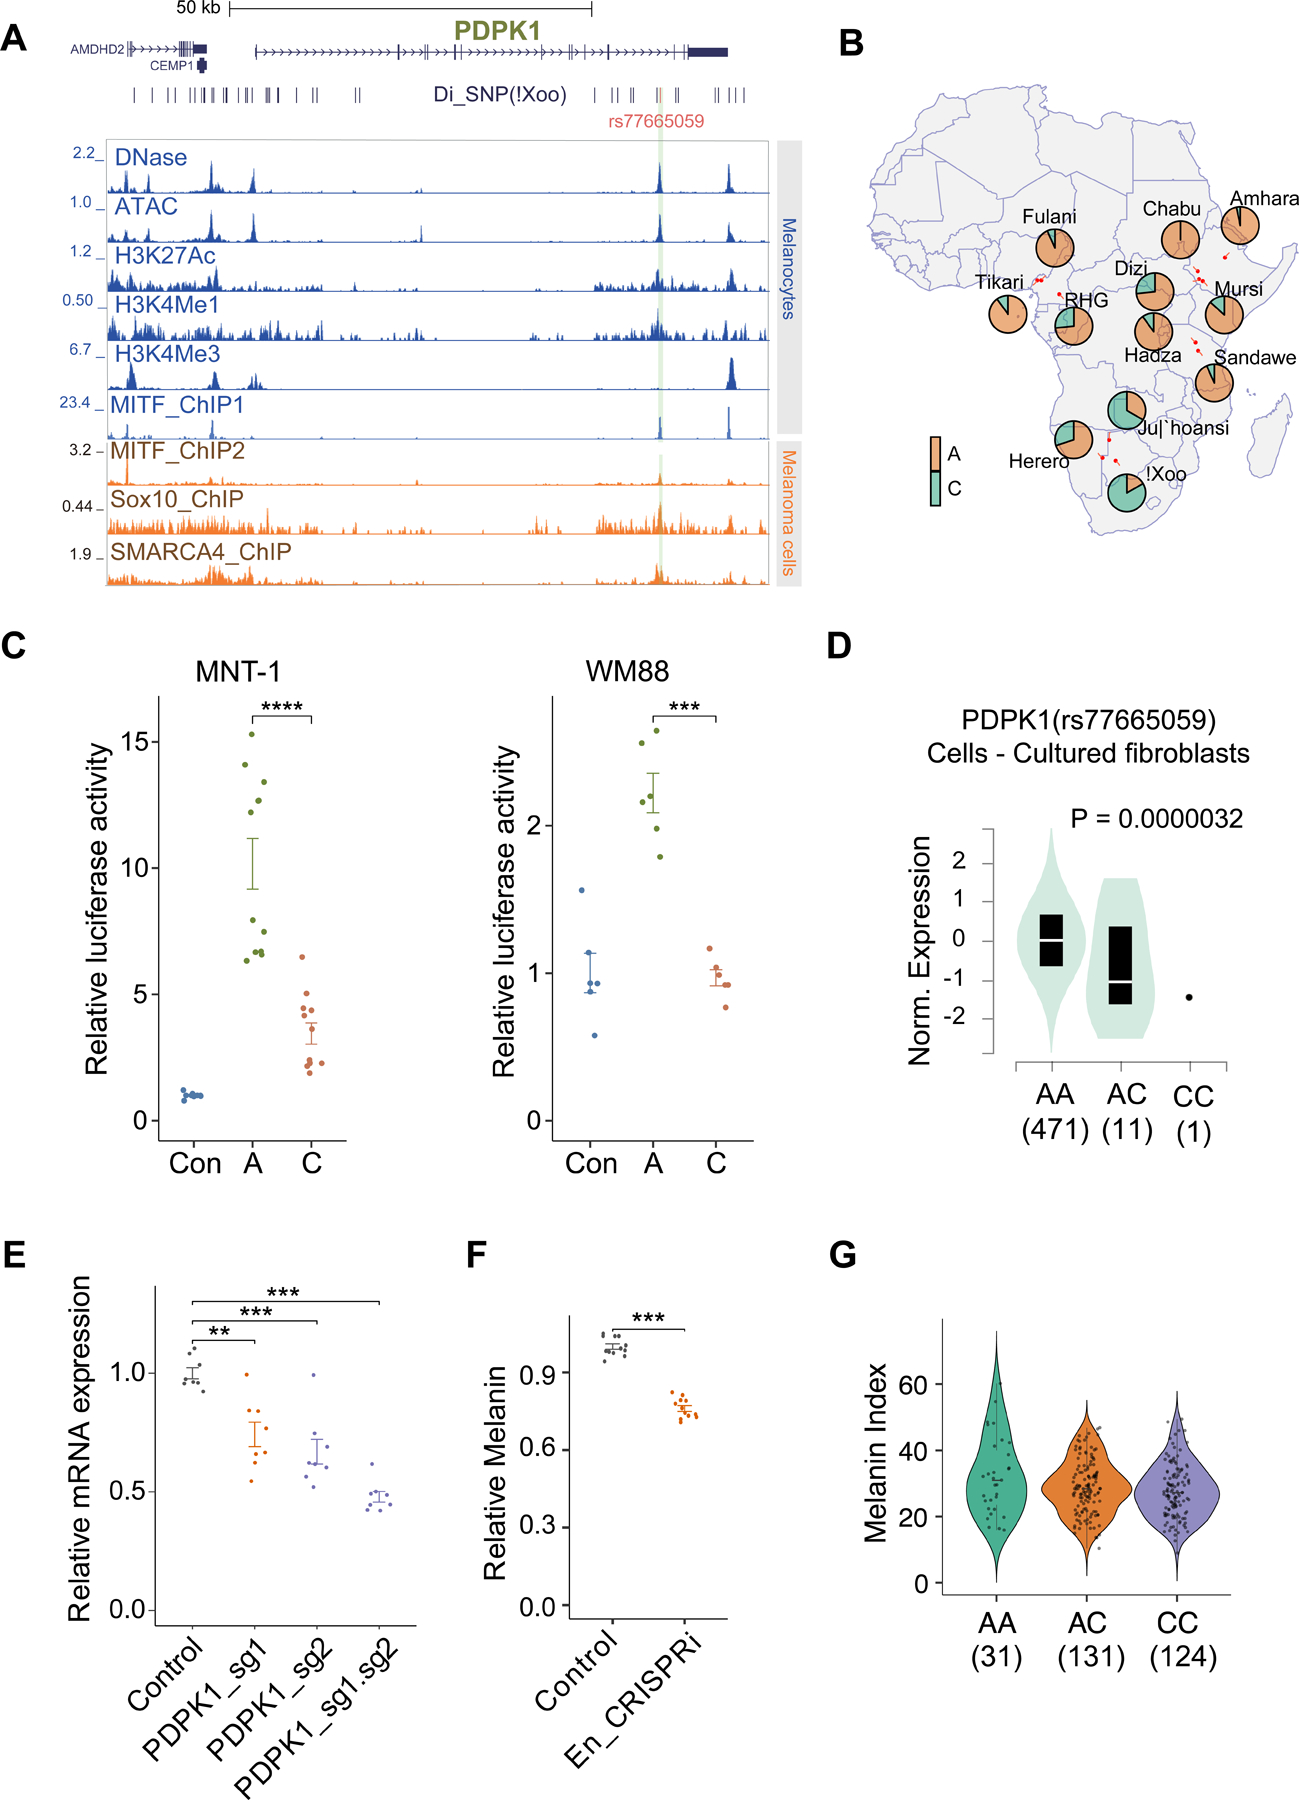
We conduct high coverage (>30×) whole-genome sequencing of 180 individuals from 12 indigenous African populations. We identify millions of unreported variants, many predicted to be functionally important. We observe that the ancestors of southern African San and central African rainforest hunter-gatherers (RHG) diverged from other populations >200 kya and maintained a large effective population size. We observe evidence for ancient population structure in Africa and for multiple introgression events from "ghost" populations with highly diverged genetic lineages. Although currently geographically isolated, we observe evidence for gene flow between eastern and southern Khoesan-speaking hunter-gatherer populations lasting until ∼12 kya. We identify signatures of local adaptation for traits related to skin color, immune response, height, and metabolic processes. We identify a positively selected variant in the lightly pigmented San that influences pigmentation in vitro by regulating the enhancer activity and gene expression of PDPK1.

Keywords: African demographic history; African genomics; Khoesan; archaic introgression; gene regulation; human evolution; local adaptation; natural selection; population structure; skin color.


Conflict of interest statement

Declaration of interests The authors declare that they have no competing interests.

Figures

Figure 1.
Figure 1.. Geographic locations of the samples and summary of the variants identified in this study.
A: Points are populations, with color indicating language classification. B: Number of SNPs across populations compared to the human reference genome (hg19). C: Genetic diversity in terms of heterozygosity across populations. D: Number of unreported and known SNPs and their potentially functional impacts. Here, unreported SNPs were identified by comparison to dbSNP (version 155) and gnomAD (version 2.1) databases. Annotations of regulatory elements were generated by the Encode project based on predicted chromatin state of lymphoblastoid cells from the “GM12878” sample as well as conserved transcription factor binding sites (TFBS). These annotations were downloaded from the UCSC genome browser website. E: Pattern of shared unreported SNPs in different populations. F: Number of population-specific unreported SNPs in each population. G: Number of unreported SNPs identified in populations in the same country. H: Number of unreported SNPs identified in populations in different countries. “All” corresponds to SNPs that were shared by all 12 populations. RHG: rainforest hunter-gatherers.
Figure 2.
Figure 2.. A neighbor-joining phylogeny of African and representative global individuals based on whole genome sequence data.
Numbers at each node indicate bootstrap values based on 100 bootstraps. CEU: Northern Europeans from Utah. TSI: Toscani in Italia. CHB: Han Chinese in Beijing, China are from the 1000 Genomes Project. Papuan samples were sequenced by the SGDP.
Figure 3.
Figure 3.. Population structural analyses based on principal component analysis (PCA) and ADMIXTURE.
A-C: PCA of modern human populations from the present study with the SGDP. D: Projection of ancient samples from previous studies,,, onto PCs 1 and 2. Points are individuals and colors indicate language classification (purple Afroasiatic, brown Nilo-Saharan, red Niger-Congo, and yellow Khoesan). E: ADMIXTURE result for K=16. Bars are individuals and colors indicate ancestry proportions.
Figure 4.
Figure 4.. Demographic history of African populations modeled by qpgraph and momi.
A: Demographic history without admixture inferred by qpgraph. B: Demographic history with 10 admixture events inferred by qpgraph. Percentages on the dashed lines show ancestry proportions from the two source populations. Numbers on solid lines are inferred drift lengths. The percentages of archaic ancestries are boxed and highlighted in grey. C: Divergence times and gene flow inferred by momi., Modeling San and RHG as a sister clade consistently had the highest likelihood compared to other topologies. D: Summarization of the results of demographic analyses. Blue bars show inferred gene flow among modern human populations. OOA: out of Africa populations. Ghost: inferred introgression from a ghost population. We observe evidence of introgression from a deeply diverged population into the ancestor of all modern human populations. In addition, the Bantu-speaking and RHG populations show some ancestry that is very old, possibly reflecting subsequent introgression with a deeply diverged population.
Figure 5.
Figure 5.. Inferred effective population sizes
A: the results of PSMC. B: the results from SMC++, plotting effective population size against time, assuming a per-nucleotide, per-generation mutation rate of 1.25 × 10⁻⁸ and generation time of 29 years.
Figure 6.
Figure 6.. Representative phenotypic and physiological traits shaped by positive selection due to local adaptation in African populations.
We identified signatures of positive selection in different populations using the di statistic. Representative traits and genes were selected based on functional annotation of outlier SNPs in different populations using GREAT.
Figure 7.
Figure 7.. rs77665059 affects the enhancer activity of PDPK1 and may contribute to light skin color of the San.
(A) rs77665059 overlaps a melanocyte-specific open chromatin region in the intron of PDPK1. (B) Allele frequency of rs77665059 in 12 African populations. C is the ancestral allele, highlighted in green. (C)Luciferase reporter assay of rs77665059 in MNT-1 and WM88 melanoma cells. N=10–12. (D) rs77665059 is an eQTL of PDPK1 in cultured fibroblast cells. Data from GTEx. (E) CRISPRi of the enhancer inhibits PDPK1 gene expression. (F) CRISPRi of the PDPK1 enhancer decreases the melanin level in MNT-1 cells. (G)Melanin index for different genotypes of rs77665059 in the San. One-way ANOVA with pos hoc tests were used in C, E, and F. **** indicates p < 0.0001, *** indicates p < 0.001.

References

    1. Hublin J-J, Ben-Ncer A, Bailey SE, Freidline SE, Neubauer S, Skinner MM, Bergmann I, Le Cabec A, Benazzi S, Harvati K, and Gunz P (2017). New fossils from Jebel Irhoud, Morocco and the pan-African origin of Homo sapiens. Nature 546, 289–292. 10.1038/nature22336. - DOI - PubMed
    1. Beltrame MH, Rubel MA, and Tishkoff SA (2016). Inferences of African evolutionary history from genomic data. Curr. Opin. Genet. Dev 41, 159–166. 10.1016/j.gde.2016.10.002. - DOI - PMC - PubMed
    1. Tishkoff SA, Reed FA, Friedlaender FR, Ehret C, Ranciaro A, Froment A, Hirbo JB, Awomoyi AA, Bodo J-M, Doumbo O, et al. (2009). The genetic structure and history of Africans and African Americans. Science 324, 1035–1044. 10.1126/science.1172257. - DOI - PMC - PubMed
    1. Blench R (2006). Archaeology, Language, and the African Past (Rowman Altamira; ).
    1. Heine B, and Nurse D (2000). African Languages: An Introduction (Cambridge University Press; ).

Publication types

Substances