. 2023 Mar 16;186(6):1144-1161.e18.
doi: 10.1016/j.cell.2023.02.004. Epub 2023 Mar 2.

Apoptotic cell fragments locally activate tingible body macrophages in the germinal center

Affiliations

Apoptotic cell fragments locally activate tingible body macrophages in the germinal center

Abigail K Grootveld et al. Cell. .

Abstract

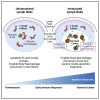
Germinal centers (GCs) that form within lymphoid follicles during antibody responses are sites of massive cell death. Tingible body macrophages (TBMs) are tasked with apoptotic cell clearance to prevent secondary necrosis and autoimmune activation by intracellular self antigens. We show by multiple redundant and complementary methods that TBMs derive from a lymph node-resident, CD169-lineage, CSF1R-blockade-resistant precursor that is prepositioned in the follicle. Non-migratory TBMs use cytoplasmic processes to chase and capture migrating dead cell fragments using a "lazy" search strategy. Follicular macrophages activated by the presence of nearby apoptotic cells can mature into TBMs in the absence of GCs. Single-cell transcriptomics identified a TBM cell cluster in immunized lymph nodes which upregulated genes involved in apoptotic cell clearance. Thus, apoptotic B cells in early GCs trigger activation and maturation of follicular macrophages into classical TBMs to clear apoptotic debris and prevent antibody-mediated autoimmune diseases.

Keywords: B cells; apoptosis; autoimmunity; germinal center; tingible body macrophages.


Conflict of interest statement

Declaration of interests The authors declare no competing interests.

Figures
Graphical abstract
Graphical abstract
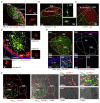
Figure 1
Figure 1. Visualization of TBMs by CD169, CX3CR1, and CD68 reporters
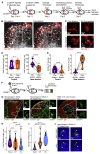
(A) Maximum intensity projection (MIP) of the inguinal lymph node of an unimmunized CD169Tom mouse. SHG, second harmonic generation (blue); green, naive Kaede B cells; red, tdTomato; magenta, follicular stroma labeled with anti-CD157 antibody. SSM; subcapsular sinus macrophage; IF, interfollicular zone. (B and C) Confocal images of inguinal lymph nodes of unimmunized CX3CR1Gfp (B) and CD68Gfp mice (C) stained for IgD (red). (D) MIP of CD169Tom inguinal lymph node 10 days after HEL-OVA immunization. SHG, second harmonic generation (blue); cyan, CFP OT-II T cells; green, Kaede SWHEL GC B cells. SSM; subcapsular sinus macrophage; FMZ, follicular mantle zone; GC, germinal center; TBM, tingible body macrophage. See also Video S1. (E) Confocal image of day 8 Kaede SWHEL GC in a CD169Tom mouse. Sections were stained with CD169 (magenta) and DAPI (blue). Arrowheads indicate vacuoles containing DAPI only (purple); Kaede only (pink); DAPI and Kaede (cyan). (F) Combined fluorescent and brightfield image day 8 Kaede SWHEL GC in a CD169Tom mouse showing TUNEL staining.
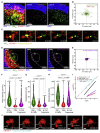
Figure 2
Figure 2. Stationary TBMs use processes to chase and capture motile dead cell fragments
(A) MIP of day 10 GC in CD169Tom mice showing the imaging volume (left panel), spot detection (middle panel), and cell tracks (right panel). SHG (blue); OT-II T cells (cyan); Kaede B cells (green). See also Video S2. (B) Tracks of GC B cells (green) and TBMs (red) centered on the same origin. (C) Time-lapse images from day 14 GC in a CD169Tom lymph node showing Kaede SWHEL B cells (green) fragmenting (pseudocolored yellow) next to a TBM (red). See also Video S3. (D) MIP of day 10 GC in CD169Tom mice showing the imaging volume (left panel), spot detection of B cell fragments (middle panel), and cell fragment tracks (right panel). SHG (blue); OT-II T cells (cyan); Kaede B cells (green). See also Video S4. (E) Tracks of apoptotic cell fragments (magenta) centered on the same origin. (F) Violin plot of mean velocity for GC B cells (green, n = 943), TBMs (red, n = 54), and GC B cell fragments (pink, n = 842). n represents individual cells/fragments and data are representative of at least 3 independent movies. (G) Violin plot of displacement for GC B cells (green, n = 943), TBMs (red, n = 54), and GC B cell fragments (pink, n = 842). n represents individual cells/fragments and data are representative of at least 3 independent movies. (H) Violin plot of meandering index for GC B cells (green, n = 943), TBMs (red, n = 54), and GC B cell fragments (pink, n = 842). n represents individual cells/ fragments and data are representative of at least 3 independent movies. (I) Mean squared displacement (MSD) plot of apoptotic fragments, GC B cells, GC T cells, and TBMs. (J) Time-lapse images from day 14 GC in a CD169Tom lymph node showing a TBM (red) extending a process to capture an apoptotic cell fragment (pseudocolored cyan). See also Video S5.
Figure 3
Figure 3. TBMs use a “lazy” search strategy to capture apoptotic cell fragments
(A) MIP of day 14 GC in CD169Tom mice showing the imaging volume (left panel), spot detection of TBMs and GC surface (middle panel), and nearest neighbor distance between TBM centroids (right panel). SHG (blue); Kaede B cells (green). (B) Nearest neighbor distances between observed TBMs (red) in the GC and Monte Carlo sampling of randomly generated points in an equivalent simulated sphere of radius 81μm. (C) Analysis of TBM imaged in Figure 2J by filament tracing (left panel) the cell processes with filaments (yellow) and the tracks of the endpoints of the filaments (gray). TBM contour (right panel) shows the outline of the TBM (red) and the cell processes pseudocolored for their total track displacement. (D) Comparison of the total track displacement of TBM centroids (red) to cell processes (yellow). n = number of TBMs or cell processes tracked. (E) Time projection showing increase in the effective TBM volume from observed (red) to projected (yellow) as a proportion of total GC volume for n = 10 GCs. (F) Simulated TBM volume on clearance rate for non-migratory (red) and migratory (blue) TBMs moving at a speed of 5 μm/min (n = 149 simulations). (G) Simulated effect of fragment abundance on clearance rate for non-migratory (red) and migratory (blue) TBMs moving at a speed of 5 μm/min (n = 248 simulations) in GC with dispersed TBMs. (H) As (G) in GC with non-dispersed randomly distributed TBMs (n = 248 simulations). (I) Optimal search conditions for apoptotic cell clearance. Differences in clearance rates for migratory and non-migratory TBMs were simulated for cell fragment speed and abundance (n = 1,428 simulations). Negative difference in clearance rates (red area) indicate conditions which favor more rapid clearance by stationary macrophages; positive differences (blue area) indicate conditions which favor more rapid clearance by migratory macrophages. The observed conditions are indicated by the dashed lines. Horizontal dashed line = cell fragment speed of 3.4 μm/min. Vertical dashed line = density of 2,665 cell fragments per GC.
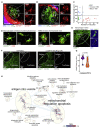
Figure 4
Figure 4. Single cell transcriptomic analysis of CD169-lineage cells
(A) SWNE plot of NMF-decomposed single-cell gene expression data. Genes are embedded in the SWNE plot with respect to their relative contribution to each cluster. (B) Stacked bar plot showing the proportion of each cell population in the resting and immunized state. (C) Mean expression of driver genes defining each cluster and key genes involved in macrophage biology. The size of the dots relate to the proportion of cells in which expression is detected. (D) CITE-seq expression of cell surface proteins and genes of interest. (E) Enrichment plots from GSEA comparing immunized putative TBM to all other populations against gene ontology (GO) genesets.
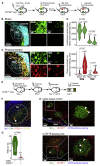
Figure 5
Figure 5. TBMs are derived from lymph node-resident macrophages
(A) Schematic of photoconversion experiment to optically highlight CD169-lineage cells in the lymph nodes of CD169Kik mice prior to immunization. (B) MIP of sham photoconverted control lymph node. (C) MIP of photoconverted lymph node. (D) Violin plot showing unphotoconverted green signal mean pixel intensity (top panel) and photoconverted red signal mean pixel intensity (bottom panel) for SSMs and TBMs in sham and photoconverted lymph nodes. n = number of individual cells; data are representative of 3 independent experiments. (E) Schematic for fate mapping the contribution of circulating monocytes to TBM pool using CCR2Tom mice adoptively transferred into wildtype mice immunized with CGG in ASO3-like adjuvant. (F) MIP confocal image of day 7 GC showing follicular mantle (IgD, blue), follicular dendritic cell network (CD21/CD35, mustard), macrophages (CD68, green), and monocyte-derived cells (tdTomato, red). A single monocyte-derived TBM (arrow) is shown. (G) Quantification of (F) from multiple mice/GCs. Number and percentage of CD68+ TBMs in the GC that are CCR2Tom positive or negative (n = number of GCs). Data from six mice and two independent experiments. (H) Confocal image of day 8 lymph nodes of CD169Tom mice treated with IgG2a isotype control antibody (left panel) or anti-CSF1R blocking antibody (right panel). Depletion of SSMs and MSMs are shown by CD169 antibody staining (blue). Kaede SWHEL GC B cells is shown in green.
Figure 6
Figure 6. TBMs adopt distinct morphologies depending on their maturation state
(A) MIP of day 9 GC in CD169Tom mice showing an immature TBM inside the GC with long cytoplasmic processes and few vacuoles. (B) MIP of day 10 GC in CD169Tom mice showing a mature, rounded TBM inside the GC with short cytoplasmic processes and multiple vacuoles. (C) Dot plot showing total measured filament length versus number of vacuoles for distinguishes 3 populations of TOM + macrophages: immature TBMs (blue), mature TBMs (red) and SSMs (green). (D) MIP confocal images of macrophages containing vacuoles (arrows) in naive follicles (unimmunized, left panels) and GCs (s.c. immunized CGG in ASO3-like adjuvant day 7, right panels) from inguinal lymph nodes of CX3CR1Gfp mice. Antibody staining for CD68 (red). (E) MIP confocal images of lymph nodes from unimmunized CD68Gfp mice stained with DAPI (blue). (F) MIP confocal images of lymph nodes from control and anti-CSFR1-treated CD68Gfp unimmunized mice. B cell follicles were demarcated using IgD (not shown). CD169 antibody staining marks SSMs (white). (G) Quantitation of (E), showing number of CD68-GFP+ macrophages per follicle. N = number of follicles examined. Data compiled from 4 mice and 2 independent experiments. (H) Network of GSEA pathways enriched in immunized TBM compared to resting TBM. Each node represents a GO pathway, with the color representing the normalized enrichment score (NES).
Figure 7
Figure 7. Nearby apoptotic cells activate TBM maturation
(A) Schematic for localized induction of B cell apoptosis in an ROI in the primary follicle by intravital two-photon photoablation in CD169Tom mice. (B) MIP of a lymph node showing the follicular stroma labeled with anti-CD157 (gray) and follicular macrophages (red) before (left panel) and after (right panel) intravital two-photon photoablation of the ROI. (C) Time-lapse images of follicular macrophages distal to (top panels) and neighboring (bottom panels) the ROI before (left panels) and 2 h after (right panels) intravital two-photon photoablation. Arrowheads indicate vacuoles. (D) Violin plot of total filament length pre- and post-ablation for control macrophages distal to (left panel) and macrophages near the ROI (right panel). n = number of macrophages tracked. (E) Violin plot of number of vacuoles pre- and post-ablation for control macrophages distal (left panel) and macrophages near the ROI (right panel). n = number of macrophages tracked. (F) Schematic for inducible ablation of adoptively transferred B cells by diphtheria toxin in CD68Gfp mice. (G) MIP confocal images showing macrophages in the primary follicles of unimmunized mice (left panel) and diphtheria toxin (DT) treated mice (middle panel) and secondary follicles of day 7 CGG/AddaSO3 immunized mice (right panel), stained for IgD(red)-negative GCs. Representative of results from three mice per group and two experiments. (H) Violin plot of total filament length for GFP+ macrophages in the follicles of naive, diphtheria toxin- (DT) treated mice and in the GC of immunized mice. (I) Violin plot of number of vacuoles for GFP + macrophages in the follicles of naive, diphtheria toxin- (DT) treated mice and in the GC of immunized mice. (J) Confocal image showing macrophages in the primary follicle of DT-treated mice stained with DAPI (blue). Arrows point to DAPI+ DNA within vacuoles.

Comment in

References

    1. Victora GD, Nussenzweig MC. Germinal Centers. Annu Rev Immunol. 2022;40:413–442. doi: 10.1146/annurev-immunol-120419-022408. - DOI - PubMed
    1. Long Z, Phillips B, Radtke D, Meyer-Hermann M, Bannard O. Competition for refueling rather than cyclic reentry initiation evident in germinal centers. Sci Immunol. 2022;7:eabm0775. doi: 10.1126/sciimmunol.abm0775. - DOI - PMC - PubMed
    1. Mayer CT, Gazumyan A, Kara EE, Gitlin AD, Golijanin J, Viant C, Pai J, Oliveira TY, Wang Q, Escolano A, et al. The microana-tomic segregation of selection by apoptosis in the germinal center. Science. 2017;358:eaao2602. doi: 10.1126/science.aao2602. - DOI - PMC - PubMed
    1. Stewart I, Radtke D, Phillips B, McGowan SJ, Bannard O. Germinal center B cells replace their antigen receptors in dark zones and fail light zone entry when immunoglobulin gene mutations are damaging. Immunity. 2018;49:477–489.:e7. doi: 10.1016/j.immuni.2018.08.025. - DOI - PMC - PubMed
    1. Brink R, Phan TG. Self-reactive B cells in the germinal center reaction. Annu Rev Immunol. 2018;36:339–357. doi: 10.1146/an-nurev-immunol-051116-052510. - DOI - PubMed

Publication types