Randomized Controlled Trial
. 2023 Jun 6;35(6):928-942.e4.
doi: 10.1016/j.cmet.2023.02.006. Epub 2023 Mar 2.

Sustained alternate-day fasting potentiates doxorubicin cardiotoxicity

Affiliations
Randomized Controlled Trial

Sustained alternate-day fasting potentiates doxorubicin cardiotoxicity

Mualla Ozcan et al. Cell Metab. .

Abstract

Fasting strategies are under active clinical investigation in patients receiving chemotherapy. Prior murine studies suggest that alternate-day fasting may attenuate doxorubicin cardiotoxicity and stimulate nuclear translocation of transcription factor EB (TFEB), a master regulator of autophagy and lysosomal biogenesis. In this study, human heart tissue from patients with doxorubicin-induced heart failure demonstrated increased nuclear TFEB protein. In mice treated with doxorubicin, alternate-day fasting or viral TFEB transduction increased mortality and impaired cardiac function. Mice randomized to alternate-day fasting plus doxorubicin exhibited increased TFEB nuclear translocation in the myocardium. When combined with doxorubicin, cardiomyocyte-specific TFEB overexpression provoked cardiac remodeling, while systemic TFEB overexpression increased growth differentiation factor 15 (GDF15) and caused heart failure and death. Cardiomyocyte TFEB knockout attenuated doxorubicin cardiotoxicity, while recombinant GDF15 was sufficient to cause cardiac atrophy. Our studies identify that both sustained alternate-day fasting and a TFEB/GDF15 pathway exacerbate doxorubicin cardiotoxicity.

Keywords: TFEB; cardiotoxicity; doxorubicin; intermittent fasting.


Conflict of interest statement

Declaration of interests A.J. has a pending patent for fusion protein nanodiscs for the treatment of heart failure and eye disease, is a member of the scientific advisory board of Mobius Scientific, and receives research funding from AstraZeneca, unrelated to the studies in this manuscript. M.K. receives consulting fees/honoraria from AstraZeneca, Amgen, Sanofi-Aventis, Boehringer Ingelheim, Glytec, Merck, Janssen Pharmaceuticals, Novartis, Applied Therapeutics, Bayer Healthcare Pharmaceuticals, Eli Lilly and Company, and Vifor Pharma and research grants from AstraZeneca and Boehringer Ingelheim. A. Diwan reports consulting for clinical trials with Clario (previously ERT/Biomedical systems) and serves on the scientific advisory board for Dewpoint Therapeutics, which are not relevant to the current study.

Figures

Figure 1.
Figure 1.. Myocardium from patients with doxorubicin cardiomyopathy demonstrates increased nuclear TFEB content.
(A) Body mass index of donors (Donor, n=10), patients with a history of heart failure due to doxorubicin cardiomyopathy (DC, n=11), and patients with non-ischemic dilated cardiomyopathy (NICM, n=6) (one-way ANOVA, no significant difference). (B) Ejection fraction of Donor (n=10), patients with DC (n=11), and patients with NICM (n=6) (one-way ANOVA with Sidak’s correction for multiple comparisons). (C) Left ventricular (LV) mass index of Donor (n=10), patients with DC (n=7), and patients with NICM (n=6) (one-way ANOVA with Sidak’s correction for multiple comparisons). (D) LV mass/posterior wall (PW) thickness of Donor (n=8), patients with DC (n=6), and patients with NICM (n=6) (one-way ANOVA with Sidak’s correction for multiple comparisons). (E) LV end-diastolic dimension (LVEDD) of Donor (n=8), patients with DC (n=8), and patients with NICM (n=6) (one-way ANOVA with Sidak’s correction for multiple comparisons). (F) LV mass/LVEDD of Donor (n=8), patients with DC (n=6), and patients with NICM (n=6) (one-way ANOVA with Sidak’s correction for multiple comparisons). (G) Representative immunoblots of TFEB in nuclear isolates of LV myocardial tissue from Donor (n=10), patients with DC (n=11), and patients with NICM (n=6). Histone H3 serves as a loading control and GAPDH is shown to verify cytoplasmic protein removal. (H) Quantification of immunoblots in (G) (One-way ANOVA with Sidak’s correction for multiple comparisons). All data are presented as mean ± SEM and analyzed by GraphPad Prism 9.0. Each dot represents one person in (A-F) and (H). Adjusted p-values are shown in (B-F) and (H).
Figure 2.
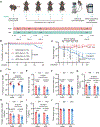
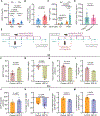
Figure 2.. Alternate day fasting exacerbates doxorubicin-induced mortality and cachexia.
(A) Chow-fed C57BL/6 mice (n=107) were randomized to adlib or ADF and treated with vehicle or Dox (5 mg/kg IP × 4 doses), followed by body composition analysis before euthanasia, as shown in the schematic. (B) Pooled survival probability in mice from (A) (n=15–39/group; log-rank test, p-value is shown on the graph). (C) Longitudinal trajectory of body weights throughout the experiment in mice from (A), all measurements are after 24 hours of feeding in ADF groups (n=5–10/group; mixed-effects analysis with Sidak’s correction for multiple comparisons, adjusted p-values for adlib-Dox vs ADF-Dox at individual time points are shown on the graph). (D) Body weight % change in mice from (A) (n=15–35/group; two-way ANOVA with Sidak’s correction for multiple comparisons). (E) Body fat content in mice from (A) was obtained after 5 weeks on the diet intervention, measured after a feeding day by EchoMRI (n=8–20/group; two-way ANOVA with Sidak’s correction for multiple comparisons). (F) Lean mass in mice from (A) was obtained after 5 weeks on the diet intervention, measured after a feeding day by EchoMRI (n=8–20/group; two-way ANOVA with Sidak’s correction for multiple comparisons). (G) Heart weight/tibia length in mice from (A) (n=15–35/group; two-way ANOVA with Sidak’s correction for multiple comparisons). (H) Tibialis anterior muscle weight/tibia length in mice from (A) (n=5–17/group; two-way ANOVA with Sidak’s correction for multiple comparisons). (I) Calf muscle (gastrocnemius and soleus) weight/ tibia length in mice from (A) (n=5–17/group; two-way ANOVA with Sidak’s correction for multiple comparisons). (J) Tibia length in mice from (A) (n=15–35/group; two-way ANOVA with Sidak’s correction for multiple comparisons, no significant difference). All mice were sacrificed on a fed day. All data are presented as mean ± SEM and analyzed by GraphPad Prism 9.0. Each dot represents one mouse in (D-J). Adjusted p-values are shown in (C-I).
Figure 3.
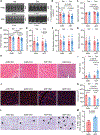
Figure 3.. Alternate day fasting potentiates cardiotoxicity in doxorubicin-treated mice.
(A) C57BL/6 mice were randomized to adlib or ADF and treated with vehicle or Dox (5 mg/kg IP × 4 doses) and underwent echocardiography. Representative 2-dimensional-directed M-mode echocardiographic images are shown. (B) Echocardiographic left ventricular (LV) mass/tibia length in mice from (A) (n=10–25/group; two-way ANOVA with Sidak’s correction for multiple comparisons). (C) Ejection fraction in mice from (A) (n=10–25/group; two-way ANOVA with Sidak’s correction for multiple comparisons). (D) Heart rate in mice from (A) (n=10–25/group; two-way ANOVA with Sidak’s correction for multiple comparisons). (E) Cardiac output in mice from (A) (n=10–25/group; two-way ANOVA with Sidak’s correction for multiple comparisons). (F) End diastolic volume in mice from (A) (n=10–25/group; two-way ANOVA, p>0.05). (G) Stroke volume in mice from (A) (n=10–25/group; two-way ANOVA with Sidak’s correction for multiple comparisons). (H) Representative images of mid-myocardial sections from mice randomized to adlib or ADF and treated with vehicle or Dox stained with Masson’s trichrome (scale bar=100 μm). (I) Blinded quantification of fibrosis from (H) (n=5–8/group; two-way ANOVA with Sidak’s correction for multiple comparisons). (J) Representative images of mid-myocardial sections from mice randomized to adlib or ADF and treated with vehicle or Dox stained with wheat germ agglutinin (WGA) (scale bar=25 μm). (K) Blinded cell size quantification from (J) (n=4/group; two-way ANOVA with Sidak’s correction for multiple comparisons). (L) Representative images of TUNEL staining from mid-myocardial sections of mice randomized to adlib or ADF and treated with vehicle or Dox followed (scale bar=50 μm; black triangles show TUNEL+ nuclei). (M) Blinded quantification of TUNEL+ nuclei from (L) (n=4/group; Student’s t-test, p-value is shown on the graph). All echocardiography was performed on a fed day. (B-G) were obtained by quantification of blinded echocardiographic assessment (under 2% Avertin, IP) of 2-dimensional images. All data are presented as mean ± SEM and analyzed by GraphPad Prism 9.0. Adjusted p-values are shown in (B-G), (I) and (K). Each dot represents one mouse in (B-G), (I), (K) and (M).
Figure 4.
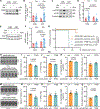
Figure 4.. Alternate day fasting stimulates myocardial TFEB nuclear translocation, which is sufficient to exacerbate mortality in doxorubicin treated mice.
(A) C57BL/6J mice were randomized to adlib or ADF and were treated with vehicle or Dox (5 mg/kg IP × 4 doses) and sacrificed on a fed day. Representative images of immunoblots for TFEB from nuclear myocardial protein lysates are shown, histone H3 serves as a loading control. (B) Quantification of (A) (n=5–10/group, two-way ANOVA with Sidak’s correction for multiple comparisons). (C) Myocardial protein lysates were prepared from mice in (A). Representative images of immunoblots for p-mTORSer2448 and mTOR are shown, β-tubulin serves as a loading control. (D) Quantification of (C) (n=5–10/group, two-way ANOVA with Sidak’s correction for multiple comparisons). (E) Myocardial protein lysates were prepared from mice in (A). Representative images of immunoblots for MuRF1 are shown, β-tubulin serves as a loading control. (F) Quantification of (E) (n=4/group, two-way ANOVA with Sidak’s correction for multiple comparisons). (G) Survival probability of C57BL/6J mice injected with AAV9-CMV-null or AAV9-CMV-TFEB (3.5 × 10¹¹ particles/mouse injected via tail vein) and treated with vehicle or Dox (5 mg/kg IP × 4 doses, n=5/group; log-rank test). (H) Representative 2-dimensional-directed M-mode echocardiographic images 24 days after viral injection of AAV9-CMV-null or AAV9-CMV-TFEB and vehicle control. (I) Ejection fraction in mice from (H) (n=5/group, Student’s t-test). (J) LV mass in mice from (H) (n=5/group, Student’s t-test). (K) LV mass/tibia length in mice from (H) (n=5/group, Student’s t-test). (L) End-diastolic volume in mice from (H) (n=5/group, Student’s t-test, no significant difference). (M) Representative 2-dimensional-directed M-mode echocardiographic images of Dox-treated mice from a second AAV9-CMV-null and TFEB experiment that was modeled due to the extreme mortality in the first experiment (G). Mice underwent echocardiography at early timepoints after Dox (5 mg/kg IP × 3 doses, with 2 doses given prior to viral injection). (N) Ejection fraction in mice from (M) (n=5–10/group, Mann-Whitney test). (O) Echocardiographic LV mass in mice from (M) (n=5–10/group, Student’s t-test, no significant difference). (P) LV mass/tibia length in mice from (M) (n=5–10/group, Student’s t-test, no significant difference). (Q) End-diastolic volume in mice from (M) (n=5–10/group, Student’s t-test). All echocardiography was performed on a fed day. (I-L) and (N-Q) were obtained by quantification of blinded echocardiographic assessment (under 2% Avertin, IP) of 2-dimensional images. All data are presented as mean ± SEM and analyzed by GraphPad.
Figure 5.
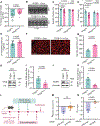
Figure 5.. Cardiomyocyte-specific TFEB knockout and AAV9-induced TFEB knockdown alleviated doxorubicin-induced atrophy.
(A) % change in body weight in cardiomyocyte-specific TFEB knockout (TFEBCMKO) and TFEB flox (TFEBflox) littermate mice treated with Dox (5 mg/kg IP × 2 doses; n=9–24/group; Student’s t-test). (B) Representative two-dimensional-directed M-mode echocardiographic images in mice from (A). (C) Ejection fraction in TFEBCMKO and TFEBflox littermate mice treated with vehicle (control) or Dox (5 mg/kg IP × 2 doses; n=8–24/group; two-way ANOVA with Sidak’s correction for multiple comparisons). (D) Echocardiographic left ventricular (LV) mass in mice from (C) (n=8–24/group; two-way ANOVA with Sidak’s correction for multiple comparisons). (E) Echocardiographic LV mass/tibia length in Dox-treated mice from (C) (n=9–24/group; Student’s t-test). (F) Representative images of mid-myocardial sections from Dox-treated mice in (C), stained with wheat germ agglutinin (WGA) (scale bar=25 μm). (G) Blinded cell size quantification from (F) (n=5–6/group; Student’s t-test). (H) Nuclear myocardial protein lysates were prepared from mice in (A). Representative images of immunoblots for TFEB are shown, histone H3 serves as a loading control. (I) Quantification of (H) (n=6–7/group; Mann-Whitney test). (J) Myocardial protein lysates were prepared from mice in (A). Representative images of immunoblots for MuRF1 are shown, β-tubulin serves as a loading control. (K) Quantification of (H) (n=7/group; Student’s t-test with Welch’s correction). (L) C57BL/6J mice were injected with AAV9-shScramble or AAV9-shTFEB (3.5 × 10¹¹ particles/mouse injected via tail vein) and treated with doxorubicin (5 mg/kg IP × 2 doses; n=5/group) with echocardiography baseline at 1 week after post-virus injections and follow-up at 1 week after second doxorubicin treatment, as shown in the schematic. (M) Absolute change of ejection fraction from baseline in each mouse from (J) at week 2 (Student’s t-test). (N) Absolute change of LV mass from baseline in each mouse from (J) at week 2 (Student’s t-test). All echocardiography was performed on a fed day. (C-E) and (M-N) were obtained by quantification of blinded echocardiographic assessment (under 2% Avertin, IP) of 2-dimensional images. All data are presented as mean ± SEM and analyzed by GraphPad Prism 9.0. Adjusted P-values are shown in (C-D). P-values are shown in (A), (E), (G), (I), (K), (M) and (N). Each dot represents one mouse in (A), (C-E), (G), (I), (K) and (M-N).
Figure 6.
Figure 6.. TFEB increases GDF15, which is sufficient to reduce LV mass in mice.
(A) GDF15 plasma concentrations in C57BL/6J mice randomized to adlib or ADF and treated with vehicle or Dox (5 mg/kg IP × 4 doses) (n=10–19/group; two-way ANOVA with Sidak’s correction for multiple comparisons). (B) GDF15 fold-change in mice from (A) (n=10–19/group; Student’s t-test). (C) GDF15 plasma concentrations in mice from AAV9-CMV-null vs AAV9-CMV-TFEB viral transduction experiments from Figure 4H–4Q (n=5–8/group; two-way ANOVA with Sidak’s correction for multiple comparisons were used to analyze log transformed data, since residuals violated normality assumptions). (D) Plasma GDF15 from cardiomyocyte-specific TFEB knockout (TFEBCMKO) and TFEB flox (TFEBflox) littermate mice treated with Dox (n=8–23/group; Student’s t-test). (E) In one experiment, chow-fed C57BL/6J mice were randomized to receive saline injection plus vehicle control (4 mM HCl) or saline injection plus GDF15 (0.3 mg/kg × 6 doses SQ) (n=3/group). In a second experiment, mice received Dox (5 mg/kg IP) plus control (4 mM HCl) or Dox plus GDF15 (0.3 mg/kg SQ × 6 doses) (n=5/group), as shown in the schematic. (F) Plasma GDF15 levels in saline-treated mice from (E) (n=3/group; Student’s t-test). (G) % change in body weight in saline-treated mice from (E) (n=3/group; Student’s t-test). (H) Heart weight/tibia length in saline-treated mice from (E) (n=3/group; Student’s t-test). (I) Echocardiographic left ventricular (LV) mass/tibia length in saline-treated mice from (E) (n=3/group; Student’s t-test). (J) Plasma GDF15 levels in Dox-treated mice from (E) (n=4–5/group; Student’s t-test). (K) % change in body weight in Dox-treated mice from (E) (n=5/group; Student’s t-test with Welch’s correction). (L) Heart weight/tibia length in Dox-treated mice from (E) (n=5/group; Student’s t-test). (M) Echocardiographic left ventricular (LV) mass/tibia length in Dox-treated mice from (E) (n=5/group; Student’s t-test). All echocardiography was performed on a fed day. (I) and (M) were obtained by quantification of blinded echocardiographic assessment (under 2% Avertin, IP) of 2-dimensional images. All data are presented as mean ± SEM and analyzed by GraphPad Prism 9.0. Adjusted P-values are shown on (A) and (C). P-values are shown on (B), (D), (F-M). Each dot represents one mouse in (A-D) and (F-M).
Figure 7.
Figure 7.. LV mass, but not LV ejection fraction, correlates with stroke volume in mice and survivors of childhood cancers treated with doxorubicin.
(A) Correlation of stroke volume vs LV ejection fraction in C57BL/6 saline-treated mice randomized to adlib or ADF with echocardiographic data (n=20, Pearson correlation coefficient (r) and p-value are shown on the graph). (B) Correlation of stroke volume vs LV mass in mice from (A) (n=20, Pearson correlation coefficient (r) and p-value are shown on the graph). (C) Correlation of stroke volume vs LV ejection fraction in C57BL/6 doxorubicin-treated mice randomized to adlib or ADF with echocardiographic data (n=48, Pearson correlation coefficient (r) and p-value are shown on the graph). (D) Correlation of stroke volume vs LV mass in mice from (C) (n=48, Pearson correlation coefficient (r) and p-value are shown on the graph). (E) Correlation of stroke volume vs LV ejection fraction in survivors of childhood cancers treated with anthracyclines (n=29, Pearson correlation coefficient (r) and p-value are shown on the graph). (F) Correlation of stroke volume vs LV mass in humans from (E) (n=29, Pearson correlation coefficient (r) and p-value are shown on the graph). Mouse echocardiography was performed on a fed day. (A-D) were obtained by quantification of blinded echocardiographic assessment (under 2% Avertin, IP) of 2-dimensional images. (E-F) were obtained by cardiac MRI and calculated from EKG-gated steady-state free precession (SSFP). All data were analyzed by GraphPad Prism 9.0. Each dot represents one mouse or one person.

Comment in

References

    1. Li DL, Wang ZV, Ding G, Tan W, Luo X, Criollo A, Xie M, Jiang N, May H, Kyrychenko V, et al. (2016). Doxorubicin Blocks Cardiomyocyte Autophagic Flux by Inhibiting Lysosome Acidification. Circulation 133, 1668–1687. 10.1161/CIRCULATIONAHA.115.017443. - DOI - PMC - PubMed
    1. Ma X, Mani K, Liu H, Kovacs A, Murphy JT, Foroughi L, French BA, Weinheimer CJ, Kraja A, Benjamin IJ, et al. (2019). Transcription Factor EB Activation Rescues Advanced alphaB-Crystallin Mutation-Induced Cardiomyopathy by Normalizing Desmin Localization. J Am Heart Assoc 8, e010866. 10.1161/JAHA.118.010866. - DOI - PMC - PubMed
    1. Liu H, Javaheri A, Godar RJ, Murphy J, Ma X, Rohatgi N, Mahadevan J, Hyrc K, Saftig P, Marshall C, et al. (2017). Intermittent fasting preserves beta-cell mass in obesity-induced diabetes via the autophagy-lysosome pathway. Autophagy 13, 1952–1968. 10.1080/15548627.2017.1368596. - DOI - PMC - PubMed
    1. Cheng CW, Villani V, Buono R, Wei M, Kumar S, Yilmaz OH, Cohen P, Sneddon JB, Perin L, and Longo VD (2017). Fasting-Mimicking Diet Promotes Ngn3-Driven beta-Cell Regeneration to Reverse Diabetes. Cell 168, 775–788 e712. 10.1016/j.cell.2017.01.040. - DOI - PMC - PubMed
    1. Godar RJ, Ma X, Liu H, Murphy JT, Weinheimer CJ, Kovacs A, Crosby SD, Saftig P, and Diwan A (2015). Repetitive stimulation of autophagy-lysosome machinery by intermittent fasting preconditions the myocardium to ischemia-reperfusion injury. Autophagy 11, 1537–1560. 10.1080/15548627.2015.1063768. - DOI - PMC - PubMed

Publication types

Substances