. 2023 Mar 13;58(5):348-360.e6.
doi: 10.1016/j.devcel.2023.02.003. Epub 2023 Mar 2.

Endothelial and Leptin Receptor+ cells promote the maintenance of stem cells and hematopoiesis in early postnatal murine bone marrow

Affiliations

Endothelial and Leptin Receptor+ cells promote the maintenance of stem cells and hematopoiesis in early postnatal murine bone marrow

Nergis Kara et al. Dev Cell. .

Abstract

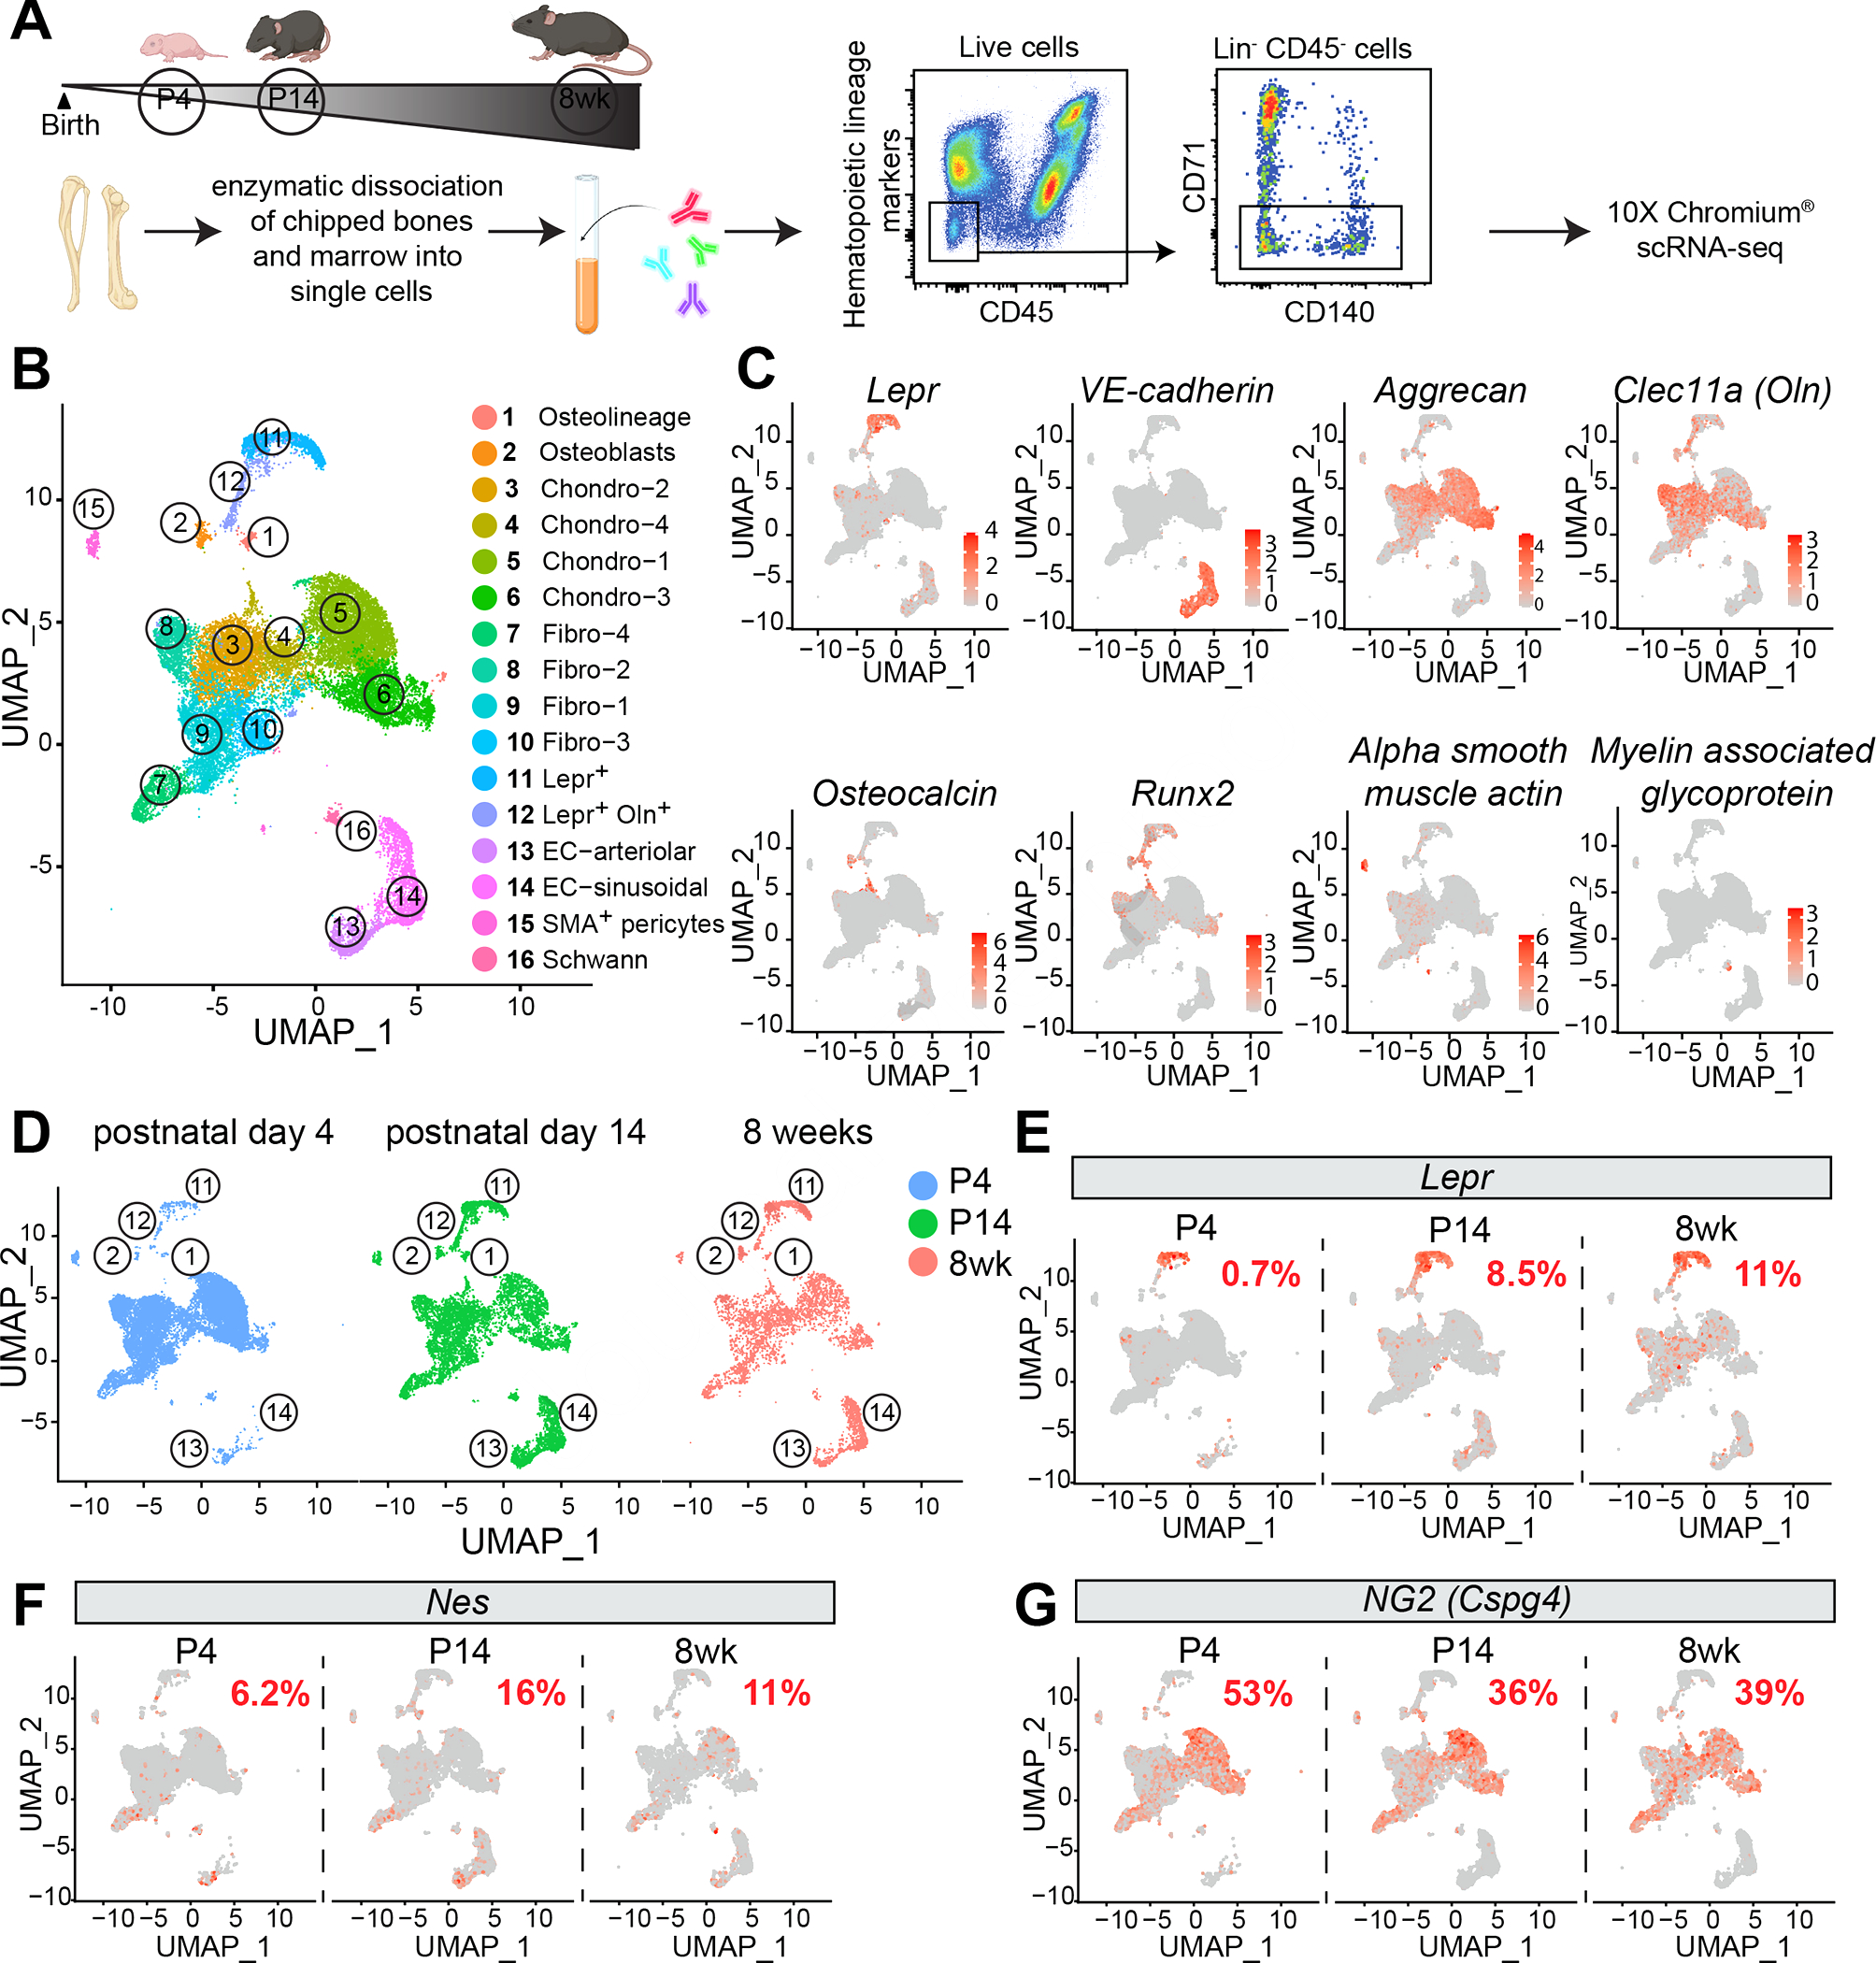
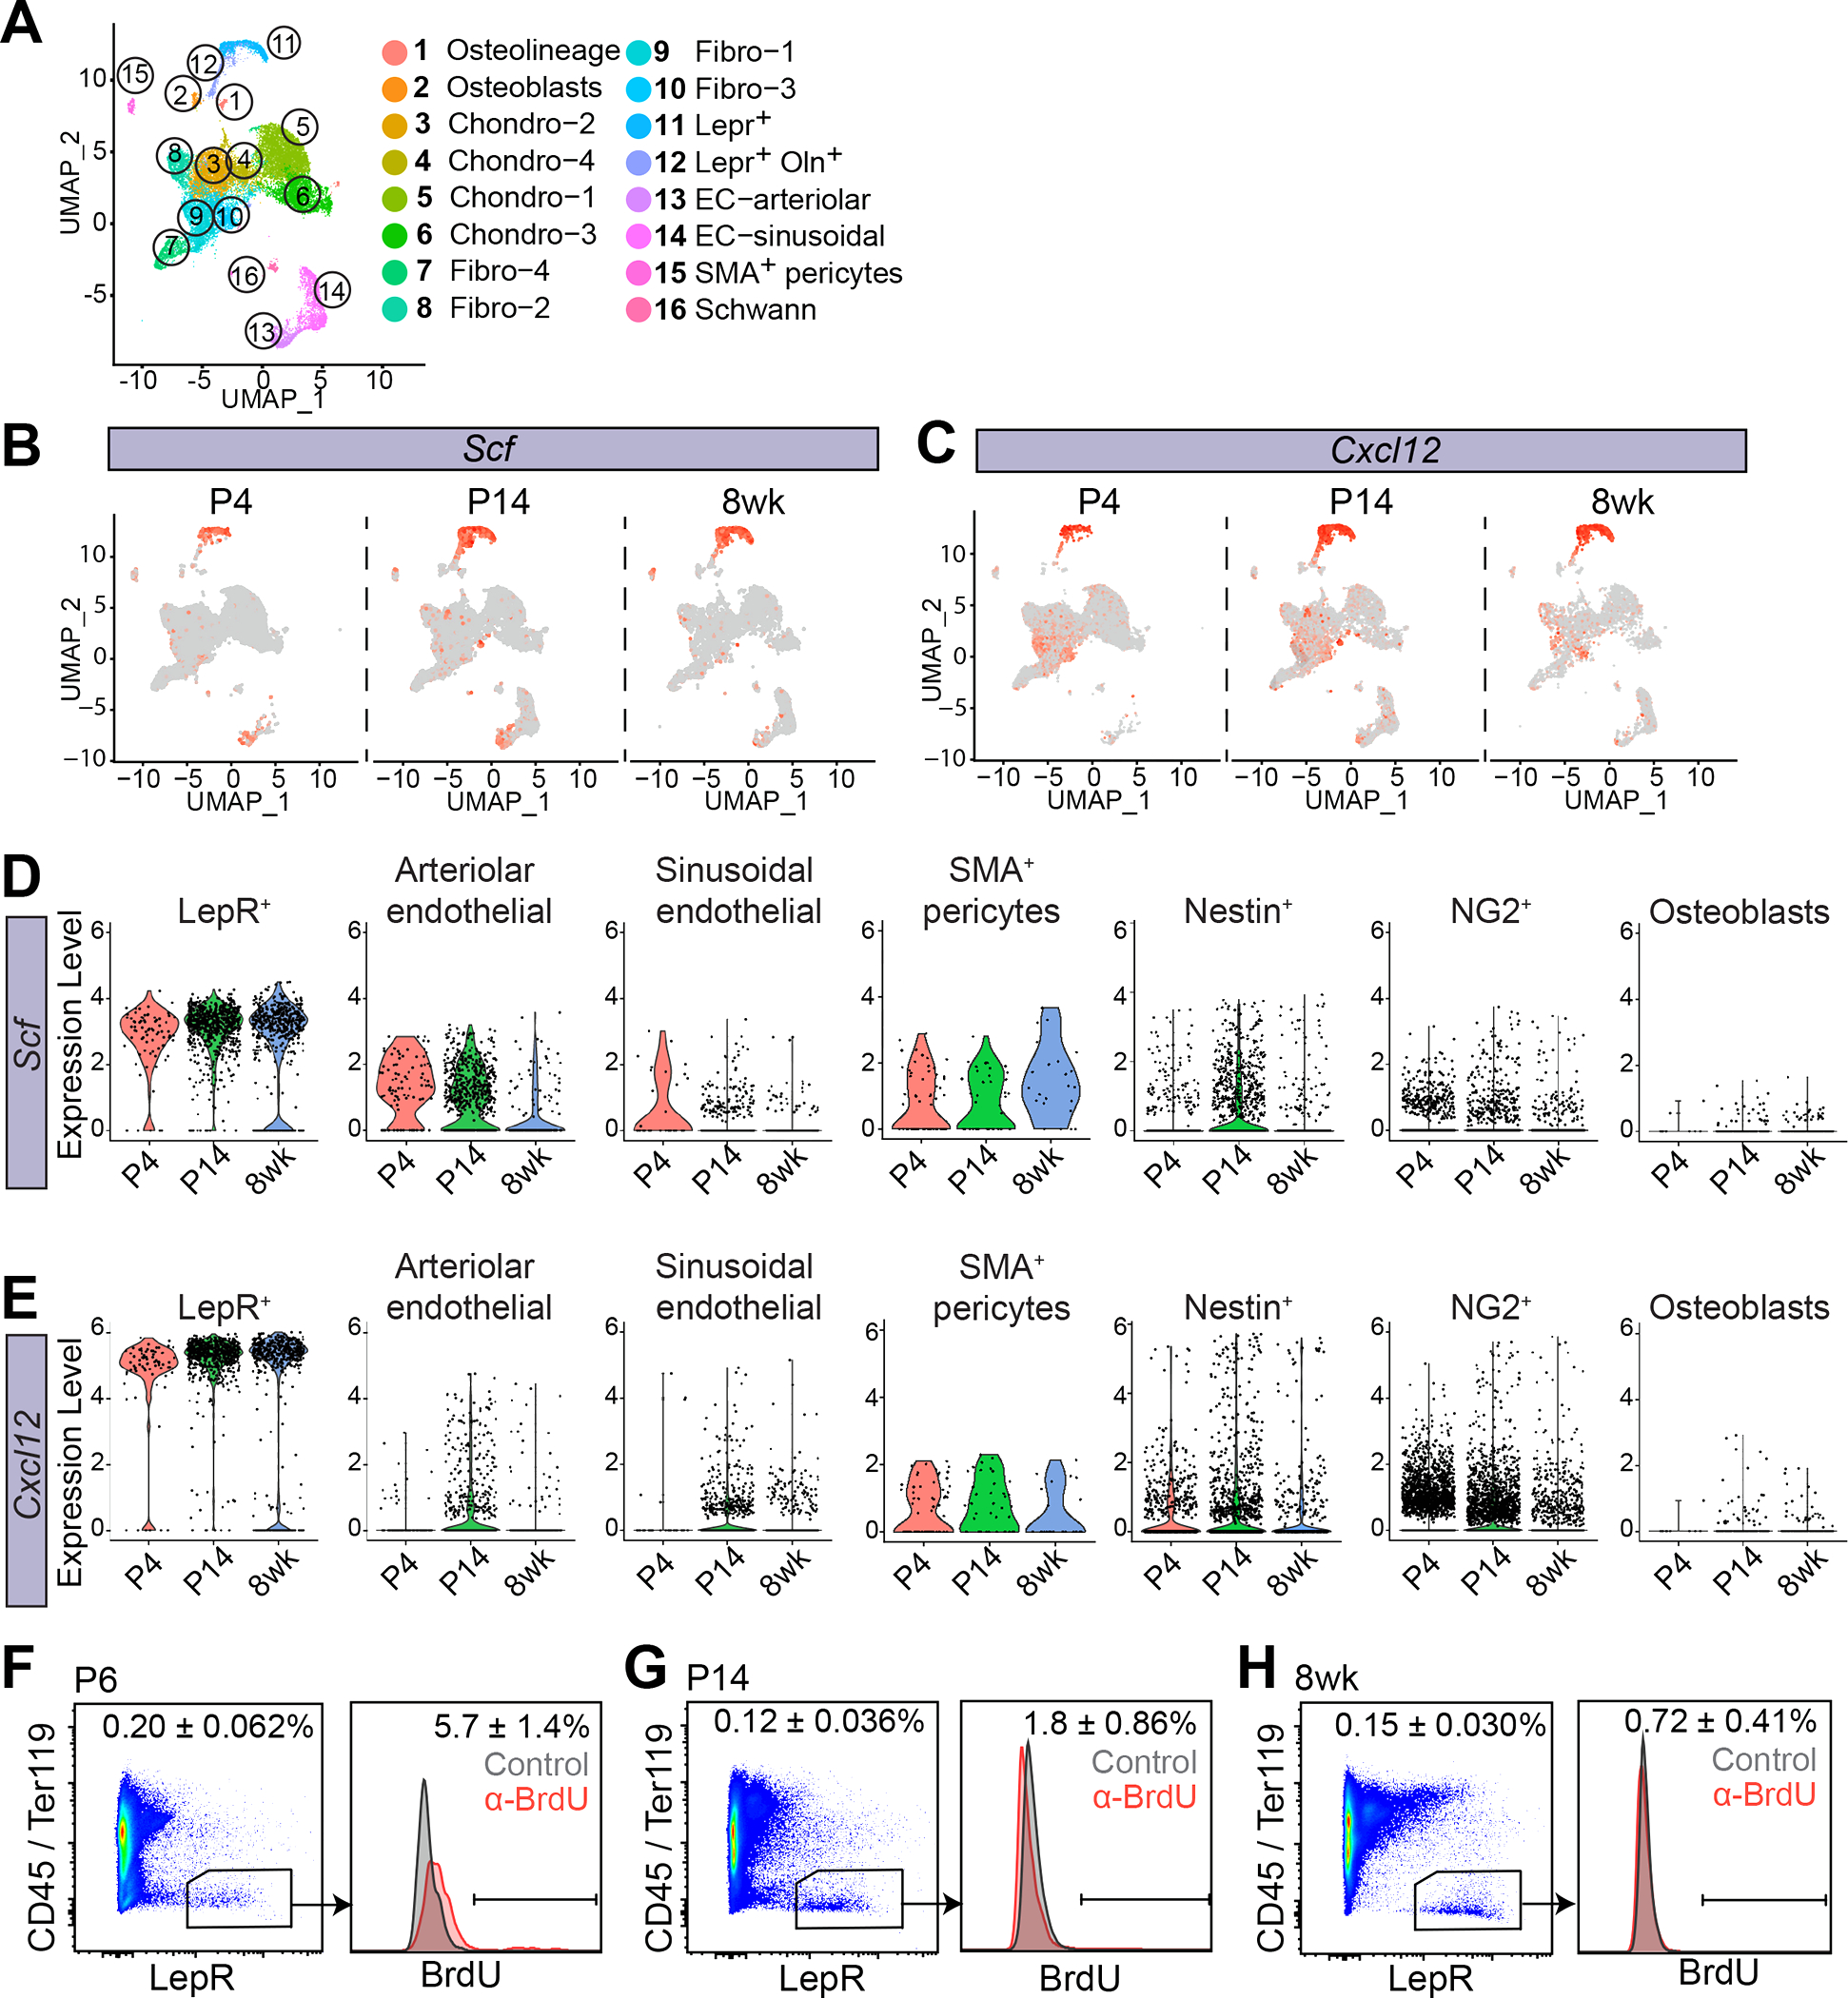
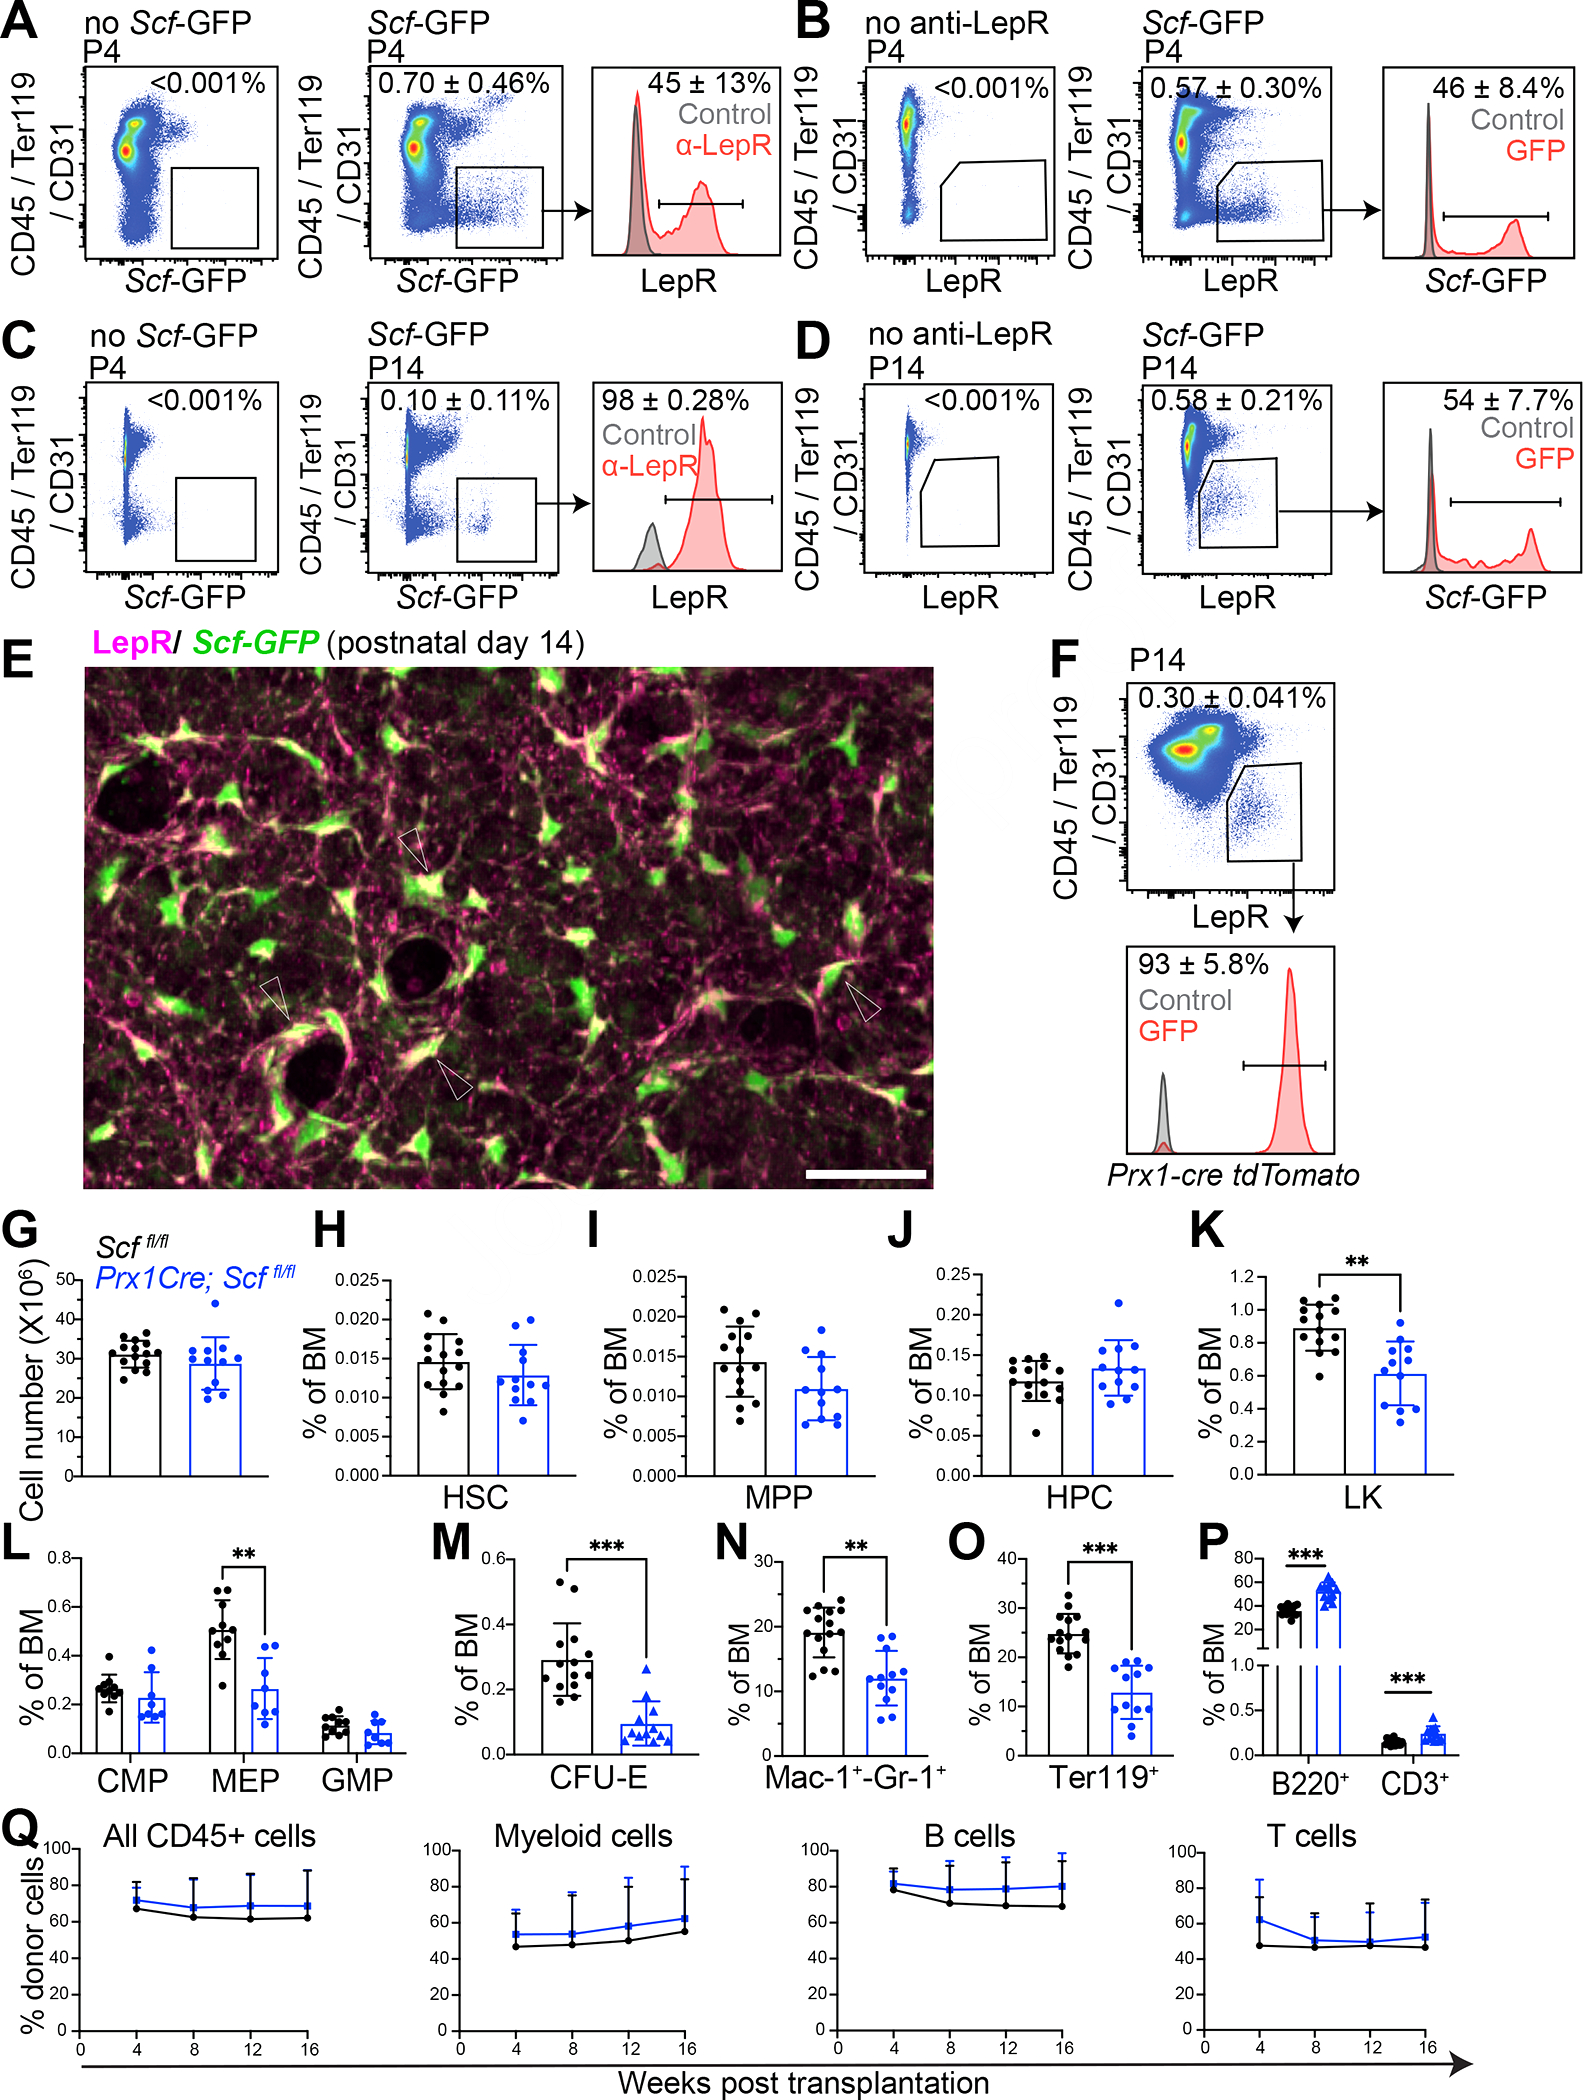
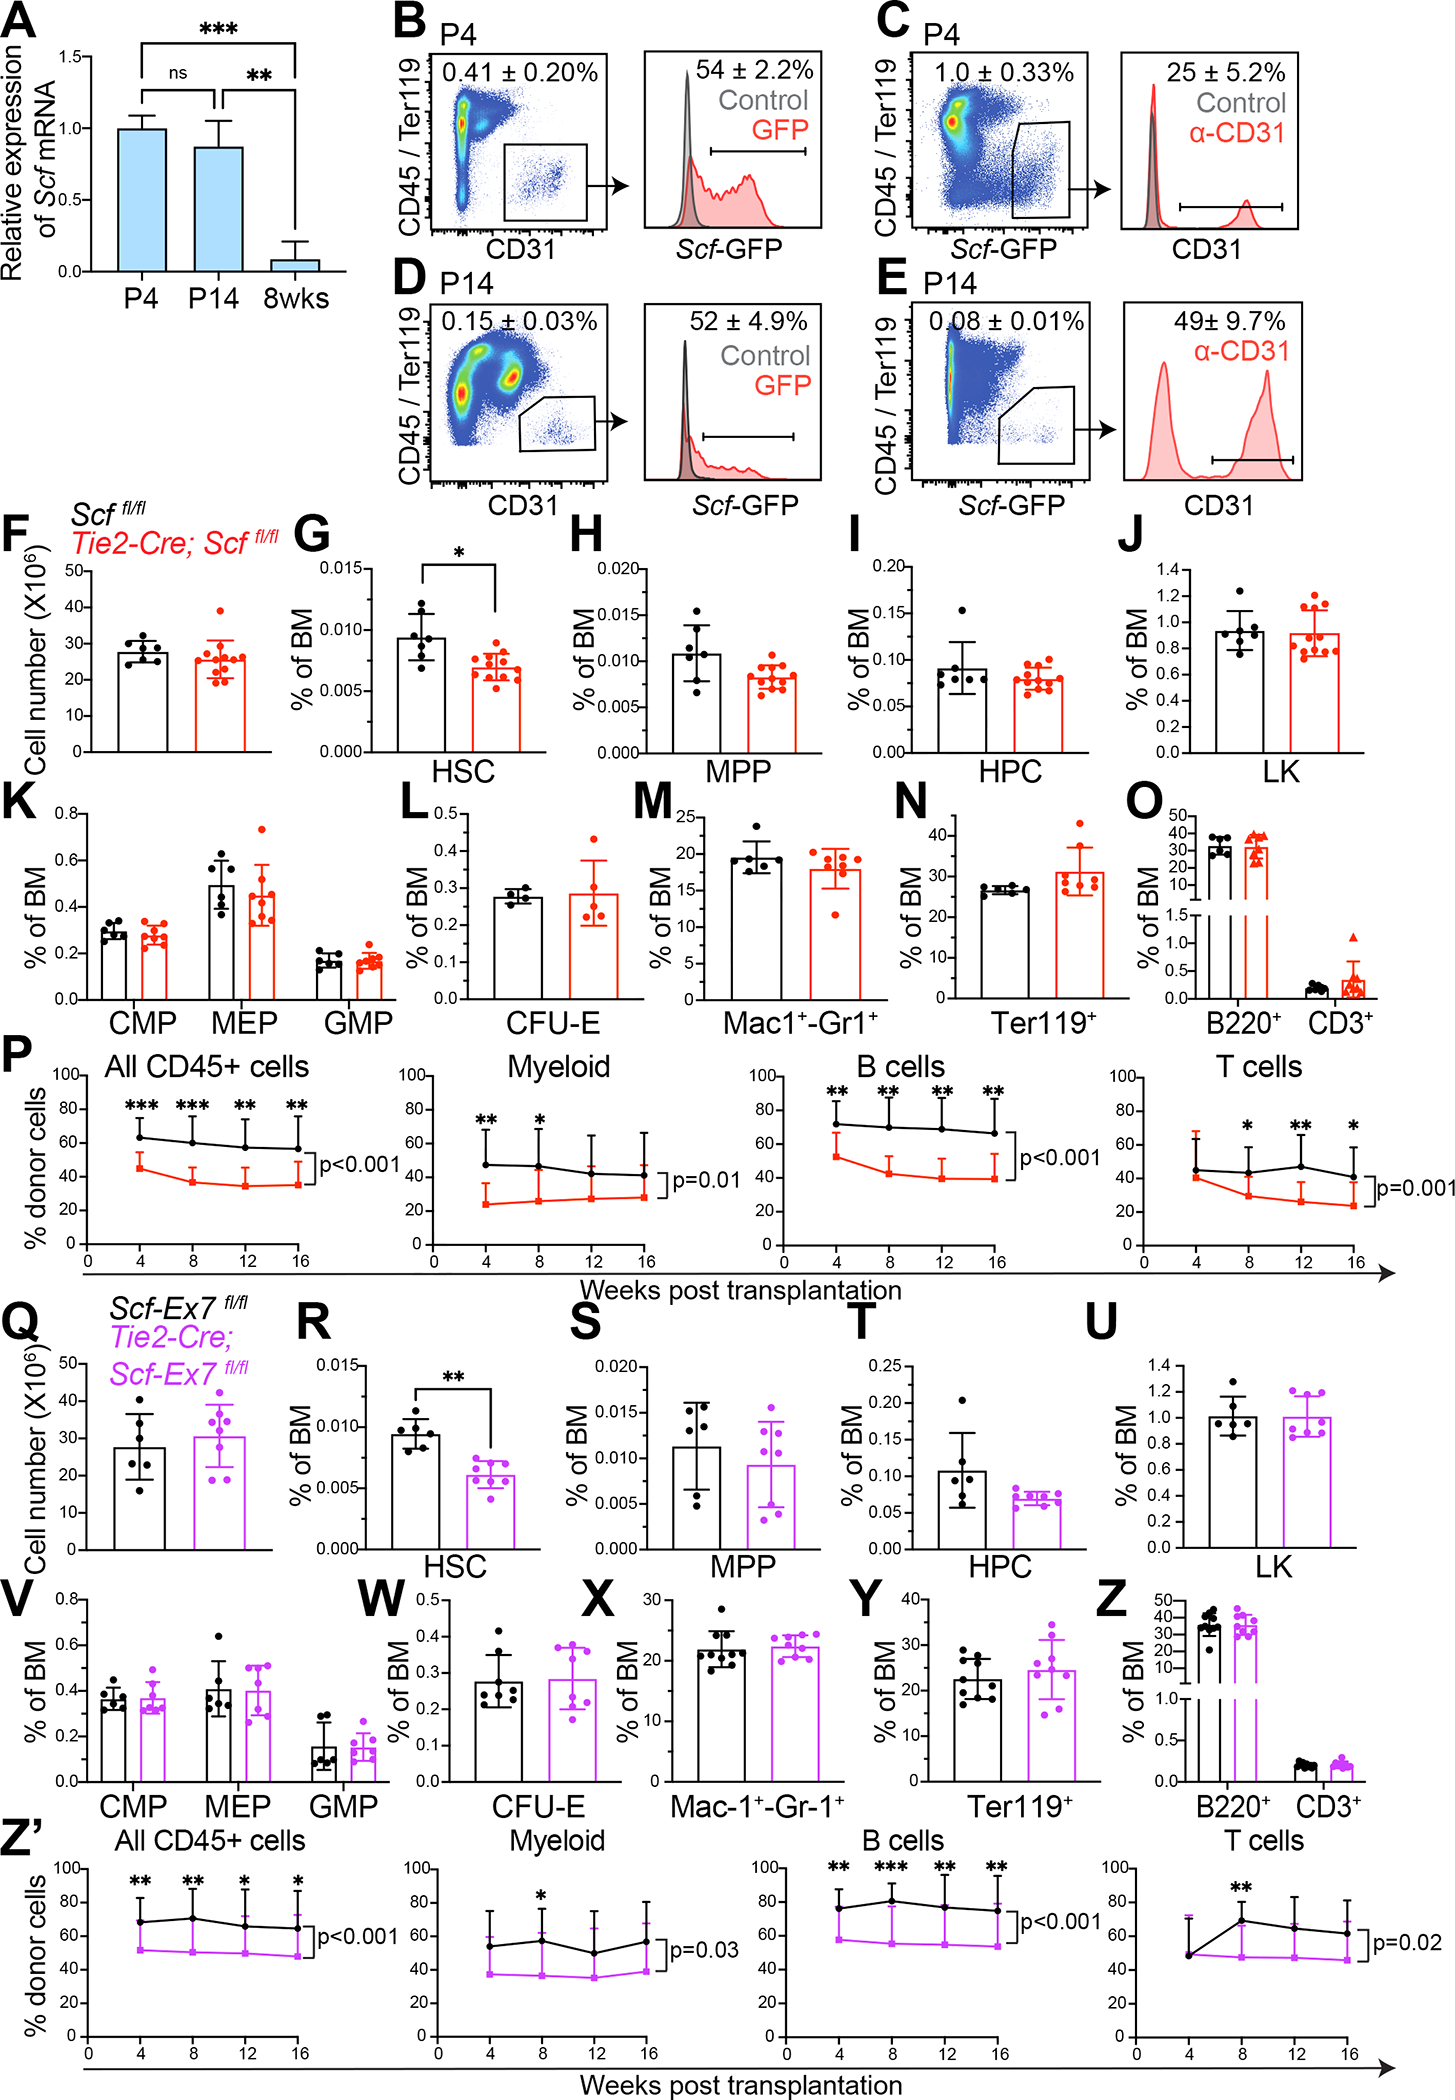
Mammalian hematopoietic stem cells (HSCs) colonize the bone marrow during late fetal development, and this becomes the major site of hematopoiesis after birth. However, little is known about the early postnatal bone marrow niche. We performed single-cell RNA sequencing of mouse bone marrow stromal cells at 4 days, 14 days, and 8 weeks after birth. Leptin-receptor-expressing (LepR+) stromal cells and endothelial cells increased in frequency during this period and changed their properties. At all postnatal stages, LepR+ cells and endothelial cells expressed the highest stem cell factor (Scf) levels in the bone marrow. LepR+ cells expressed the highest Cxcl12 levels. In early postnatal bone marrow, SCF from LepR+/Prx1+ stromal cells promoted myeloid and erythroid progenitor maintenance, while SCF from endothelial cells promoted HSC maintenance. Membrane-bound SCF in endothelial cells contributed to HSC maintenance. LepR+ cells and endothelial cells are thus important niche components in early postnatal bone marrow.

Keywords: erythropoiesis; myelopoiesis; niche; stem cell factor; stromal cells.


Conflict of interest statement

Declaration of interests The authors declare no competing interests.

Figures

Figure 1.
Figure 1.. Single cell RNA sequencing of non-hematopoietic cells from early postnatal and adult mouse bone and bone marrow.
(A) Experimental design and flow cytometry gates used to isolate endothelial cells (CD140 negative) and stromal cells (CD140+) that were negative for CD45, CD71, and hematopoietic lineage markers from enzymatically dissociated P4, P14, or 8 week-old femurs and tibias. The mouse images were derived from BioRender. (B) Uniform manifold approximation and projection (UMAP) plot showing cell clusters from analysis of 23,657 non-hematopoietic cells from enzymatically dissociated P4, P14, and 8 week-old bones/bone marrow. (C) UMAP plots for the expression of genes that mark bone marrow stromal cell types listed in panel B. (D) UMAP plots of cells from P4, P14 and 8 week-old bones/bone marrow. (E-G) UMAP plots showing the expression of Lepr (E), Nestin (F), and NG2 (Cspg4) (G) in stromal cells from P4, P14 and 8 week-old bones/bone marrow. The percentages in panels E to G represent the mean percentages of cells that were positive for the indicated transcripts. See also Figure S1, S2, S3 and Table S1.
Figure 2.
Figure 2.. Expression patterns of Scf and Cxcl12 niche factors by single cell RNA sequencing in non-hematopoietic cells from early postnatal and adult bone/bone marrow.
(A) UMAP visualization of all non-hematopoietic cell clusters from P4, P14 and 8 week-old bones/bone marrow. (B, C) UMAP plots showing Scf (B) and Cxcl12 (C) expression. (D, E) Violin plots showing the expression patterns of Scf (D) and Cxcl12 (E) in Lepr+ stromal cells, arteriolar and sinusoidal endothelial cells, SMA+ pericytes, Nestin+ stromal cells, NG2+ stromal cells and osteoblasts from P4, P14 and 8 week-old bones/bone marrow. (F-H) Incorporation of a 2 hour pulse of BrdU by LepR+ cells from enzymatically dissociated bone/bone marrow from P6 (F), P14 (G) and 8-week-old mice (H) (a total of 5–6 mice per time point from 2 independent experiments per time point). All data reflect mean±standard deviation. See also Figure S3.
Figure 3.
Figure 3.. SCF from LepR+ cells promotes myelopoiesis and erythropoiesis in early postnatal marrow.
(A-D) Analysis of enzymatically dissociated tibia and femur from Scf-GFP mice at P4 (A, B) and P14 (C, D) (a total of 5 mice per time point from 2 independent experiments per time point). The first panels in A and C are from negative control bone marrow lacking Scf-GFP. The other panels show the percentage of Scf-GFP+ stromal cells (negative for CD45, Ter119 and CD31) that were LepR+ at P4 (A) and P14 (C). Panels B and D show the percentage of LepR+ cells that were Scf-GFP+ at P4 (B) and P14 (D) (the first panel is a negative control lacking anti-LepR antibody staining). (E) Image of P14 femur bone marrow showing that most LepR+ cells were Scf-GFP+ (arrowheads point to LepR+Scf-GFP+ cells; representative of two independent experiments). (F) Flow cytometric analysis of Tomato expression by LepR+ bone marrow cells from Prx1-cre; tdTomato mice at P14 (representative of 3 mice from 2 independent experiments). (G-P) Bone marrow (two femurs and two tibias) cellularity (G) as well as the frequencies of HSCs (H), MPPs (I), HPCs (J), LK myeloid progenitors (K), CMPs, MEPs, GMPs (L), CFU-Es (M), Mac-1+Gr-1+ myeloid cells (N), Ter119+ erythroid cells (O), B220+ B cells and CD3+ T cells (P) in the bone marrow of Prx1-cre; Scf fl/fl and littermate control mice at P14 (n=8–15 mice per genotype from 6 independent experiments; each dot represents a different mouse). (Q) Donor-derived reconstitution in the blood of mice competitively transplanted with Prx1-cre; Scf fl/fl or control donor bone marrow cells (2 donors per genotype were transplanted into a total of 10 recipients per genotype in two independent experiments). All data represent mean ± standard deviation. *p<0.05; **p<0.01; ***p<0.001 from Welch’s t-test (G), Student’s t-tests followed by Holm-Sidak multiple comparisons adjustments (H-P), Student’s t-tests or Mann-Whitney tests followed by Holm-Sidak multiple comparisons adjustments and non-parametric analysis of longitudinal data, nparLD (Q). All statistical tests were two-sided. See also Figure S4, S5, S6, Table S2 and Table S3.
Figure 4.
Figure 4.. SCF from endothelial cells promotes HSC maintenance in early postnatal bone marrow.
(A) Quantitative RT-PCR (qRT-PCR) analysis of Scf levels in CD45Ter119CD31+ endothelial cells from P4, P14 and 8 week-old bone marrow. Data were normalized to Scf levels at P4 (n=6–9 mice per time point from 3 independent experiments per time point). (B-E) Flow cytometric analysis of Scf-GFP expression by endothelial cells from enzymatically dissociated femurs and tibias from P4 (B, C) and P14 (D, E) mice (n=5–6 mice per time point from 2–3 independent experiments per time point). (F-O) Bone marrow (two femurs and two tibias) cellularity (F) as well as the frequencies of HSCs (G), MPPs (H), HPCs (I), LK myeloid progenitors (J), CMPs, MEPs, GMPs (K), CFU-Es (L), Mac-1+Gr-1+ myeloid cells (M), Ter119+ erythroid cells (N), B220+ B cells and CD3+ T cells (O) in the bone marrow of Tie2-cre; Scf fl/fl and littermate control mice at P14 (n=4–12 mice per genotype from 3–4 independent experiments). (P) Donor-derived cells in the blood of mice competitively transplanted with Tie2-cre; Scf fl/fl or control donor bone marrow cells (3 donors per genotype were transplanted into a total of 15 recipients per genotype in three independent experiments). (Q-Z) Bone marrow (two femurs and two tibias) cellularity (Q) as well as the frequencies of HSCs and restricted hematopoietic progenitors (R-Z) in the bone marrow of Tie2-cre; Scf-Ex7 fl/fl and littermate control mice at P14 (n=6–10 mice per genotype from 3 independent experiments). (Z’) Donor-derived cells in the blood of mice competitively transplanted with Tie2-cre; Ex7-Scf fl/fl or control donor bone marrow cells (4 donors per genotype were transplanted into a total of 18 recipients per genotype in four independent experiments). All data represent mean ± standard deviation. The statistical significance of differences among groups (*p<0.05; **p<0.01; ***p<0.001) was assessed using a one-way ANOVA followed by Tukey’s multiple comparisons adjustments (A), Student’s t-tests (F, Q), Mann-Whitney tests followed by Holm-Sidak’s multiple comparisons adjustments (G-O; R-Z), Student’s t-tests or Mann-Whitney tests followed by Holm-Sidak multiple comparisons adjustments (P, Z’), or non-parametric analysis of longitudinal data, nparLD (P, Z’). All statistical tests were two-sided. See also Figure S6, Table S2 and Table S3.

Similar articles

Cited by

References

    1. Bertrand JY, Chi NC, Santoso B, Teng S, Stainier DY, and Traver D (2010). Haematopoietic stem cells derive directly from aortic endothelium during development. Nature 464, 108–111. 10.1038/nature08738. - DOI - PMC - PubMed
    1. Boisset JC, van Cappellen W, Andrieu-Soler C, Galjart N, Dzierzak E, and Robin C (2010). In vivo imaging of haematopoietic cells emerging from the mouse aortic endothelium. Nature 464, 116–120. 10.1038/nature08764. - DOI - PubMed
    1. Kissa K, and Herbomel P (2010). Blood stem cells emerge from aortic endothelium by a novel type of cell transition. Nature 464, 112–115. 10.1038/nature08761. - DOI - PubMed
    1. Mikkola HK, and Orkin SH (2006). The journey of developing hematopoietic stem cells. Development 133, 3733–3744. 10.1242/dev.02568. - DOI - PubMed
    1. Kiel MJ, Yilmaz OH, Iwashita T, Yilmaz OH, Terhorst C, and Morrison SJ (2005). SLAM family receptors distinguish hematopoietic stem and progenitor cells and reveal endothelial niches for stem cells. Cell 121, 1109–1121. 10.1016/j.cell.2005.05.026. - DOI - PubMed

Publication types

LinkOut - more resources