. 2023 Feb;27(1):3-21.
doi: 10.1055/s-0043-1761612. Epub 2023 Mar 3.

Advances in Bone Marrow Imaging: Strengths and Limitations from a Clinical Perspective

Affiliations

Advances in Bone Marrow Imaging: Strengths and Limitations from a Clinical Perspective

Charbel Mourad et al. Semin Musculoskelet Radiol. 2023 Feb.

Abstract

Conventional magnetic resonance imaging (MRI) remains the modality of choice to image bone marrow. However, the last few decades have witnessed the emergence and development of novel MRI techniques, such as chemical shift imaging, diffusion-weighted imaging, dynamic contrast-enhanced MRI, and whole-body MRI, as well as spectral computed tomography and nuclear medicine techniques. We summarize the technical bases behind these methods, in relation to the common physiologic and pathologic processes involving the bone marrow. We present the strengths and limitations of these imaging methods and consider their added value compared with conventional imaging in assessing non-neoplastic disorders like septic, rheumatologic, traumatic, and metabolic conditions. The potential usefulness of these methods to differentiate between benign and malignant bone marrow lesions is discussed. Finally, we consider the limitations hampering a more widespread use of these techniques in clinical practice.


Conflict of interest statement

None declared.

Figures
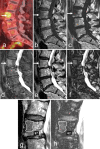
Fig. 1
Fig. 1
A 74-year-old woman with ovarian adenocarcinoma. ( a ) Sagittal reformat of fused fluorodeoxyglucose positron emission tomography/computed tomography images showing focal uptake in L3 vertebral body (arrow; maximum standardized update value  = 6). Sagittal ( b ) T1-weighted, ( c ) fat-only, ( d ) water-only, ( e, g ) in-phase, and ( f, h ) out-of-phase T2-weighted Dixon images. The lesion (arrows) contains fat with a drop in signal intensity of 36%, suggestive of a non–marrow-replacing lesion. ( g ) Note the low signal intensity on the non–fat-suppressed image that concurs with benign nodular marrow hyperplasia. The lesion was unchanged on subsequent follow-up studies.
Fig. 2
Fig. 2
A 34-year-old man with axial spondyloarthropathy. Coronal oblique ( a ) water-only and ( b ) fat-only images of a single T2-weighted Dixon show bone marrow edema-like signal intensity (a, white asterisks), subchondral erosions (a, arrows), and fat metaplasia (b, arrows). The T2-weighted Dixon technique enables accurate depiction of signs of disease activity and structural bone changes in a single acquisition.
Fig. 3
Fig. 3
An 82-year-old man with nontraumatic back pain. Sagittal ( a ) T1-weighted, ( b ) in-phase, ( c ) water-only, and ( d ) fat-onlyT2-weighted Dixon images show a recent vertebral compression fracture (VCF) of T12 with an intravertebral horizontal fluid-filled cleft (b, c, arrow) in favor of a benign VCF. However, the vertebral body did not show any residual fat (d), and there was no signal drop on out-of-phase images ( e ), suggestive of a marrow-replacing lesion. In view of the discordance, a vertebral biopsy was performed (not shown) that was negative for malignancy. ( g ) Sagittal reformat of computed tomography (CT) images show sclerotic changes in the posterior third of the vertebral body (arrow) and gas-containing cleft (arrowhead) as sources of false-positive findings on quantitative analysis of Dixon imaging. Follow-up fluorodeoxyglucose positron emission tomography/CT was negative for malignancy (not shown). Of importance, regions of interest should exclude fluid-filled regions to avoid false-positive results ( f ).
Fig. 4
Fig. 4
A 65-year-old man with newly diagnosed rectal cancer referred for staging by magnetic resonance imaging (MRI) of the abdomen and pelvis. Transverse ( a ) diffusion-weighted image (DWI) (b = 600) and ( b ) corresponding apparent diffusion coefficient (ADC) map and ( c ) T1-weighted images show a diffuse increased signal of the marrow on DWI (a, asterisk) with restricted diffusion (ADC value: 0.62 ×10 –3 mm 2 /s) and normal T1 (c, asterisk). Known aneurysms of the iliac arteries treated by endovascular treatment (arrows). Transverse T1-weighted gradient-echo ( d ) in-phase and ( e ) out-of-phase images performed in the routine protocol of the abdomen show a 68% signal drop, indicating residual fat in keeping with marrow hyperplasia. The patient had severe anemia (Hb: 6.1 mg/dL).
Fig. 5
Fig. 5
A 29-year-old man with pyogenic spondylodiskitis. ( a ) Sagittal fat-suppressed T2-weighted image shows T8–T9 spondylodiskitis with a spread of the infection to the prevertebral soft tissues (arrow). Sagittal left paramedian ( b ) fat-suppressed T2-weighted diffusion-weighted image (DWI) (b = 700) and apparent diffusion coefficient map show a phlegmon involving the paravertebral soft tissues (asterisk) with areas of restricted diffusion ( c, d, arrows) corresponding to (micro)abscesses. DWI can be useful to detect soft tissue abscesses if intravenous contrast injection is contraindicated.
Fig. 6
Fig. 6
A 12-year-old girl with painless progressive kyphosis. Sagittal ( a ) diffusion-weighted image (DWI) (b = 500) and ( b ) corresponding apparent diffusion coefficient (ADC) map, ( c ) transverse contrast-enhanced fat-suppressed T1-weighted images, and ( d ) coronal T2-weighted images show abnormal restricted diffusion of T12 and L1 vertebrae (asterisks) with epidural extension (b, arrow) and paravertebral peripherally enhancing collections with low T2 rim (c, d, arrows). The patient was found to have tuberculous spondylitis. The usefulness of ADC values in differentiating malignancy from infection is not consistent (courtesy of Joseph El-Khalil, MD, Beyrouth, Lebanon).
Fig. 7
Fig. 7
A 53-year-old man with fever and back pain and suspicion of spondylodiskitis on computed tomography (CT) (not shown). Sagittal ( a ) T1-weighted, ( b ) fat-suppressed T2-weighted, ( c ) contrast-enhanced T1-weighted, ( d ) diffusion-weighted image (DWI) (b = 500), and ( e ) corresponding apparent diffusion coefficient (ADC) map show marrow replacement of T2 and L1 vertebral bodies, restricted DWI (asterisks) with an ADC value of 0.58 ×10 −3 mm 2 /s, a peripherally enhancing prevertebral collection with restricted DWI, causing scalloping of the anterior vertebral wall (thin arrows) and elevation without disruption of the anterior longitudinal ligament (a, arrowhead). The differential diagnosis included tuberculous spondylitis and lymphoma. The patient was diagnosed with Hodgkin's lymphoma on biopsy and positron emission tomography/computed tomography (not shown). There is an overlap of ADC values between malignant and infectious lesions, making the differentiation difficult based on quantitative imaging alone.
Fig. 8
Fig. 8
A 46-year-old man with left knee pain. ( a ) Coronal intermediate-weighted fat-suppressed image shows edema-like signal intensity of the lateral femoral condyle and the tibial eminence (asterisks). Two types of coronal color-coded dual-energy computed tomography reconstructions are displayed: ( b ) virtual non-calcium and ( c ) virtual non-hydroxyapatite, showing the influence of postprocessing. There are false positives (arrows) and false negatives (arrowhead) (b).
Fig. 9
Fig. 9
A 54-year-old man with a history of previous right tibial fracture and suspicion of osteomyelitis. Anterior planar images were acquired at ( a ) 4 hours and ( b ) 24 hours after intravenous injection of mouse monoclonal 99m-technetium-antigranulocyte antibodies showing focal accumulation of leukocytes in the right tibial diaphysis (arrow). ( c ) Coronal fused single-photon emission computed tomography/computed tomography images confirmed that the uptake corresponds to the site of the previous tibial fracture (arrow).
Fig. 10
Fig. 10
( a ) Anterior planar image of the whole body acquired 4 hours after intravenous injection of mouse monoclonal 99m-technetium (Tc)-antigranulocyte antibodies showing a normal distribution pattern of the radiotracer in a 37-year-old patient. Note the distribution of the radiotracer in the axial skeleton and the absence of uptake in the appendicular skeleton, paralleling the normal red marrow distribution in adults. ( b ) Anterior planar image of the whole body acquired 4 hours after intravenous injection of mouse monoclonal 99m-Tc-antigranulocyte antibodies in a 75-year-old man with metastatic prostate cancer, showing an intense abnormal uptake in the appendicular skeleton (arrows), together with the absence of uptake in the axial skeleton as compared with the normal pattern in (a). Bone marrow hyperplasia in the peripheral skeleton has occurred as a consequence of diffuse marrow replacement by metastases in the axial skeleton.

References

    1. Geith T, Schmidt G, Biffar A. Comparison of qualitative and quantitative evaluation of diffusion-weighted MRI and chemical-shift imaging in the differentiation of benign and malignant vertebral body fractures. AJR Am J Roentgenol. 2012;199(05):1083–1092. - PubMed
    1. Zajick D C, Jr, Morrison W B, Schweitzer M E, Parellada J A, Carrino J A. Benign and malignant processes: normal values and differentiation with chemical shift MR imaging in vertebral marrow. Radiology. 2005;237(02):590–596. - PubMed
    1. Schmeel F C, Luetkens J A, Wagenhäuser P J. Proton density fat fraction (PDFF) MRI for differentiation of benign and malignant vertebral lesions. Eur Radiol. 2018;28(06):2397–2405. - PubMed
    1. Colombo A, Bombelli L, Summers P E. Effects of sex and age on fat fraction, diffusion-weighted image signal intensity and apparent diffusion coefficient in the bone marrow of asymptomatic individuals: a cross-sectional whole-body MRI study. Diagnostics (Basel) 2021;11(05):913. - PMC - PubMed
    1. Kirchgesner T, Perlepe V, Michoux N, Larbi A, Vande Berg B. Fat suppression at 2D MR imaging of the hands: Dixon method versus CHESS technique and STIR sequence. Eur J Radiol. 2017;89:40–46. - PubMed