. 2023;15(6):1391-1419.
doi: 10.1016/j.jcmgh.2023.02.014. Epub 2023 Mar 2.

Mimicking Tumor Cell Heterogeneity of Colorectal Cancer in a Patient-derived Organoid-Fibroblast Model

Affiliations

Mimicking Tumor Cell Heterogeneity of Colorectal Cancer in a Patient-derived Organoid-Fibroblast Model

Velina S Atanasova et al. Cell Mol Gastroenterol Hepatol. 2023.

Abstract

Background & aims: Patient-derived organoid cancer models are generated from epithelial tumor cells and reflect tumor characteristics. However, they lack the complexity of the tumor microenvironment, which is a key driver of tumorigenesis and therapy response. Here, we developed a colorectal cancer organoid model that incorporates matched epithelial cells and stromal fibroblasts.

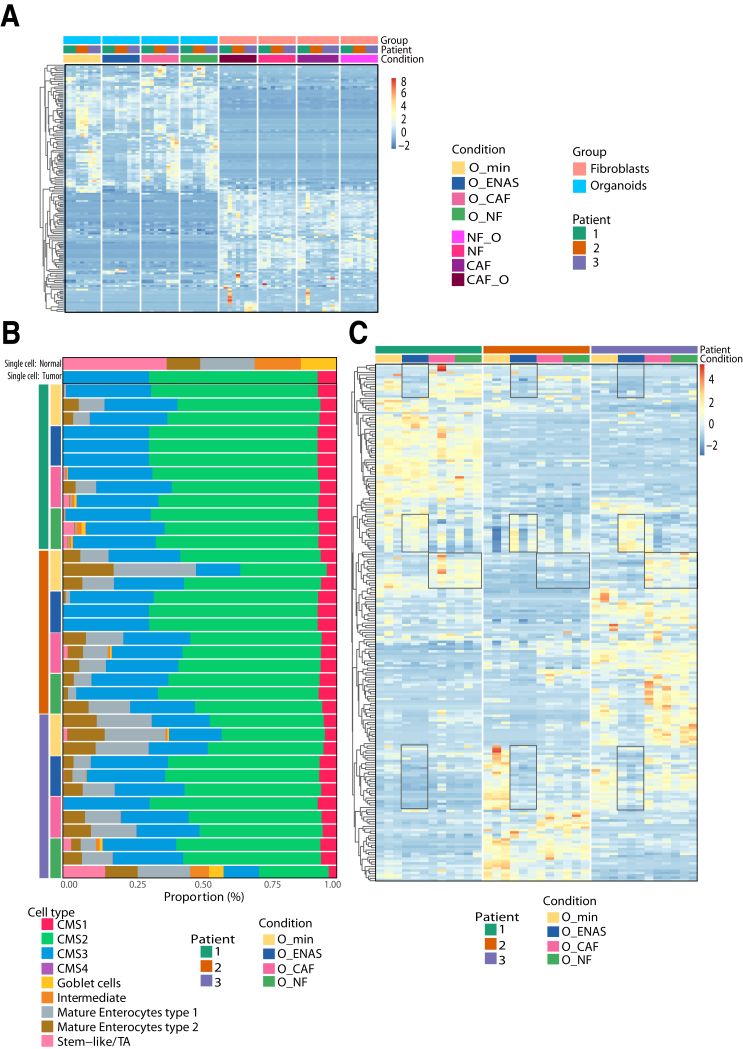
Methods: Primary fibroblasts and tumor cells were isolated from colorectal cancer specimens. Fibroblasts were characterized for their proteome, secretome, and gene expression signatures. Fibroblast/organoid co-cultures were analyzed by immunohistochemistry and compared with their tissue of origin, as well as on gene expression levels compared with standard organoid models. Bioinformatics deconvolution was used to calculate cellular proportions of cell subsets in organoids based on single-cell RNA sequencing data.

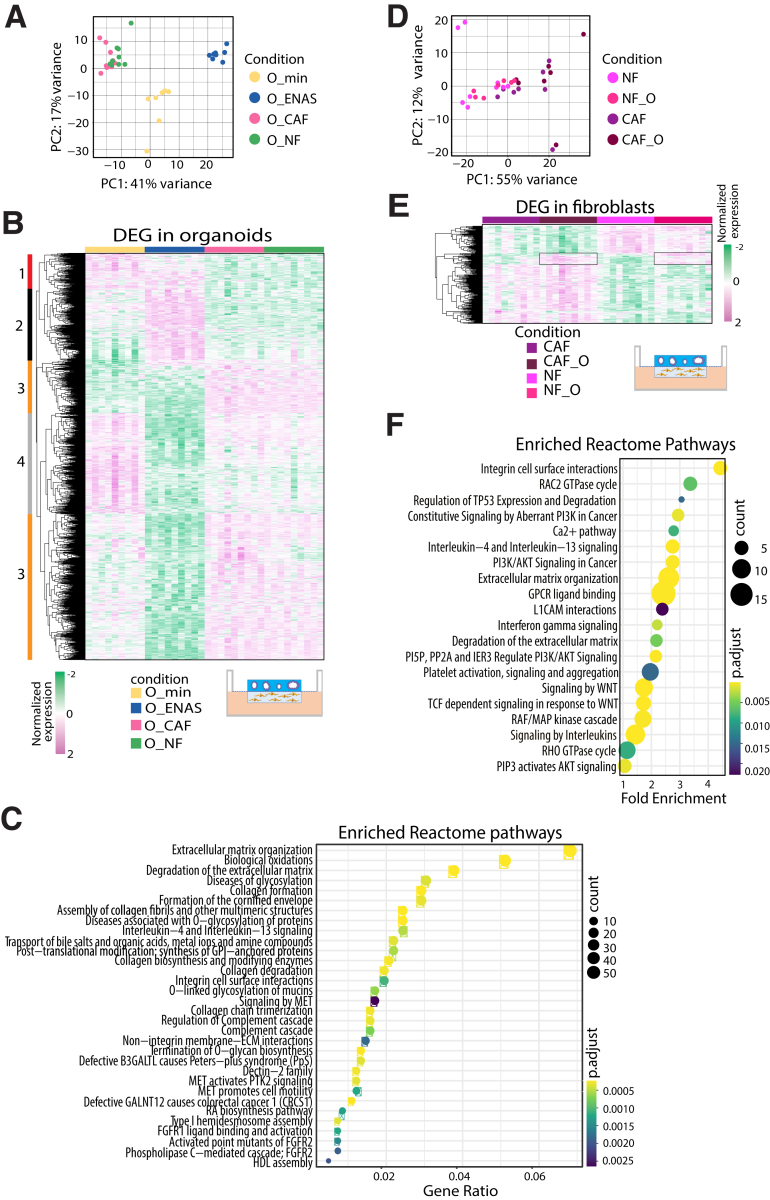
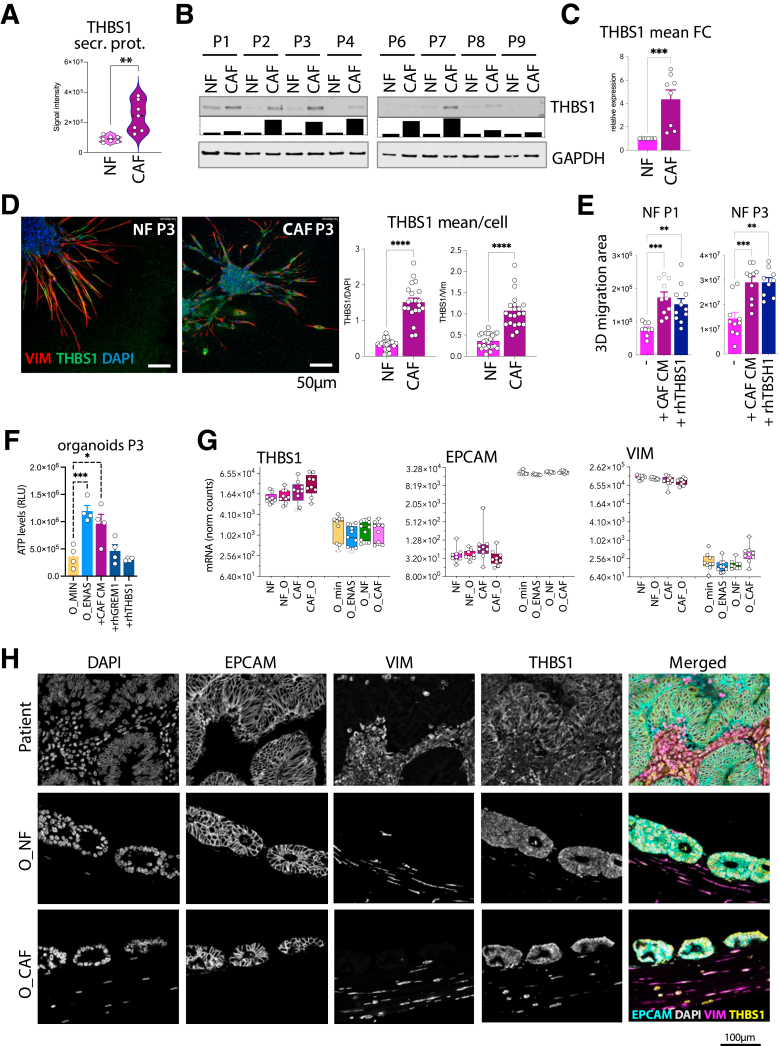
Results: Normal primary fibroblasts, isolated from tumor adjacent tissue, and cancer associated fibroblasts retained their molecular characteristics in vitro, including higher motility of cancer associated compared with normal fibroblasts. Importantly, both cancer-associated fibroblasts and normal fibroblasts supported cancer cell proliferation in 3D co-cultures, without the addition of classical niche factors. Organoids grown together with fibroblasts displayed a larger cellular heterogeneity of tumor cells compared with mono-cultures and closely resembled the in vivo tumor morphology. Additionally, we observed a mutual crosstalk between tumor cells and fibroblasts in the co-cultures. This was manifested by considerably deregulated pathways such as cell-cell communication and extracellular matrix remodeling in the organoids. Thrombospondin-1 was identified as a critical factor for fibroblast invasiveness.

Conclusion: We developed a physiological tumor/stroma model, which will be vital as a personalized tumor model to study disease mechanisms and therapy response in colorectal cancer.

Keywords: Cancer; Co-cultures; Colorectal Cancer; Fibroblasts; Organoids.


Figures

None
Graphical abstract
Figure 1
Figure 1
Molecular and phenotypic differences of NFs and CAFs. (A) NFs and CAFs as well as PDOs are isolated from colon tumors or normal adjacent mucosa. PDOs together with either NFs or CAFs are cultured in different co-culture models containing either Matrigel alone or with collagen I as supportive matrices. Individual setups were used for molecular analyses as indicated (right). (B) Hierarchical clustering of significantly differentially expressed proteins between 4 individual pairs of NFs and CAFs as analyzed by label free MS/MS (P < .05, absolute log2 fold change ≥1) (C) Bubble chart describes 20 of the top significant pathways detected by Reactome pathway analysis of differentially expressed proteins. The size of the circles corresponds to the number of proteins changed in the respective pathway. Adjusted P values are indicated by different colors according to the color gradient. (D) Protein intensity values of significantly differentially secreted proteins between 7 matched NF and CAF pairs as analyzed by human proteome profiler assays (∗P < .05, ∗∗P < .005, unpaired 2-tailed Student's t test). (E) Western blot analysis of molecules upregulated in CAFs vs NFs identified by proteomics. Graphs underneath show quantification of the blots by imageJ. Bar graphs indicate fold mean changes compared with the individual NFs (∗P < .05, ∗∗∗P < .001, unpaired 2-tailed Student's t test).
Figure 2
Figure 2
Fibroblasts morphology in a collagen gel motility assay. (A) Microscopic pictures of matched NFs and CAFs isolated from 3 individual patients embedded as spheroids into collagen I for 24 hours. Illustration in lower panel of patient 1 shows method of quantification of the sprouting area, number of protrusions, and single cells in CAFs vs NFs. (B) Violin plots show measurements of the sprouting area (total area minus spheroid core area), number of protrusions, and number of single cells detached from the spheroids in the 3 individual patients. Experiments were performed in triplicates, and >10 individual spheroids were analyzed for each experiment (n = 30) (∗P < .05, ∗∗P < .005, ∗∗∗P < .001, 2-tailed unpaired Student's t test).
Figure 3
Figure 3
Organoid growth and morphology in co-cultures with fibroblasts. (A) Representative microscopic pictures of organoids grown in Matrigel for 7 days in minimal medium (O_min), conventional organoid medium (O_ENAS), or together with NFs (O_NF) or CAFs (O_CAF) starting from single cell suspensions. (B) On day 7, organoid diameters were measured using Fiji imaging software, and viability was analyzed using CellTiter-Glo 3D assay (n = 3 patients) in 7 to 8 technical replicates. (C) Dependence of organoid growth related to fibroblast numbers. Images on the left show growth of organoids over time and how the organoid growth area was measured. Graph on the right represents comparison of mean organoid area (from 4 frames/condition) in presence of different numbers or absence of fibroblasts (∗∗∗P < .001, ∗∗∗∗P < .0001; 2-tailed unpaired Student's t test).
Figure 4
Figure 4
Organoid morphology in co-cultures with fibroblasts. (A) Illustration on the top right displays the experimental setup. Comparison of the histo-morphology of a representative set of matched patient material and organoids grown either alone in ENAS medium or in co-culture with NFs or CAFs in minimal medium. After cultivation for 7 days, the matrices were formalin-fixed and paraffin-embedded and sectioned into 2-μm thick slices. Consecutive slices were stained with hematoxylin and eosin (H&E), Periodic acid-Schiff (PAS) stain or via immunohistochemistry with indicated antibodies (AE1-3, pan-keratin; CK20, cytokeratin 20; CDX2, differentiation marker; Ki67, proliferation marker; Fibronectin, fibroblast marker). Graphs on the right represent quantification of the images using Fiji software. A minimum of 3 images were quantified for each graph. Values presented are means ± standard deviation, ∗P < .05, ∗∗P < .005, ∗∗∗P < .001, ∗∗∗∗P < .0001; ordinary 1-way ANOVA. (B) Quantification of immunohistochemichal stainings as in (A) for 2 additional matched patient/organoid sets. (C) Quantification of intensity of CK20 staining for one patient shown in (B), ++ high, + medium and ± low intensity. Data are mean values ± standard deviation. (D) PAS stain of patient 2 tumor tissue and the matched organoid/CAF co-culture, indicating mucus production in both the tumor tissue and organoid culture without the presence of goblet-like cells.
Figure 5
Figure 5
Gene expression analysis of tumor organoids and fibroblasts. (A) PCA plot of organoid samples grown in minimal medium (O_min), conventional organoid medium (O_ENAS), or together with NFs (O_NF) or CAFs (O_CAF) plotted in 2 dimensions using their projections onto the first 2 principal components based on RNA-seq data. The different conditions are color coded. (B) Hierarchical clustering of significantly differentially expressed genes in organoids grown in different conditions as in (A) as identified from RNA-seq analyses. Numbers and colors on the left of the heatmap indicate 4 different groups of genes that were upregulated in O_min (1, red), upregulated in O_ENAS (2, black), upregulated in the co-cultures O_NF and O_CAF (3, orange), or downregulated in O_ENAS (4, grey). The illustration below the heatmap shows the experimental setup. (C) Reactome pathway analysis shows the top significantly altered pathways between the individual growth conditions of organoids. Size of circles defines the number of genes affected in the respective pathway and the color indicates the significance (adjusted P value) according to the color gradient shown. (D) PCA plot of fibroblasts including NFs and CAFs grown either alone (NF, CAF) or in co-culture with tumor organoids (NF_O, CAF_O) (indicated by colors) plotted in 2 dimensions using their projections onto the first 2 principal components based on RNA-seq data. (E) Hierarchical clustering of significantly differentially expressed genes of NFs and CAFs grown in different conditions as in (D). Rectangles on the heatmap mark genes that were specifically upregulated in the co-culture conditions in NFs and CAFs compared with the mono-cultures. (F) Bubble chart lists the top significantly changed pathways using Reactome pathway analysis in fibroblasts based on the different culturing conditions. The number of genes involved in the respective pathway is shown by the size of the circles and the significance by the color according to the color gradient. The RNA-seq analyses were performed in triplicates for 3 individual patients (P1‒3) (9 replicates in total) (P adj. < .05).
Figure 6
Figure 6
Validation of gene expression signatures and factor dependencies in fibroblasts. (A) RNA expression levels of selected target proteins significantly deregulated in proteome analysis between NFs and CAFs represented as violin plots. Values plotted represent normalized mRNA counts derived from RNA-seq expression analysis of matched NFs and CAFs derived from 3 individual patients. Data of NFs grown alone or together with organoids and CAFs grown alone or together with organoids from the 3 patients were combined and repeated in 3 technical replicates. (B) RNA expression levels of molecules related to factors found in the ENAS medium. Values plotted represent normalized counts as in (A). (∗P < .05, ∗∗P < .005, ∗∗∗P < .001, ∗∗∗∗P < .0001; 2-tailed unpaired Student's t test). (C) Organoid viability measured by CellTiter-Glo 3D. Organoids were treated with the EGF-receptor inhibitors erlotinib or allitinib, with the TGF-ß inhibitor A-8301 or with the p38 MAP kinase inhibitor SB202190 for 1 week.
Figure 7
Figure 7
Expression of epithelial marker genes in organoids. (A) Hierarchical clustering of normalized gene expression levels of individual marker genes derived from published scRNA-seq datasets of primary tumors, in organoids grown in minimal medium (O_min), conventional organoid medium (O_ENAS), or together with NFs (O_NF) or CAFs (O_CAF). Colored rectangles and numbers on the left indicate genes upregulated in O_min (1, red), O_ENAS (2, black), or in the co-cultures with NF and CAF (3, orange). (B) mRNA expression levels of deregulated genes, representing different biological features, identified by bulk RNA-seq of organoids in the different culture conditions as in (A). (C‒D) Validation of selected RNA-seq deregulated target genes by immunohistochemical staining. mRNA expression levels of respective genes are shown in (C). Stainings were performed on patient tissues or on the matched cultured organoids grown alone in ENAS medium or with NF (O_NF) or CAF (O_CAF) as co-culture. Antibodies against CEACAM1, TFF3, CD44, olfactomedin 4 (OLMF4) were used (D).
Figure 8
Figure 8
Expression of fibroblast marker genes. (A) Hierarchical clustering of general fibroblast, myofibroblast (myCAF), and inflammatory fibroblast (iCAF) markers (described in published scRNA-seq datasets of patient tumors,, in cultured NFs and CAFs grown alone (NF, CAF) or in co-culture with organoids (NF_O, CAF_O). (B) mRNA expression levels of differentially regulated fibroblast marker genes identified by bulk RNA-sequencing of fibroblasts. (C) Gene expression levels of TGF-ß-related genes extracted from bulk RNA-seq data as in (B).
Figure 9
Figure 9
Deconvolution of bulk RNA sequencing data based on scRNA-seq of primary CRC tumors. (A) Hierarchical clustering of bulk RNA-seq gene expression levels of 137 marker genes from Lee et al as a reference used for the deconvolution of cellular proportions of organoids and fibroblasts cultivated in the indicated combinations and media. (B) Cellular proportions of organoids grown in minimal medium (O_min), conventional organoid medium (O_ENAS), or together with NFs (O_NF) or CAFs (O_CAF), identified from deconvoluting bulk RNA-seq data using scRNA-seq of 23 patient samples (13 tumor, 10 normal) from Lee et al as a reference. We derived marker genes for normal epithelial cells including 5 sub-types (stem-like/TA, goblet cells, intermediate, mature enterocytes type 1, and mature enterocytes type 2) and from tumor cells reflecting the 4 CMS signatures (CMS1‒4). The top 2 rows in the graph display the cellular proportions of epithelial cells identified in primary normal tissues and tumors from Lee et al, respectively. Subsequent rows represent the individual epithelial and CMS proportions of the organoids grown in the respective conditions, sorted by patient (P1‒3). Different colors represent CMS1‒4 and epithelial cell sub-types. Three replicates are shown for each condition. Please note that the last row, showing a replicate of organoids grown in co-culture with NFs, has a very high proportion of epithelial-like cells, which might represent an outlier. (C) Heatmap of normalized gene expression values of marker genes used for the deconvolution of organoid cell proportions as described in (B). For each patient (P1‒3) and condition, 3 replicates are shown. Rectangles mark gene expression signatures of marker genes that are deregulated in organoids grown in ENAS compared to other conditions, or in co-cultures (O_NF, O_CAF) compared with mono-cultures.
Figure 10
Figure 10
Significant interactions of different cell types. (A) Cell-cell interaction counts identified by CellphoneDB analysis of bulk RNA-seq data of purified fibroblast and organoid epithelial cells cultured in the indicated conditions (CAF, CAF mono-culture; CAF_O, CAFs co-cultured with organoids; NF, NFs mono-culture; NF_O, NFs co-cultured with organoids; O_CAF, organoids co-cultured with CAFs; O_ENAS, organoids cultured in ENAS medium, O_min, organoids cultured in minimal medium; O_NF, organoids co-cultured with NF). (B‒D) Cell-cell interaction counts of indicated cell types inferred from published datasets.,, (E) Significant interactions inferred from bulk RNA-seq data of CAF and organoid co-cultures that overlap with fibroblast secreted factors or proteins specifically upregulated in CAFs (orange, overlap with secretome proteins; blue, overlap with CAF proteome data; darker shades additional overlap with scRNA-seq fibroblast-epithelial cell interaction pairs).
Figure 11
Figure 11
THBS1 is elevated in CAFs compared with NFs and affects NFs phenotype. (A) THBS1 levels in the secreted conditioned medium of NFs and CAFs; 7 pairs were analyzed by the Cytokine XL array. (∗∗P < .005; 2-tailed unpaired Student's t test). (B) Western blot analysis of THBS1 protein levels in CAFs compared with NFs in 8 patient pairs. Quantification is shown underneath normalized to GAPDH. Bars represent fold change CAFs to NFs. (C) Collective representation of WB analysis shown in (B) of the 8 patient NF/CAF pairs. (∗∗∗P < .001; 2-tailed unpaired Student's t test). (D) Immunofluorescence staining of THSB1 (green) in spheroids generated with NFs and CAFs. Vimentin (red) was used as a specific fibroblast marker, DAPI (blue) to stain for nuclei. (∗∗∗∗P < .0001; 2-tailed unpaired Student's t test). (E) Image analytical THBS1 quantification per cell is shown, normalized to DAPI or Vimentin expression. Each data point represents 1 cell. (∗P < .05, ∗∗P < .005, ∗∗∗P < .001; ordinary 1-way ANOVA.) (F) ATP levels as determined by CellTiter-Glo 3D viability assay after treatment of organoids for 7 days with hrTHBS1, human recombinant gremlin (hrGremlin), or CAF-CM. (∗P < .05, ∗∗∗P < .001; ordinary 1-way ANOVA.) (G) Transcript expression levels of THBS1, EPCAM, and Vimentin (VIM) in fibroblasts and organoids based on normalized counts from RNA-seq data. (H) Confocal microscopy images of tissue sections from patient formalin-fixed paraffin-embedded blocks or matched organoids/fibroblast cultures (O_NF or O_CAF). Antibodies against Vimentin (VIM, fibroblast marker), EPCAM (epithelial cell marker), or Thrombospondin 1 (THBS1) were used. DAPI was used to stain nuclei.

References

    1. Arnold M., Sierra M.S., Laversanne M., et al. Global patterns and trends in colorectal cancer incidence and mortality. Gut. 2017;66:683–691. - PubMed
    1. Marin J.J.G., Macias R.I.R., Monte M.J., et al. Cellular mechanisms accounting for the refractoriness of colorectal carcinoma to pharmacological treatment. Cancers (Basel) 2020;12:2605. - PMC - PubMed
    1. Verduin M., Hoeben A., De Ruysscher D., et al. Patient-derived cancer organoids as predictors of treatment response. Front Oncol. 2021;11 - PMC - PubMed
    1. Ooft S.N., Weeber F., Dijkstra K.K., et al. Patient-derived organoids can predict response to chemotherapy in metastatic colorectal cancer patients. Sci Transl Med. 2019;11 - PubMed
    1. Narasimhan V., Wright J.A., Churchill M., et al. Medium-throughput drug screening of patient-derived organoids from colorectal peritoneal metastases to direct personalized therapy. Clin Cancer Res. 2020;26:3662–3670. - PMC - PubMed

Publication types