. 2023 Jun;193(6):702-724.
doi: 10.1016/j.ajpath.2023.02.006. Epub 2023 Mar 1.

NEF-Induced HIV-Associated Nephropathy Through HCK/LYN Tyrosine Kinases

Affiliations

NEF-Induced HIV-Associated Nephropathy Through HCK/LYN Tyrosine Kinases

Chunyan Hu et al. Am J Pathol. 2023 Jun.

Abstract

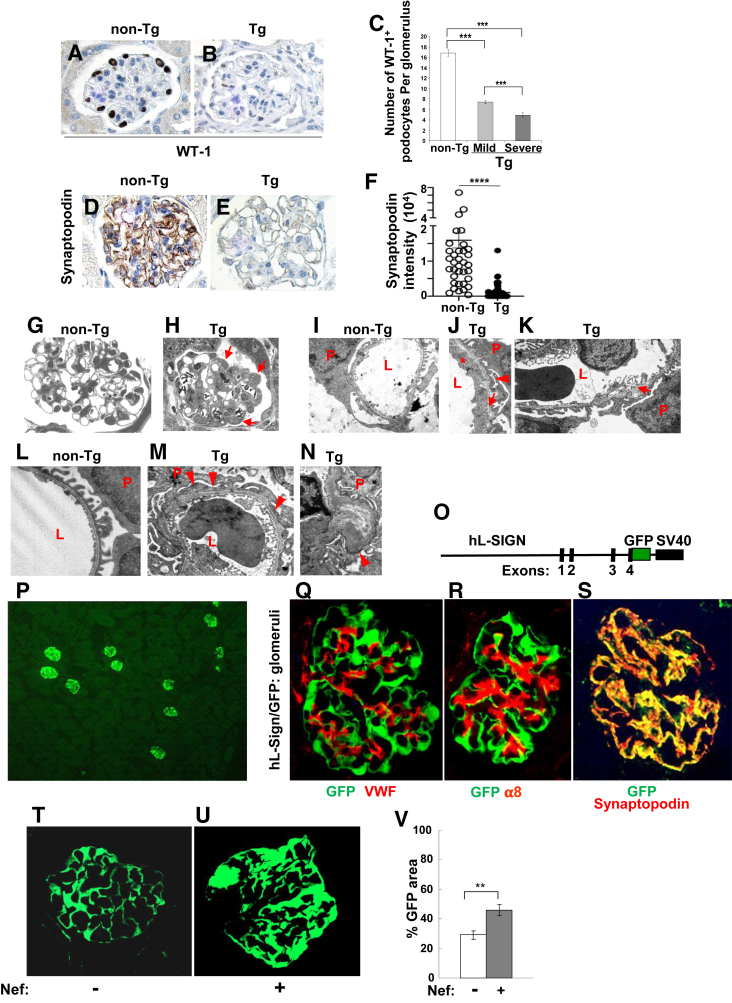
HIV-1-associated nephropathy (HIVAN) is a severe complication of HIV-1 infection. To gain insight into the pathogenesis of kidney disease in the setting of HIV, a transgenic (Tg) mouse model [CD4C/HIV-negative regulator factor (Nef)] was used in which HIV-1 nef expression is under control of regulatory sequences (CD4C) of the human CD4 gene, thus allowing expression in target cells of the virus. These Tg mice develop a collapsing focal segmental glomerulosclerosis associated with microcystic dilatation, similar to human HIVAN. To identify kidney cells permissive to the CD4C promoter, CD4C reporter Tg lines were used. They showed preferential expression in glomeruli, mainly in mesangial cells. Breeding CD4C/HIV Tg mice on 10 different mouse backgrounds showed that HIVAN was modulated by host genetic factors. Studies of gene-deficient Tg mice revealed that the presence of B and T cells and that of several genes was dispensable for the development of HIVAN: those involved in apoptosis (Trp53, Tnfsf10, Tnf, Tnfrsf1b, and Bax), in immune cell recruitment (Ccl3, Ccl2, Ccr2, Ccr5, and Cx3cr1), in nitric oxide (NO) formation (Nos3 and Nos2), or in cell signaling (Fyn, Lck, and Hck/Fgr). However, deletion of Src partially and that of Hck/Lyn largely abrogated its development. These data suggest that Nef expression in mesangial cells through hematopoietic cell kinase (Hck)/Lck/Yes novel tyrosine kinase (Lyn) represents important cellular and molecular events for the development of HIVAN in these Tg mice.


Figures

Figure 1
Figure 1
Renal pathology of CD4C/HIV-Nef transgenic (Tg) mice represents a collapsing focal segmental glomerulosclerosis (FSGS). A and B: Evaluation of albuminuria in non-Tg and Tg mice. Urine was run on SDS-PAGE along with control bovine serum albumin (BSA) at different concentrations (A), and ratios of albumin (Alb)/creatinine (Crea) concentration were measured (B). C–I: Representative kidney sections stained with periodic acid–Schiff. E: Tubular dilatations forming microcysts, with interstitial fibrosis and monocytic infiltration observed in Tg mice. F and G: FSGS is seen in glomeruli of Tg mice, some presenting with collapsing features, including segmental to global collapse of the tuft and hypertrophic, hyperplasic vacuolated podocytes. H: Other FSGS lesions presented with segmental solidification of the tuft by matrix material, hyaline deposits, and adhesion. I: Mild mesangial cell hypercellularity in less affected Tg glomeruli. JL, O, P, S, and T: Immunohistochemistry on kidney sections with antibodies against smooth muscle actin (SMA; JL), collagen IV (O and P) and cytokeratin 18 (CK18; S and T). M, N, Q, R, U, and V: Glomerular area (M, Q, and U) and intensity (N, R, and V) of immunoreactivity were quantitated on 18 to 25 randomly chosen glomeruli per mouse on groups of three to five non-Tg and four to five Tg mice. Relative values (pixels) for each glomerulus are shown as a dot and were pooled. K and L: SMA staining is increased in Tg mice in late (L), but not in early (K), stages. K, L, and T: Strong labeling of periglomerular and parietal Tg cells with anti-SMA (K and L) and anti-CK18 (T) antibody (Ab). W and X: Confocal immunofluorescence with Ab against desmin. Y: Quantification of glomerular desmin staining (mean of voxels count) was performed on 60 randomly chosen glomeruli. Z: Detection of IgM in glomeruli of Tg mice by immunofluorescence microscopy with anti-mouse IgM monoclonal Ab. Inset: Portion of non-Tg kidney reacted with the same anti-IgM Ab. Statistical analyses were performed with the nested analysis of variance test with Bonferroni correction. For all these markers, staining in Tg glomeruli was variable, as documented in the dispersed values of area and intensity of immunoreactive positivity. n = 40 Tg mice (E). ∗∗P < 0.01, ∗∗∗P < 0.001, and ∗∗∗∗P < 0.0001. Original magnification: ×100 (C, E, and J–P); ×400 (D, H, and I); ×600 (F and G); ×40 (S, T, W, and X); ×10 (Z).
Figure 2
Figure 2
Renal pathology of CD4C/HIV-Nef transgenic (Tg) mice is associated with enhanced kidney cell proliferation and enhanced tubular, but minimal glomerular, apoptosis. AD: Proliferation was assessed after bromodeoxyuridine (BrdU) incorporation in vivo, in non-Tg (A and C) and Tg (B and D) mice. Incorporated BrdU was detected by immunohistochemistry (IHC). AD: Images at low (A and B) or high (C and D) magnification. B and D: Incorporated BrdU was greatly enhanced in Tg tubular (B), glomerular (arrows; D), and parietal (arrowheads; D) epithelial cells. E: Quantitative analysis. The percentage of BrdU-positive cells was calculated from the total number of glomerular or parietal cells and analyzed by the t-test. A total of 23 non-Tg and 18 Tg glomeruli per mouse from two non-Tg and three Tg mice were counted. F–I: Apoptosis was assessed by IHC with anti–cleaved caspase-3 (casp3) antibody. F: Representative images of non-Tg (top panel) and Tg (bottom panel) kidneys showing cleaved casp3-positive cells (red arrows). G: Quantification of the number of cleaved casp3-positive tubular cells counted in all ×40 fields of one kidney per mouse, excluding glomeruli, in four non-Tg and four Tg mice. Data were analyzed by t-test. H and I: Quantification of cleaved casp3 staining in glomeruli was performed on 18 to 25 randomly chosen glomeruli per mouse on groups of six non-Tg and five Tg mice, as in Figure 1, M and N. H and I: Relative area (H) and intensity (I) of glomerular immunoreactive materials (pixels) are shown for each group and analyzed by nested analysis of variance. ∗∗∗P < 0.001, ∗∗∗∗P < 0.0001. Original magnification: ×10 (A and B); ×40 (C and D); ×20 (F).
Figure 3
Figure 3
Podocyte dedifferentiation and foot process effacement in CD4C/HIV-Nef transgenic (Tg) mice. AF: Representative immunohistochemical images of kidney sections with antibodies against WT-1 (AC) or synaptopodin (DF). B and C: Decreased WT-1 staining in Tg glomeruli, representative of 90% of Tg glomeruli. Some Tg glomeruli (5% to 10%) stain as non-Tg ones. F: Quantification of synaptopodin staining in glomeruli performed on 18 to 25 randomly chosen glomeruli per mouse on groups of three non-Tg and three Tg mice, as in Figure 1, M and N. Relative intensity (pixels) for each glomerulus is shown as an open (non-Tg) or closed (Tg) dot and was pooled. GN: Electron microscopy. G–N: Young (16-day–old; I–K) or older [40-day–old (G, H, L, and M) or 54-day–old (N)] non-Tg and Tg mice were used. G and H: Podocyte hypertrophy (arrows) observed in Tg (H), but not in non-Tg (G), mice. J, K, M, and N: Foot process effacement (arrowheads), endothelial cell swelling (asterisk), and focal splitting of glomerular basement membrane (GBM; arrows) seen in 16-day–old Tg mice (J and K) and advanced in 40-day–old Tg mice (M and N). M and N: Diffuse thickening and folding of GBM. OS: Expression of green fluorescent protein (GFP) in podocytes of human liver/lymph node–specific intercellular adhesion molecule-3–grabbing non-integrin (hL-SIGN)/GFP reporter mice. O: Structure of the hL-SIGN/GFP transgene. P: Low magnification showing GFP expression in glomeruli. This glomerular pattern of GFP expression was observed in four independent Tg founder lines. QS: Confocal microscopy with antibody against von Willebrand factor (VWF; Q), α8 integrin (R), and synaptopodin (S). Colocalization was observed only with synaptopodin labeling, indicating that the GFP-positive cells represent podocytes. TV: Early hypertrophy of podocytes in Nef-expressing Tg mice. Kidney sections were prepared from (hL-SIGN/GFP × CD4C/HIV-Nef) double and single hL-SIGN/GFP Tg mice, and areas occupied by GFP were measured. TV: Representative image of glomeruli in young mice (T and U) and quantification of glomeruli GFP areas (V). n = 4 non-Tg and 4 Tg mice (GN); n = 2 (hL-SIGN/GFP × CD4C/HIV-Nef) double Tg mice and single hL-SIGN/GFP Tg mice (TV). ∗∗P < 0.01, ∗∗∗P < 0.001, and ∗∗∗∗P < 0.0001. Original magnification: ×100 (A, B, D, E, G, H, and QU); ×7500 (IK); ×15,000 (LN); ×10 (P). L, capillary lumen; P, podocyte.
Figure 4
Figure 4
The regulatory sequences of the human CD4 gene drive expression of green fluorescent protein (GFP) primarily in glomerular mesangial cells of transgenic (Tg) mice. A: Western blot analysis of protein extracts (100 μg) from purified glomeruli or thymus of non-Tg and CD4C/HIV-Nef Tg mice. B: Structure of the CD4C/GFP transgene. CE: Fluorescent (C) or confocal (D and E) microscopy in kidney glomeruli of CD4C/GFP Tg mice to detect GFP expression. D and E: Representative images showing segmental (s) or uniform (u) distribution of GFPHi (Hi) and GFPLow (Lo) cells. FI: Quantification was performed with Volocity version 6 (F) or Imaris version 8.2.1 (GI) software, comparing GFP expression between (F) or within (GI) glomeruli, and recording levels of GFP expressing [low (Lo)] or [high (Hi)] mean voxels value (G), percentage of glomeruli with low or high GFP levels (H), as well uniform (u) or segmental (s) distribution (I) of GFP expression. Note nonuniform levels of expression. JO: Confocal immunofluorescence with isotype control (ISO) antibody (Ab; J) or with Ab against WT-1 (K), synaptopodin (SYN; L), CD31 (M), von Willebrand factor (VWF; N), and α8 integrin (O) (all in red). P: Quantification of GFP intensity signal in GFP-positive cells stained for α8 integrin, synaptopodin (Synapto), or CD31. GFP/marker colocalization was analyzed on kidney tissue sections on 60 to 70 glomeruli by confocal microscopy and quantitated with Volocity software. Data are expressed as summation of intensity values (pixels). Q: Fluorescence-activated cell sorting profile of CD45.2-negative, GFP-positive glomerular cells of CD4C/GFP Tg mice labeled with the indicated antibodies or their isotype controls. Note the higher percentage of GFPHi cells labeled with anti-α8 integrin Ab. Also note that most CD31-positive cells are GFPLo. Number and percentage of α8 integrin+ or CD31+ cells in quadrant are given. Data from four experiments with 10 mice. n = 200 glomeruli (F); n = 60 glomeruli (GI); n = 10 CD4C/GFP Tg mice (Q). ∗∗∗P < 0.001, ∗∗∗∗P < 0.0001. Original magnification: ×10 (C); ×20 (D and E); ×40 (JO). A, AatII; Bs, BssHII; Ex1, exon 1; hCD4 promo, promoter of the human CD4 gene; LTR, long terminal repeat; mCD4 enh., mouse CD4 enhancer; MFI, mean fluorescence intensity; S, SalI.
Figure 5
Figure 5
Preferential expression of surrogate genes [green fluorescent protein (GFP), inducible GFP, and HIV Gag p24] in glomerular mesangial cells through the regulatory sequences (CD4C) of the human CD4 gene. AC: Identification of glomerular GFP-positive cells from CD4C/GFP transgenic (Tg) mice. Cells were obtained from purified glomeruli, further digested, fixed, and cytospotted onto glass slides before staining with antibody against α8 integrin, synaptopodin (Synapto), and CD31. Fluorescence analysis of labeled antibody (Ab) and endogenous GFP was performed by confocal microscopy on 700 to 800 cells. A: Representative images of GFP positivity and staining with the indicated Ab (top panels) or with their isotype controls (Ctrls; bottom panels). B: Percentage of GFP-positive glomerular cells of total glomerular cells purified (total) or belonging to each cell subset [mesangial cells (α8 integrin+), podocytes (synaptopodin+), or endothelial cells (CD31+)] of GFP-positive cells counted. C: Quantification of GFP fluorescence intensity in each glomerular cell subset. Data expressed as sum of mean GFP intensity (pixels). DG: Kidney glomerular cell expression through the CD4C promoter in inducible double [CD4C/reverse tetracyclin transactivator (rtTA) × tetracycline operon (tetO)/GFP] Tg mice. D: GFP positivity in kidney tissue sections. Note that most GFPHigh cells are in glomeruli. The dotted appearance of GFP-positive cells reflects expression of GFP in nuclei in this reporter strain. EG: Purified glomerular cells were stained with the same Ab and analyzed by confocal microscopy after being cytospotted (E and F), as above and by fluorescence-activated cell sorting (G). EG: GFP colocalization with cell-specific markers was evaluated and tabulated as percentage on 700 to 800 cells (E) and sum of mean GFP intensity (pixels; F) or mean fluorescence intensity (MFI; G). Data from two experiments with four mice. H: Kidney glomerular cell expression through the CD4C promoter in CD4C/HIV-MutH Tg mice. Purified glomerular cytospotted cells were stained with anti-gag p24 Ab and with each of the same cell-specific Ab used in A. Gag p24 colocalization with cell-specific markers was tabulated as percentage on 700 to 800 cells, as above. Note that mesangial cells represent most GFP- or p24-positive cells with the highest GFP intensity. Data from four (CD4C/GFP) and two (CD4C/rtTA × tetO/GFP) experiments with 10 and 4 mice, respectively. ∗P < 0.05, ∗∗P < 0.01, ∗∗∗P < 0.001, and ∗∗∗∗P < 0.0001. Original magnification: ×40 (A); ×10 (D). AF, Alexa Fluor.
Figure 6
Figure 6
Mesangial cell expansion in CD4C/HIV-Nef transgenic (Tg) mice. A: Light microscopic assessment of mesangial cells in 30 to 40 glomeruli per kidney in seven Tg and four non-Tg kidneys. Mesangial hypercellularity is defined as three or more cells per mesangial area. Diffuse: ≥50% glomeruli affected. Graph shows the percentage of Tg (4/7, 57.1%) and non-Tg (0/4, 0%) mice with diffuse mesangial cell hyperplasia. B and C: Immunohistochemistry was performed on kidney sections with antibodies against α8 integrin (five non-Tg and five Tg mice). A and B: Note a fainter labeling around nodular structure of Tg mesangial cells (B), compare with the tree-like staining in normal non-Tg mice (A). DF: Electron microscopy on the same tissues as those shown in Figure 3, G through N. DF: Mice were 40 (D and E) or 54 (F) days old. DF: Tg mesangial cells are hyperplastic (E) and enlarged (E and F). Original magnification: ×100 (B and C); ×10,000 (DF). M, mesangial cells.
Figure 7
Figure 7
The CD4C regulatory elements are active in subsets of extraglomerular cells, but not in parietal cells, and Nef expression through these CD4C elements leads to enhanced glomerular cell outgrowth in vitro. AI: Activity of CD4C in extraglomerular cells. AH: Confocal immunofluorescence of kidney sections from CD4C/green fluorescent protein (GFP) transgenic (Tg) mice showing GFP-positive paraglomerular (AE) or peritubular (FH) structures stained with the indicated antibody [Ab; anti–smooth muscle actin (SMA), anti–platelet-derived growth factor receptor-β (PDGFRβ; red), or anti-renin (white) Ab] and with Alexa Fluor–labeled secondary Ab. Note colocalization in some cells within these structures. I: Staining of parietal cells with anti–Src-suppressed protein kinase C substrate (SSecks) Ab (red). Few cells show colocalization with endogenous GFP. J and K: Activation of parietal cells studied with CD44, an activation marker for parietal cells. Representative image of costaining of kidney sections from non-Tg and CD4C/Nef Tg mice with sheep anti-SSecks/anti-sheep Alexa-488 and rat anti-CD44/anti-rat Alexa 568 Ab. Note stronger signal of both markers in Tg cells. Colocalization is observed in Tg cells, but not in non-Tg cells. Images were acquired with confocal 710 microscope in Z-stack mode. Arrows: immune-positive parietal cells. LO:In vitro growth of glomerular cells. L: Purified kidney glomeruli from non-Tg and CD4C/Nef Tg mice were incubated in Petri dishes (approximately 1500 glomeruli/dish). M: Adherent cells around glomeruli were counted after 1 and 4 days in culture. Representative experiment of four performed. In the three other experiments, the P values were <0.03, <0.01, and 0.0004. N and O: Attached non-Tg (N) and Tg (O) cells were labeled with phalloidin (green) and anti-fibronectin (red). Note increased staining of Nef Tg cells. n = 3 non-Tg mice (J and K); n = 4 CD4C/Nef Tg mice (J and K). ∗∗P < 0.01, ∗∗∗P < 0.001. Original magnification: ×40 (AK); ×100 (N and O).
Figure 8
Figure 8
Deletion of Src partially and that of Hck/Lyn largely abrogates renal pathology of CD4C/HIV-Nef transgenic (Tg) mice. AJ: CD4C/HIVMutA or CD4C/HIV-Nef Tg mice were bred on Src (AF) or Hck/Lyn (GJ) gene-deficient background, respectively, and assessed for HIV-1–associated nephropathy at the age of 5 to 8 or 1 to 2.25 months, respectively. A: Hematoxylin and eosin staining of kidneys from representative Src-deficient Tg mice. B and G: Evaluation of microscopic pathology in kidneys of Src (B) or Hck/Lyn (G) gene-deficient Tg mice. C, D, and H: Quantification of desmin-positive areas in glomeruli of Src (C and D) or Hck/Lyn (H) gene-deficient Tg mice. E and I: Quantification of smooth muscle actin (SMA) positivity, expressed as mean of voxel counts, in glomeruli of Src (E) or Hck/Lyn (I) gene-deficient Tg mice. F and J: Albuminuria in Src (F) or Hck/Lyn (J) gene-deficient Tg mice. Ratios of albumin (Alb)/creatinine (Crea) concentration were measured. Data for desmin and SMA staining were obtained by confocal microscopy. B, F, G, and J: In graphs showing scores (B and G) and albumin levels (F and J), each dot represents a mouse. D, E, H, and I: In graphs showing levels of marker staining, each dot represents one glomerulus from three to four mice per group. Statistical analysis was performed using unpaired t-test and nested analysis of variance. Note that SMA and desmin stainings were more variable in +/− or +/+ Tg than in −/− Tg or non-Tg glomeruli, as documented in the more dispersed values of immunoreactive positivity. ∗∗P < 0.01, ∗∗∗P < 0.001, and ∗∗∗∗P < 0.0001. Original magnification: ×5 (A); ×40 (C).

References

    1. D'Agati V., Appel G.B. Renal pathology of human immunodeficiency virus infection. Semin Nephrol. 1998;18:406–421. - PubMed
    1. Ross M.J., Klotman P.E. HIV-associated nephropathy. AIDS. 2004;18:1089–1099. - PubMed
    1. Alpers C.E., Tsai C.C., Hudkins K.L., Cui Y., Kuller L., Benveniste R.E., Ward J.M., Morton W.R. Focal segmental glomerulosclerosis in primates infected with a simian immunodeficiency virus. Aids Res Hum Retrovir. 1997;13:413–424. - PubMed
    1. Gattone V.H., Tian C., Zhuge W., Sahni M., Narayan O., Stephens E.B. SIV-associated nephropathy in rhesus macaques infected with lymphocyte-tropic SIVmac239. AIDS Res Hum Retroviruses. 1998;14:1163–1180. - PubMed
    1. Stephens E.B., Tian C., Li Z., Narayan O., Gattone V.H., 2nd Rhesus macaques infected with macrophage-tropic simian immunodeficiency virus (SIVmacR71/17E) exhibit extensive focal segmental and global glomerulosclerosis. J Virol. 1998;72:8820–8832. - PMC - PubMed

Publication types