

Benchmarking of Machine Learning classifiers on plasma proteomic for COVID-19 severity prediction through interpretable artificial intelligence
- PMID: 36868685
- PMCID: PMC9846931
- DOI: 10.1016/j.artmed.2023.102490
Benchmarking of Machine Learning classifiers on plasma proteomic for COVID-19 severity prediction through interpretable artificial intelligence
Abstract
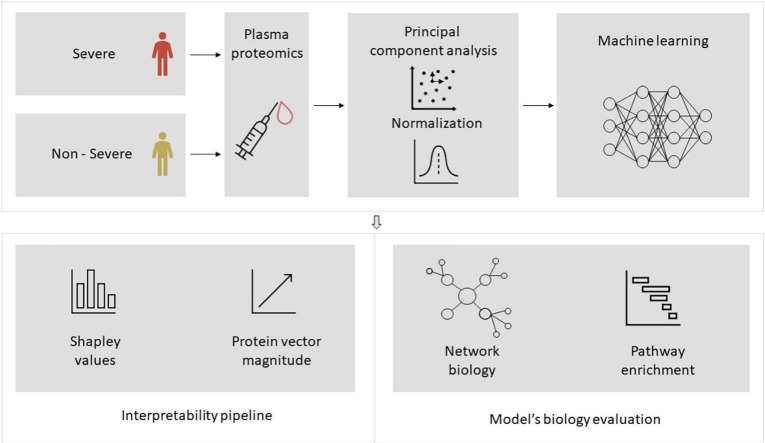
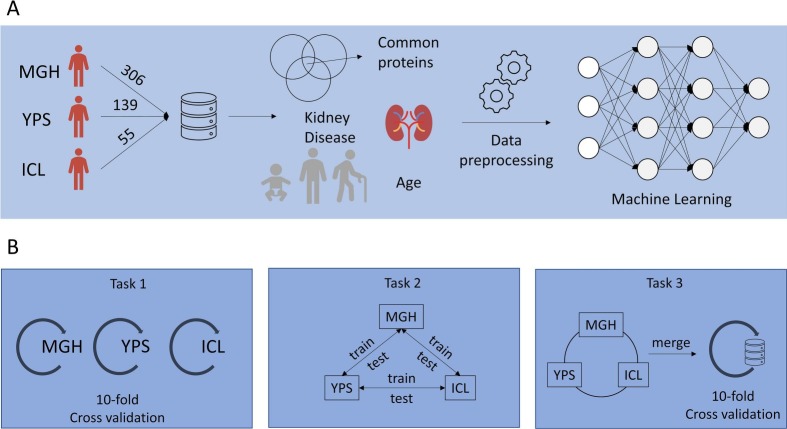
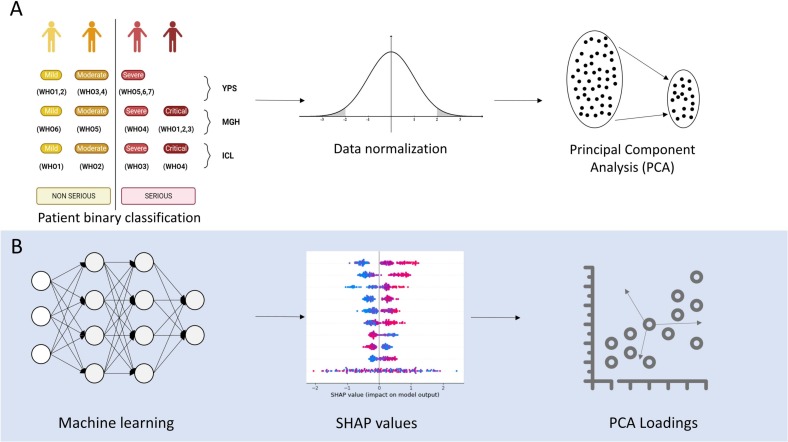
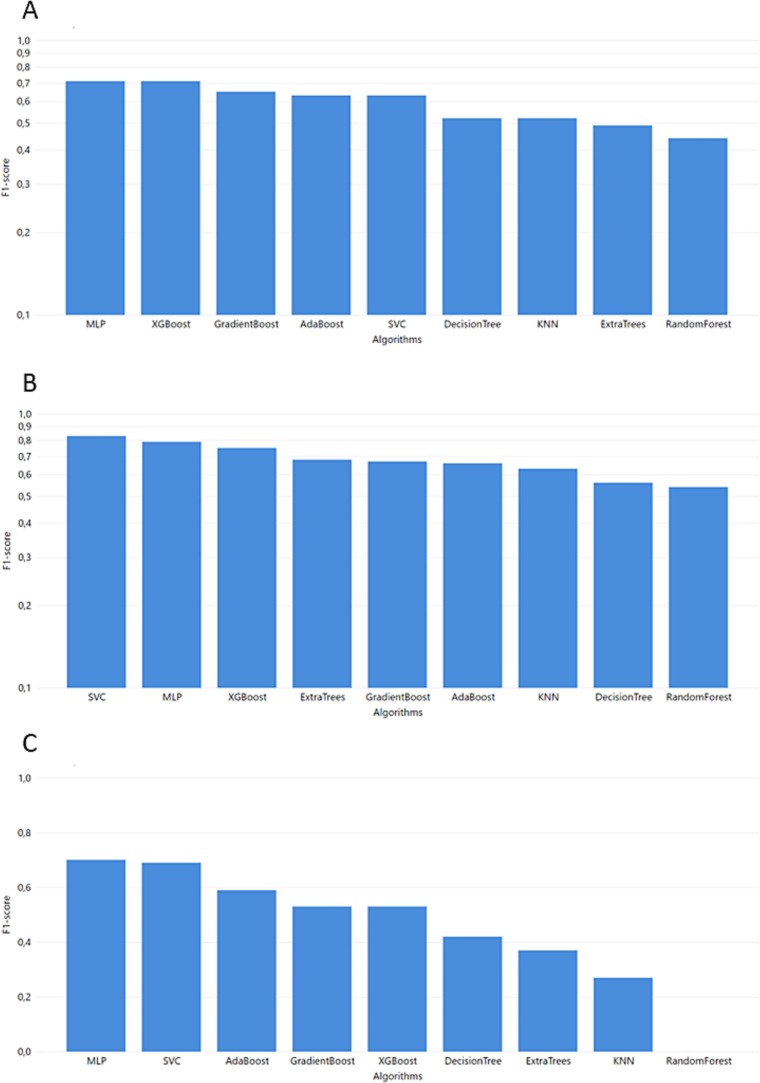
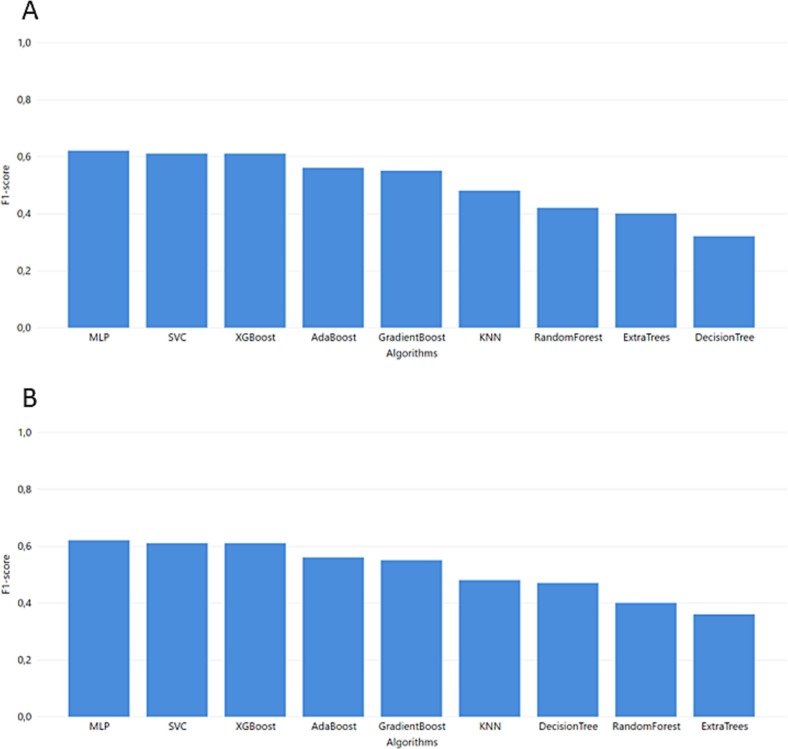
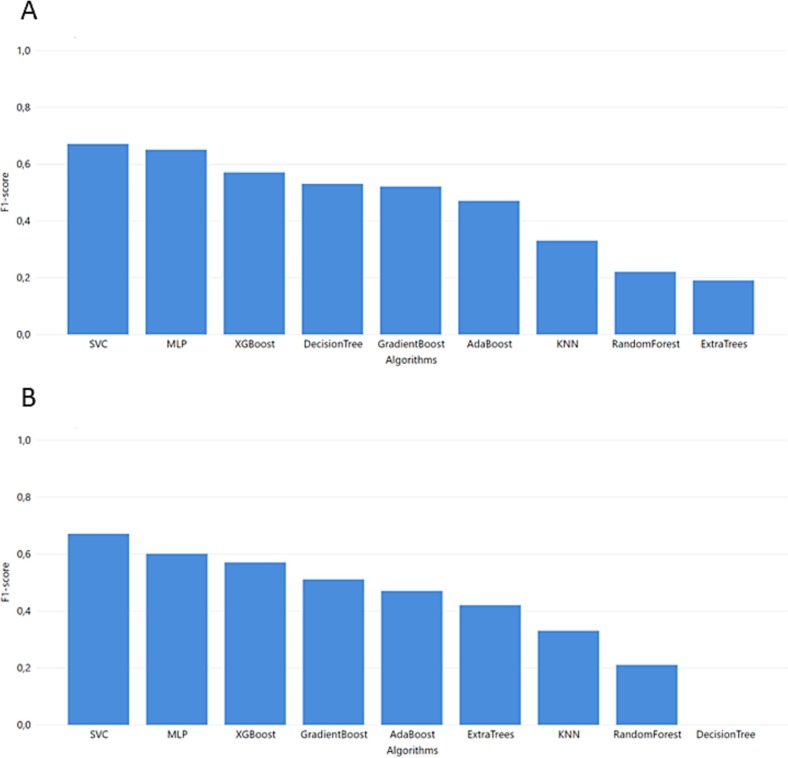
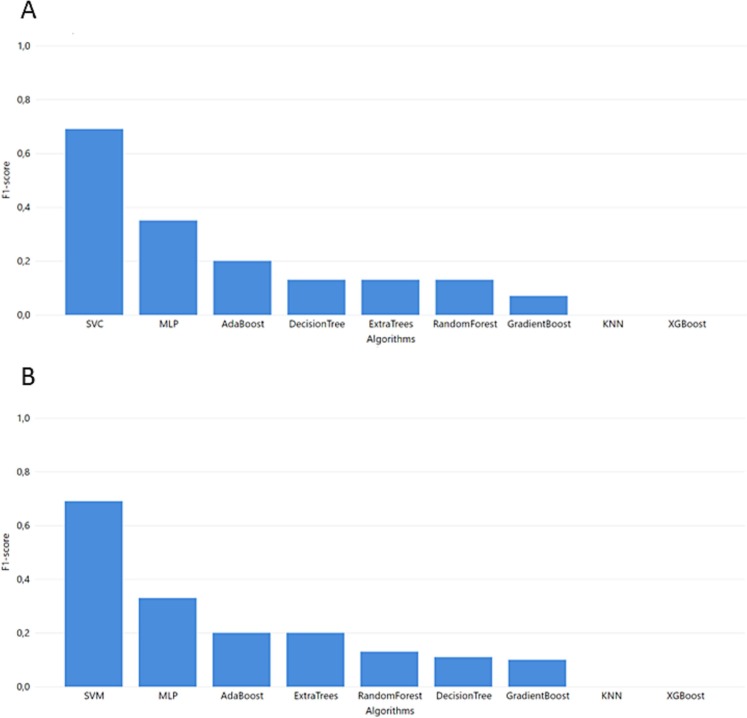
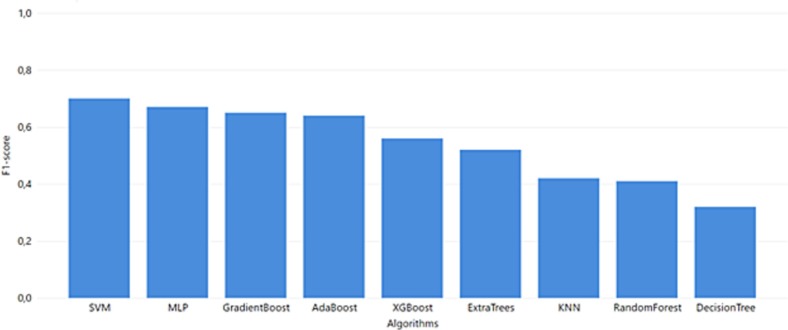
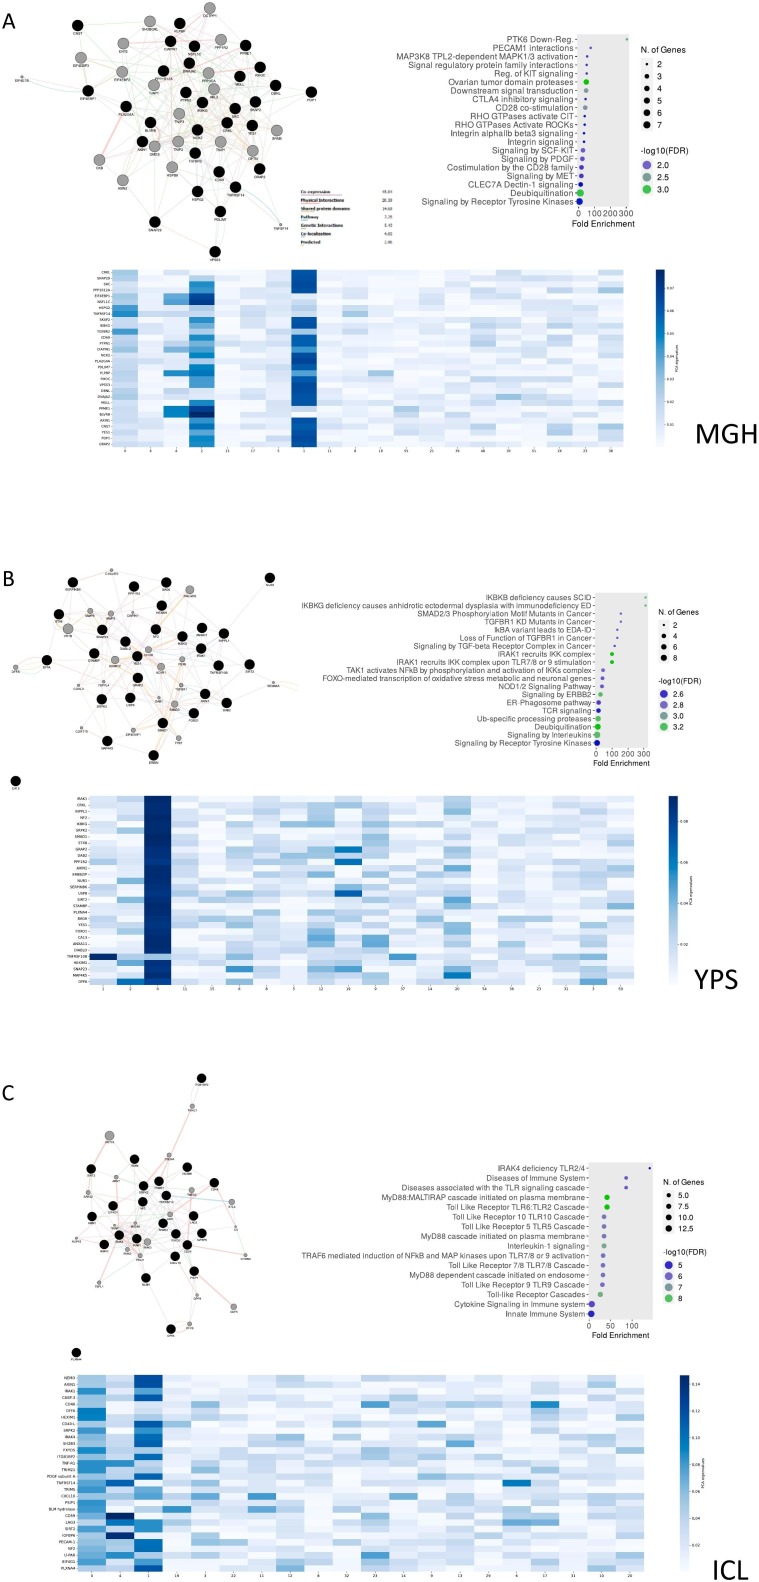
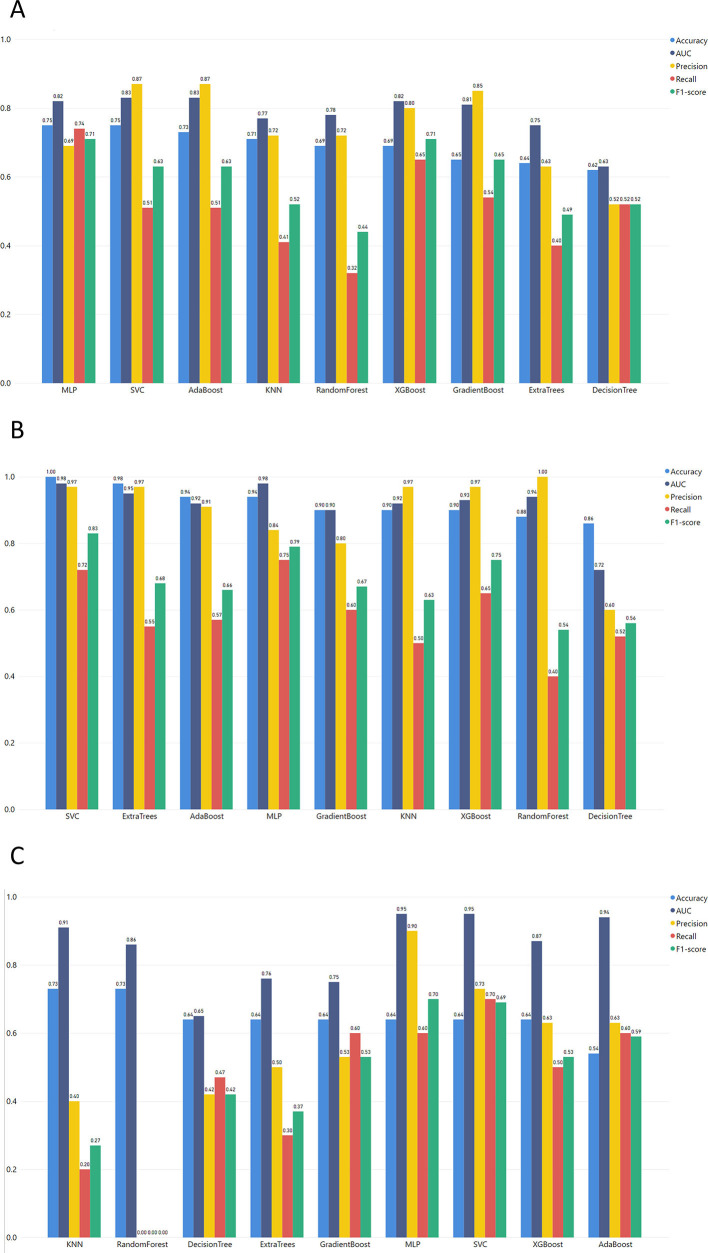
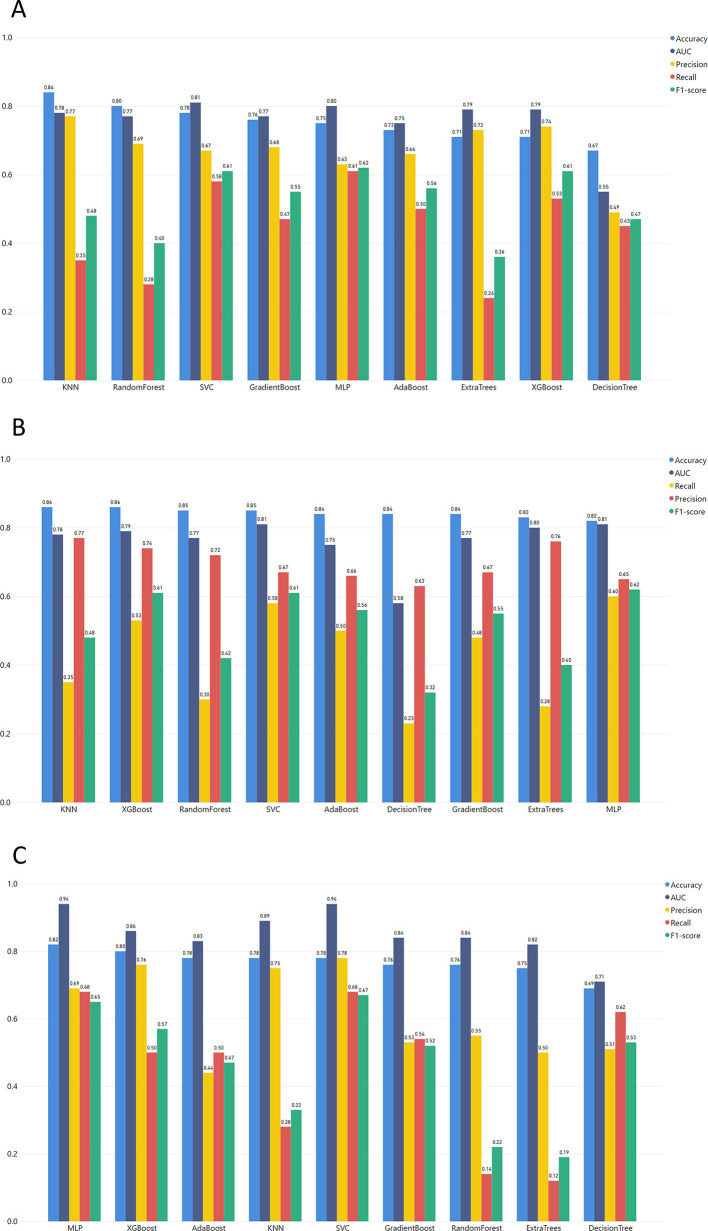
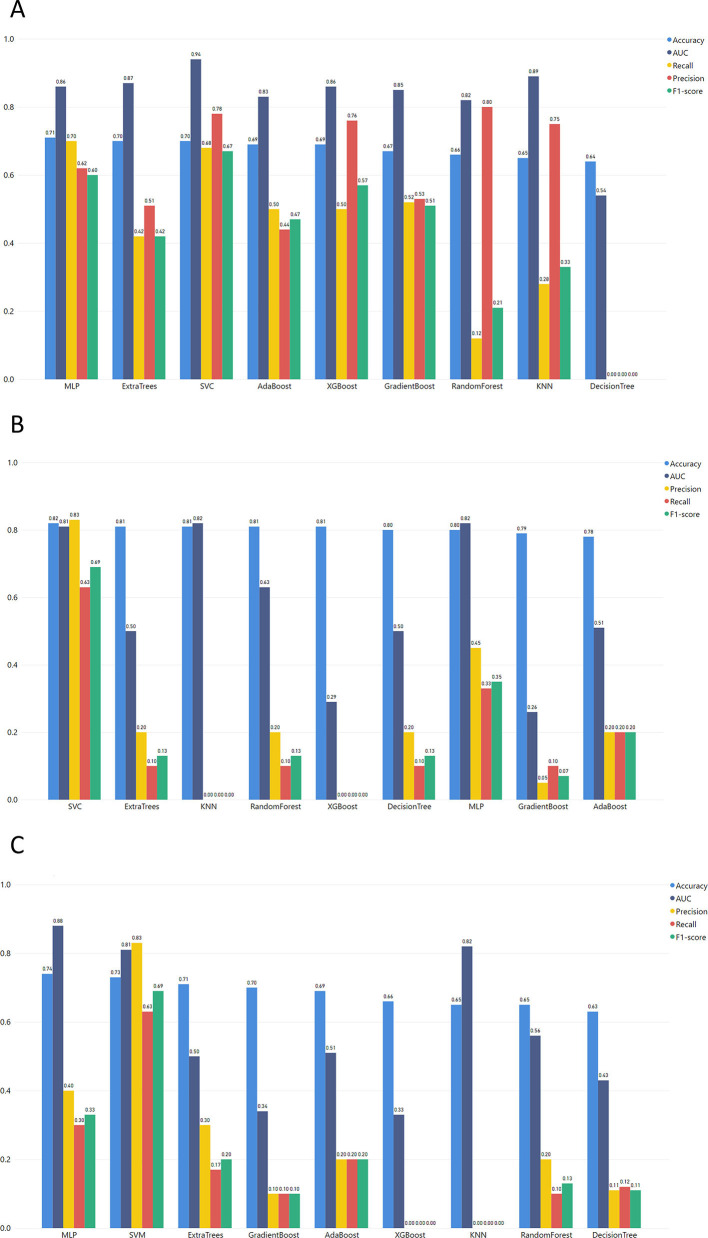
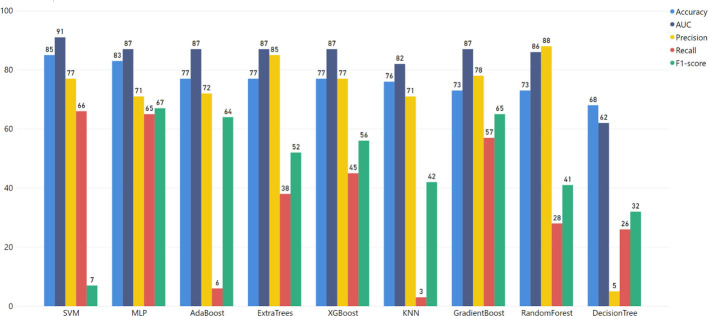
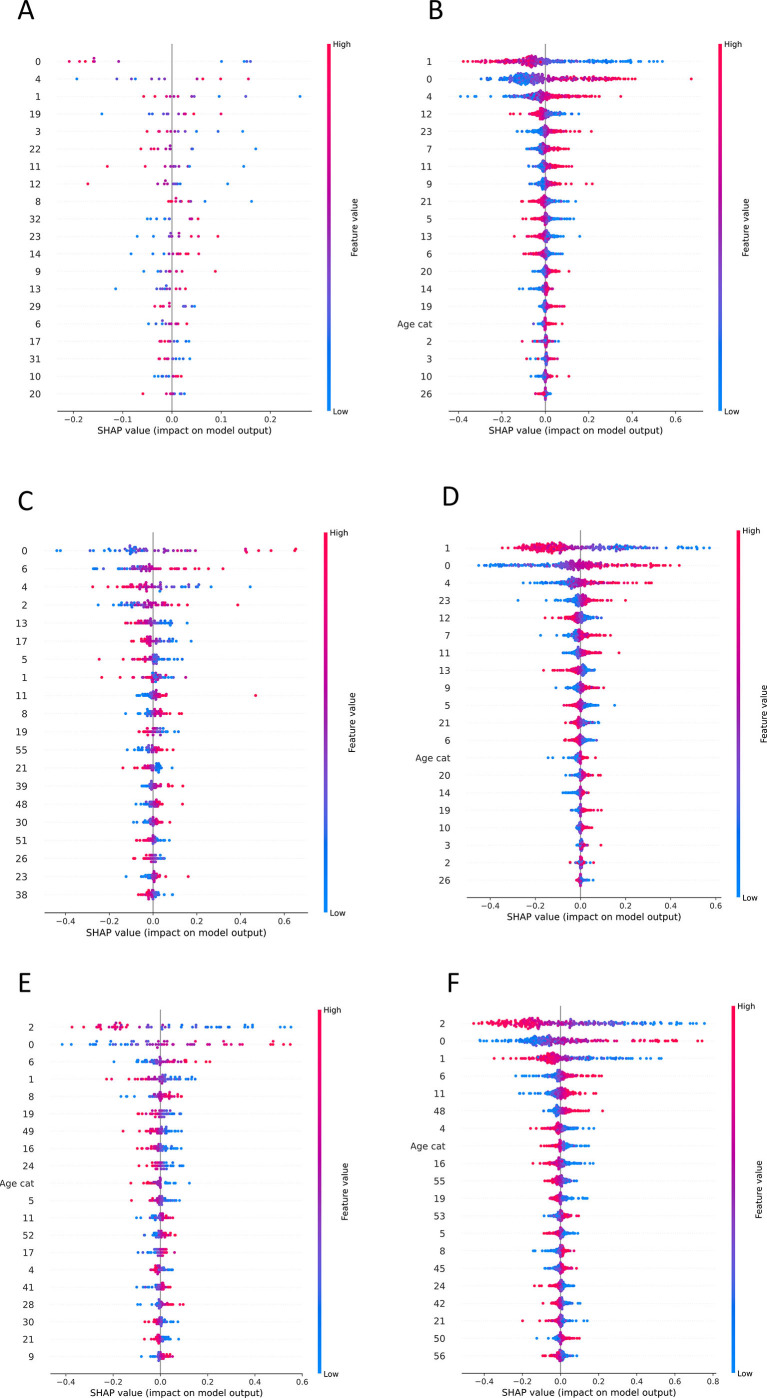
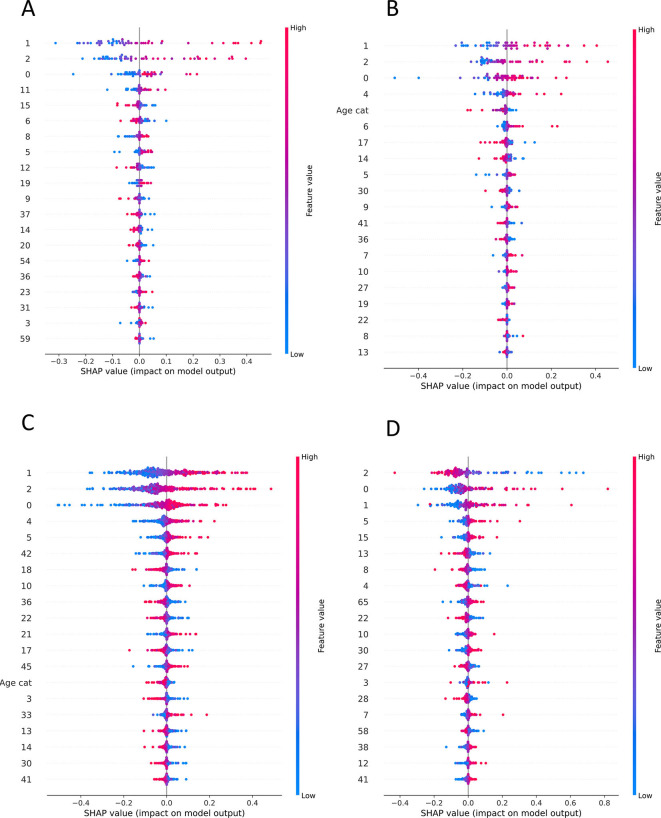
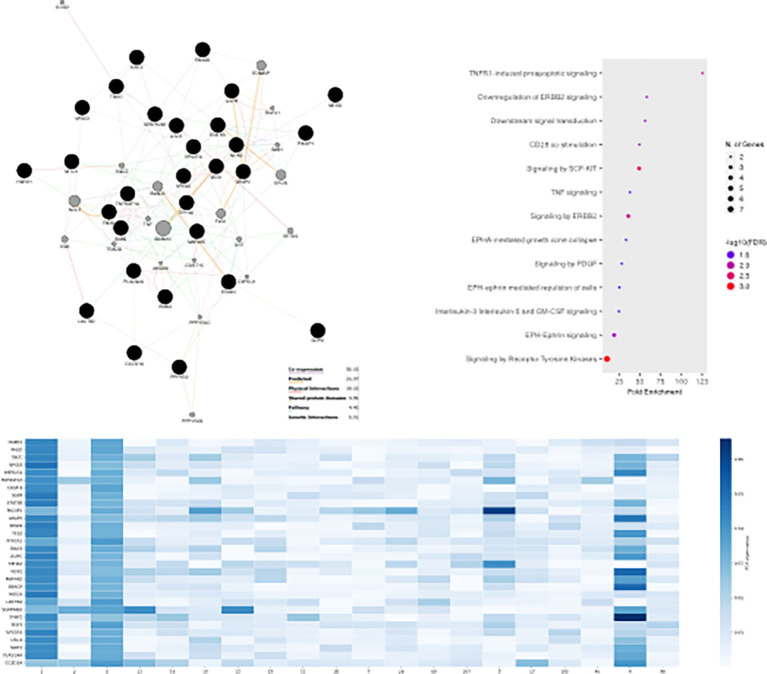
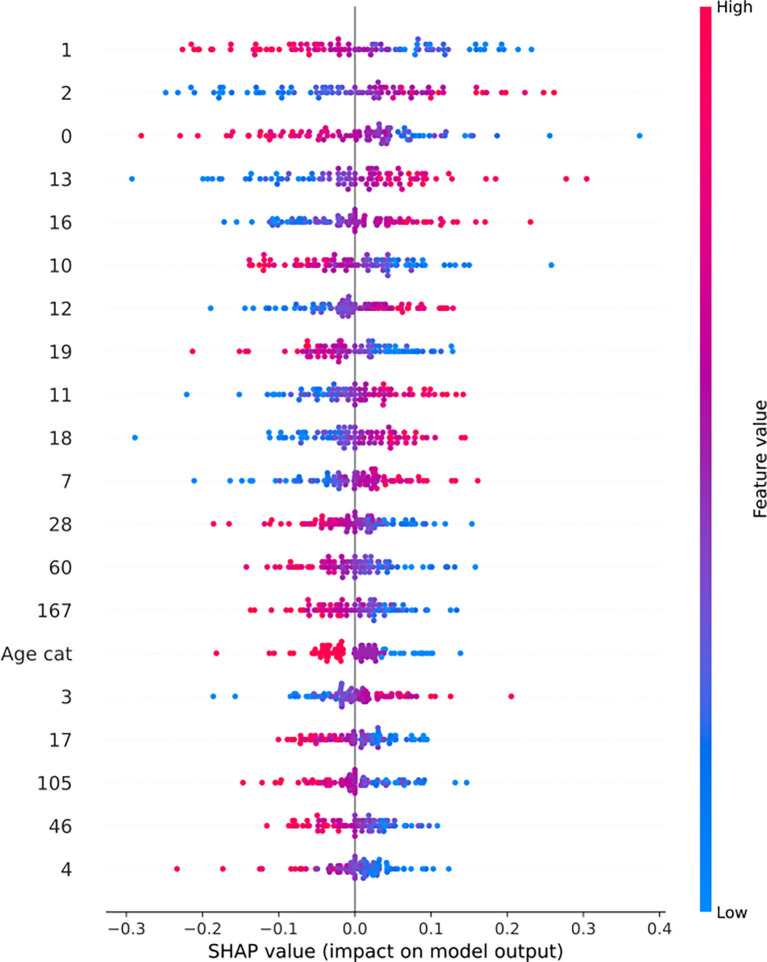
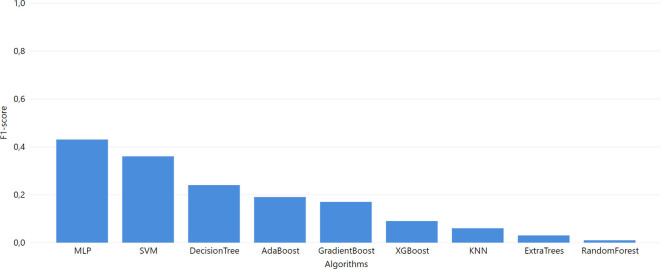
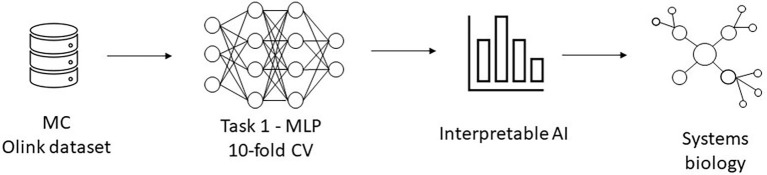
The SARS-CoV-2 pandemic highlighted the need for software tools that could facilitate patient triage regarding potential disease severity or even death. In this article, an ensemble of Machine Learning (ML) algorithms is evaluated in terms of predicting the severity of their condition using plasma proteomics and clinical data as input. An overview of AI-based technical developments to support COVID-19 patient management is presented outlining the landscape of relevant technical developments. Based on this review, the use of an ensemble of ML algorithms that analyze clinical and biological data (i.e., plasma proteomics) of COVID-19 patients is designed and deployed to evaluate the potential use of AI for early COVID-19 patient triage. The proposed pipeline is evaluated using three publicly available datasets for training and testing. Three ML "tasks" are defined, and several algorithms are tested through a hyperparameter tuning method to identify the highest-performance models. As overfitting is one of the typical pitfalls for such approaches (mainly due to the size of the training/validation datasets), a variety of evaluation metrics are used to mitigate this risk. In the evaluation procedure, recall scores ranged from 0.6 to 0.74 and F1-score from 0.62 to 0.75. The best performance is observed via Multi-Layer Perceptron (MLP) and Support Vector Machines (SVM) algorithms. Additionally, input data (proteomics and clinical data) were ranked based on corresponding Shapley additive explanation (SHAP) values and evaluated for their prognosticated capacity and immuno-biological credence. This "interpretable" approach revealed that our ML models could discern critical COVID-19 cases predominantly based on patient's age and plasma proteins on B cell dysfunction, hyper-activation of inflammatory pathways like Toll-like receptors, and hypo-activation of developmental and immune pathways like SCF/c-Kit signaling. Finally, the herein computational workflow is corroborated in an independent dataset and MLP superiority along with the implication of the abovementioned predictive biological pathways are corroborated. Regarding limitations of the presented ML pipeline, the datasets used in this study contain less than 1000 observations and a significant number of input features hence constituting a high-dimensional low-sample (HDLS) dataset which could be sensitive to overfitting. An advantage of the proposed pipeline is that it combines biological data (plasma proteomics) with clinical-phenotypic data. Thus, in principle, the presented approach could enable patient triage in a timely fashion if used on already trained models. However, larger datasets and further systematic validation are needed to confirm the potential clinical value of this approach. The code is available on Github: https://github.com/inab-certh/Predicting-COVID-19-severity-through-interpretable-AI-analysis-of-plasma-proteomics.
Keywords: Artificial intelligence; COVID-19; Forecasting; Machine Learning; Severity prediction.
Copyright © 2023 Elsevier B.V. All rights reserved.
Conflict of interest statement
Declaration of competing interest None declared.
Figures
Similar articles
-
A new hybrid ensemble machine-learning model for severity risk assessment and post-COVID prediction system.Math Biosci Eng. 2022 Apr 13;19(6):6102-6123. doi: 10.3934/mbe.2022285. Math Biosci Eng. 2022. PMID: 35603393
-
Development and Validation of a Robust and Interpretable Early Triaging Support System for Patients Hospitalized With COVID-19: Predictive Algorithm Modeling and Interpretation Study.J Med Internet Res. 2024 Jan 11;26:e52134. doi: 10.2196/52134. J Med Internet Res. 2024. PMID: 38206673 Free PMC article.
-
Comparing machine learning algorithms to predict COVID‑19 mortality using a dataset including chest computed tomography severity score data.Sci Rep. 2023 Jul 13;13(1):11343. doi: 10.1038/s41598-023-38133-6. Sci Rep. 2023. PMID: 37443373 Free PMC article.
-
Role of biological Data Mining and Machine Learning Techniques in Detecting and Diagnosing the Novel Coronavirus (COVID-19): A Systematic Review.J Med Syst. 2020 May 25;44(7):122. doi: 10.1007/s10916-020-01582-x. J Med Syst. 2020. PMID: 32451808 Free PMC article.
-
Current Artificial Intelligence (AI) Techniques, Challenges, and Approaches in Controlling and Fighting COVID-19: A Review.Int J Environ Res Public Health. 2022 May 12;19(10):5901. doi: 10.3390/ijerph19105901. Int J Environ Res Public Health. 2022. PMID: 35627437 Free PMC article. Review.
Cited by
-
APNet, an explainable sparse deep learning model to discover differentially active drivers of severe COVID-19.Bioinformatics. 2025 Mar 4;41(3):btaf063. doi: 10.1093/bioinformatics/btaf063. Bioinformatics. 2025. PMID: 39921901 Free PMC article.
-
Development of a novel machine learning model based on laboratory and imaging indices to predict acute cardiac injury in cancer patients with COVID-19 infection: a retrospective observational study.J Cancer Res Clin Oncol. 2023 Dec;149(19):17039-17050. doi: 10.1007/s00432-023-05417-3. Epub 2023 Sep 25. J Cancer Res Clin Oncol. 2023. PMID: 37747525 Free PMC article.
-
Risk Factors and Prediction of 28-Day-All Cause Mortality Among Critically Ill Patients with Acute Pancreatitis Using Machine Learning Techniques: A Retrospective Analysis of Multi-Institutions.J Inflamm Res. 2024 Jul 11;17:4611-4623. doi: 10.2147/JIR.S463701. eCollection 2024. J Inflamm Res. 2024. PMID: 39011419 Free PMC article.
-
Predicting Outcomes of Preterm Neonates Post Intraventricular Hemorrhage.Int J Mol Sci. 2024 Sep 25;25(19):10304. doi: 10.3390/ijms251910304. Int J Mol Sci. 2024. PMID: 39408633 Free PMC article.
-
Plasma Proteins Associated with COVID-19 Severity in Puerto Rico.Int J Mol Sci. 2024 May 16;25(10):5426. doi: 10.3390/ijms25105426. Int J Mol Sci. 2024. PMID: 38791465 Free PMC article.
References
-
- World Health Organization . May 2022. COVID-19 Weekly Epidemiological Update. [Online]. Available: who.int/emergencies/diseases/novel-coronavirus-2019/situation-reports.
-
- Yu X., Hartana C., Srivastava A., Fergie J. Immunity to SARS-CoV-2: lessons learned. Front. Immunol. 2019;1 doi: 10.3389/fimmu.2021.654165. www.frontiersin.org - DOI - PMC - PubMed
Publication types
MeSH terms
LinkOut - more resources
Full Text Sources
Medical
Research Materials
Miscellaneous
