. 2023 Mar 29;43(13):2222-2241.
doi: 10.1523/JNEUROSCI.1519-22.2022. Epub 2023 Mar 3.

Selective Serotonin Reuptake Inhibitors within Cells: Temporal Resolution in Cytoplasm, Endoplasmic Reticulum, and Membrane

Affiliations

Selective Serotonin Reuptake Inhibitors within Cells: Temporal Resolution in Cytoplasm, Endoplasmic Reticulum, and Membrane

Aaron L Nichols et al. J Neurosci. .

Abstract

Selective serotonin reuptake inhibitors (SSRIs) are the most prescribed treatment for individuals experiencing major depressive disorder. The therapeutic mechanisms that take place before, during, or after SSRIs bind the serotonin transporter (SERT) are poorly understood, partially because no studies exist on the cellular and subcellular pharmacokinetic properties of SSRIs in living cells. We studied escitalopram and fluoxetine using new intensity-based, drug-sensing fluorescent reporters targeted to the plasma membrane, cytoplasm, or endoplasmic reticulum (ER) of cultured neurons and mammalian cell lines. We also used chemical detection of drug within cells and phospholipid membranes. The drugs attain equilibrium in neuronal cytoplasm and ER at approximately the same concentration as the externally applied solution, with time constants of a few s (escitalopram) or 200-300 s (fluoxetine). Simultaneously, the drugs accumulate within lipid membranes by ≥18-fold (escitalopram) or 180-fold (fluoxetine), and possibly by much larger factors. Both drugs leave cytoplasm, lumen, and membranes just as quickly during washout. We synthesized membrane-impermeant quaternary amine derivatives of the two SSRIs. The quaternary derivatives are substantially excluded from membrane, cytoplasm, and ER for >2.4 h. They inhibit SERT transport-associated currents sixfold or 11-fold less potently than the SSRIs (escitalopram or fluoxetine derivative, respectively), providing useful probes for distinguishing compartmentalized SSRI effects. Although our measurements are orders of magnitude faster than the therapeutic lag of SSRIs, these data suggest that SSRI-SERT interactions within organelles or membranes may play roles during either the therapeutic effects or the antidepressant discontinuation syndrome.SIGNIFICANCE STATEMENT Selective serotonin reuptake inhibitors stabilize mood in several disorders. In general, these drugs bind to SERT, which clears serotonin from CNS and peripheral tissues. SERT ligands are effective and relatively safe; primary care practitioners often prescribe them. However, they have several side effects and require 2-6 weeks of continuous administration until they act effectively. How they work remains perplexing, contrasting with earlier assumptions that the therapeutic mechanism involves SERT inhibition followed by increased extracellular serotonin levels. This study establishes that two SERT ligands, fluoxetine and escitalopram, enter neurons within minutes, while simultaneously accumulating in many membranes. Such knowledge will motivate future research, hopefully revealing where and how SERT ligands engage their therapeutic target(s).

Keywords: biosensor; escitalopram; fluoxetine; iDrugSnFRs; inside-out pharmacology; pharmacokinetics.


Figures

Figure 1.
Figure 1.
SSRI iDrugSnFR naming, residues mutated, and concentration–response relations. A, End points of SSRI iDrugSnFR development and concentration–response relations versus parent constructs. Data for iAChSnFR from Borden et al. (2019); data for iNicSnFR3b from Shivange et al. (2019). B, C, Concentration–response relations of purified iEscSnFR and iFluoxSnFR versus a drug panel. Ch, choline; ACh, acetylcholine; Dulox, duloxetine; Esc, escitalopram; Fluox, racemic fluoxetine; Parox, paroxetine; Sert, sertraline; Ven, venlafaxine; RCit, R-(-)-citalopram; Cit, racemic citalopram; Nor, norfluoxetine; RFluox, R-(+)-fluoxetine; SFluox, S-(-)-fluoxetine. Inset, Relevant S-slope values for each iDrugSnFR. Dashed lines indicate concentration–response relations that did not approach saturation for the concentration ranges tested; therefore, EC50 and ΔFmax/F0 could not be determined. iEscSnFR (B) shows preference for escitalopram over other SSRIs, with measurable binding to choline. iFluoxSnFR (C) shows a preference for racemic fluoxetine but also shows modest responses to other SSRIs. D, E, iEscSnFR (D) and iFluoxSnFR (E) shows little or no fluorescence response to all endogenous molecules tested. DA, dopamine; Glu, glutamate; Gly, glycine; Hist, histamine; l-DOPA, levodopa; NE, norepinephrine; 5-HT, serotonin.
Figure 2.
Figure 2.
Thermodynamic and kinetic profiles of purified SSRI iDrugSnFR proteins. A, ITC traces and fits. Top row, Exemplar heat traces of iEscSnFR paired with escitalopram and iFluoxSnFR paired with N,N-dimethylfluoxetine as obtained by ITC. The heats for iEscSnFR and iFluoxSnFR were endothermic. Bottom row, The resulting fits for each iDrugSnFR:drug pair from the integrated heats comprising each series of injections. B, Energy calculations from ITC traces and fits. Both iDrugSnFRs show exergonic reactions, but the relative enthalpic and entropic contributions differ. Affinity (Kd) and occupancy number (n) were also calculated. Data are from three separate runs. Mean ± SEM. C, D, Stopped-flow fluorescence data for various concentrations of (C) iEscSnFR and (D) iFluoxSnFR recorded for periods of 1 and 100 s, at sampling rates of 1 ms and 1 s, respectively. Fluorescence was activated at time 0 by mixing agonist and sensor protein as noted. iEscSnFR and iFluoxSnFR data are fits to single exponentials. Plots of the exponential rate constants versus [agonist]s are included for the 1 s data.
Figure 3.
Figure 3.
Spinning disk laser scanning confocal inverted microscope images of SSRI iDrugSnFRs in primary mouse hippocampal neurons. A1–B2, ER-targeted constructs of iEscSnFR and iFluoxSnFR are shown before (A1, B1) and during (A2, B2) exposure to each drug partner at 10 μm. ER-targeted iDrugSnFRs show the eponymous reticulated pattern, and fluorescence is excluded from the nucleus. C1–D2, PM-targeted constructs of the same iDrugSnFRs are shown before (C1, D1) and during (C2, D2) drug introduction. Localization in the PM is robust, with some minimal puncta that may represent inclusion bodies or internal transport. E1–F2, Cytoplasm-targeted constructs of iEscSnFR and iFluoxSnFR are shown before (E1, F1) and during (E2, F2) exposure to each drug partner. Cytoplasm-targeted iDrugSnFR is expressed in the soma (excluding the nucleus) and the dendrites.
Figure 4.
Figure 4.
SSRI iDrugSnFR concentration–response relations in primary hippocampal culture. A–D, Each iDrugSnFR detects its drug partner at the ER, PM, or cytoplasm (cyto) of primary hippocampal culture at the concentrations sampled. BC, Buffer control. SEM of data are indicated by semitransparent shrouds around traces where trace width is exceeded. Drugs were applied for 60 s pulses at 120–150 s intervals. A, B, iEscSnFR detects escitalopram, approaching a plateau during the application, then returns to baseline fluorescence during the washout at all targeted locations. C, D, iFluoxSnFR detection of fluoxetine has not yet reached a plateau during the application, then shows an incomplete washout with no return to baseline fluorescence during the washout period in every targeted location.
Figure 5.
Figure 5.
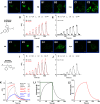
Further analysis of fluoxetine kinetics in primary hippocampal neurons. A, Traces of fluorescence responses during exposure to 1 μm fluoxetine with iFluoxSnFR. BC, Buffer control. SEM of data are indicated by semitransparent shrouds around traces where trace width is exceeded. A relatively long application (600 s) allowed ER- and PM-targeted iFluoxSnFR detection of 1 μm fluoxetine to approach a maximum ΔF/F0. A slightly longer (720 s) washout allowed a return to baseline fluorescence for both ER- and PM-targeted iFluoxSnFR. Time constants for the slower phase are given as τ (s). B, A control experiment, imaging concentration–response relations for escitalopram against iFluoxSnFR. SEM of data are indicated by semitransparent shrouds around traces where trace width is exceeded. iFluoxSnFR detects escitalopram at both the PM and ER. Escitalopram enters and exits the ER with a return to baseline fluorescence during the washout, a direct contrast to the behavior of fluoxetine as detected by iFluoxSnFR. C, Simulations of fluoxetine in the extracellular space, plasma membrane, and cytoplasm of a spherical cell. C1, The green trace gives the applied (clamped) [fluoxetine] in a shell 11.5 μm from the center of the cell. At a radius of 11.5 μm in the extracellular solution, the concentration is stepped from 0 to 1 μm for 1000 s; the concentration is then stepped back to zero (green trace). The concentrations in all extracellular shells (between the 11.5 μm shell and the PM shell at 7.5 μm radius) equilibrate within ∼50 ms and are indistinguishable from the applied concentration on this time scale. The black trace gives the cytoplasmic [fluoxetine] within the shell of outer radius of 7.495 μm, 10 nm below the plasma membrane. The concentrations in all other intracellular shells show a dispersion of ∼50 ms and are indistinguishable from the black trace on this time scale. The intracellular [fluoxetine] resembles that of A. C2, The moles of fluoxetine bound within the simulated membrane shell. With the parameters given in Table 1, the time course of PM-bound fluoxetine is indistinguishable from that of intracellular [fluoxetine] and resembles that of A (see above, Materials and Methods; Table 1).
Figure 6.
Figure 6.
Predictions and experiments on acid trapping of fluoxetine. A, Predicted accumulation of fluoxetine in synaptic vesicles and/or endosomes (green, pH 5.5) versus cytosol (black, pH 7.2). The extracellular solution has an assumed pH of 7.4. The calculations were performed according to the theory of Trapp et al. (2008). We assume the following: The cell and vesicles have a diameter of 8 μm and 100 nm, respectively; fluoxetine has a pKa of 9.8; the neutral form has LogP of 4.1; and the charged form has a 7.5 log unit smaller logP. The Excel workbook that performs the calculations is posted at https://github.com/lesterha/lesterlab_caltech. B, Pretreatment of primary hippocampal neurons with 80 nm folimycin (abbreviated Foli) does not substantially alter the concentration–response relations or waveforms for iFluoxSnFR against fluoxetine versus untreated neurons in parallel experiments. C, A typical field of cultured hippocampal neurons expressing iFluoxSnFR_PM. Orange outlines show ROIs for four neurite regions; purple lines show ROIs for four somatic regions. D, Mean ± SEM waveforms for all ROIs analyzed. There was no substantial difference between neurite and somatic fluoxetine responses.
Figure 7.
Figure 7.
Spinning disk laser scanning confocal inverted microscope images of SSRI iDrugSnFRs and ER-, PM-, and cytoplasm-targeted SSRI iDrugSnFR concentration–response relations in HeLa cells. A1-C2, F1-H2, ER-targeted constructs of iEscSnFR and iFluoxSnFR are shown before (A1, F1) and during (A2, F2) exposure to each drug partner at 10 μM. ER-targeted iDrugSnFRs show the eponymous reticulated structure and dark ovals corresponding to the nucleus. PM-targeted constructs of both SSRI iDrugSnFRs are shown before (B1, G1) and during (B2, G2) exposure to each drug partner at 10 μM. Localization to the PM is robust, with some minimal puncta that may represent inclusion bodies or internal transport. Cytoplasm-targeted constructs of iEscSnFR and iFluoxSnFR are shown before (C1, H1) and during (C2, H2) exposure to each drug partner at 10 μm Cytoplasm-targeted iDrugSnFRs show exclusion from the nucleus. D,E,I,J, Drugs were applied for 60 s pulses at 90–120 s intervals. Each iDrugSnFR detects its drug partner at the PM, ER, and cytoplasm of HeLa cells at the concentrations sampled. BC, Buffer control. SEM of data are indicated by semitransparent shrouds around traces where trace width is exceeded. D–E, iEscSnFR detects escitalopram, approaching a plateau during the application, then returns to baseline fluorescence during the washout, when targeted to the ER, PM, and cytoplasm. I–J, iFluoxSnFR targeted to the ER, PM, and cytoplasm detects fluoxetine with a return to baseline fluorescence between applications. K, Superimposed waveforms for a 60 s pulse of 1 μm fluoxetine versus iFluoxSnFR targeted to the ER, PM, and cytoplasm in HeLa cells. Tabular values give the time constants τ of each phase for ER and cytoplasm as well as τ for the slower phase for the PM. L, Simulations of the [fluoxetine] within intracellular shells. All intracellular shells superimpose on this time scale. L1, The green and black traces are equivalent to their counterparts in Figure 5C except that we have presumed weaker membrane accumulation than in the hippocampal neuron PM. L2, Simulated accumulation of fluoxetine within the membrane shell, corresponding to the slower phase of K for the PM-localized sensor.
Figure 8.
Figure 8.
Quaternary SSRI derivatives, SSRI iDrugSnFR concentration–response relations in purified protein, primary hippocampal culture, and HeLa cells. A, B, In vitro concentration–response relations of purified SSRI iDrugSnFRs against quaternary SSRI derivatives. esc, escitalopram; Q-esc, N-methylescitalopram; fluox, racemic fluoxetine; Q-fluox, N,N-dimethylfluoxetine. iEscSnFR detects N-methylescitalopram with an EC50 approximately half that for escitalopram (A). iFluoxSnFR detects N,N-dimethylfluoxetine with an EC50 approximately twice that for fluoxetine (B). C–F, Each iDrugSnFR detects its drug partner at the concentrations sampled in primary hippocampal culture and HeLa cells. BC, Buffer control. SEM of data are indicated by semitransparent shrouds around traces where trace width is exceeded. Drugs were applied for 60 s pulses at 90–120 s intervals to cells expressing _ER or _PM constructs (C, E). iEscSnFR_PM detects the presence of N-methylescitalopram, approaching a plateau during application, then returning to baseline during the washout. In contrast, iEscSnFR_ER is unable to detect N-methylescitalopram. A control concentration of escitalopram (final application) is detected by both the PM- and ER-targeted constructs. D, F, iFluoxSnFR_PM detects N,N-dimethylfluoxetine with a near approach to a plateau during each application, and with a return to baseline during the washout. In contrast, iFluoxSnFR_ER in primary hippocampal culture does not detect N,N-dimethylfluoxetine, and iFluoxSnFR_ER in HeLa cells detects N,N-dimethylfluoxetine above BC only at concentrations above 10 μm. A control concentration of fluoxetine is detected by both the PM- and ER-targeted constructs (final application). Application of fluoxetine in primary hippocampal culture reproduces the slowly increasing rising phase and the extended washout observed in Figure 4 C, D.
Figure 9.
Figure 9.
A 2.4 h incubation of SSRIs and quaternary derivatives with HeLa cells. esc, escitalopram; Q-esc, N-methylescitalopram; fluox, racemic fluoxetine; Q-fluox, N,N-dimethylfluoxetine. Left column, Targeted compartment of the SSRI biosensor. Middle column, Scheme and expectation of fluorescence response by biosensor based on compartment targeted and preincubated drug. Following preincubation, the drug is washed out, after which the alternate drug is washed in (i.e., when SSRI was preincubated, the quaternary derivative (labeled Quat) was applied and vice versa). An additional washout follows; then the originally preincubated drug is reapplied. Right columns, Fluorescence response of escitalopram and fluoxetine by their corresponding iDrugSnFR after preincubation, washes, and subsequent drug applications, agreeing with the expectations described for the middle column.
Figure 10.
Figure 10.
Inhibition of 5-HT-induced hSERT transport-associated currents by SSRIs and their quaternary derivatives. esc, escitalopram; Q-esc, N-methylescitalopram; fluox, racemic fluoxetine; Q-fluox, N,N-dimethylfluoxetine. A, B, Exemplar traces of 5-HT-induced hSERT currents in the absence and presence of Q-fluox and Q-esc respectively. C, D, Inhibition of 5-HT-induced hSERT currents of fluoxetine vs. N,N-dimethylfluoxetine and escitalopram vs. N-methylescitalopram, respectively. IC50 values and Hill coefficients, calculated from the corresponding fit. N,N-dimethylfluoxetine (n = 11) had an IC50 12-fold higher than fluoxetine (n = 13) for the inhibition of hSERT transport-associated currents (C). N-methylescitalopram (n = 24) had an IC50 sixfold higher than escitalopram (n =18) for the inhibition of hSERT transport-associated currents (D).
Figure 11.
Figure 11.
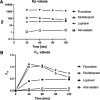
SSRIs are highly bioavailable intracellularly despite substantial membrane binding. A, Kp values, measuring total cellular accumulation in living HEK293 cells at 30–120 min of incubation. B, Fic values measuring the ratio between unbound intracellular (mostly cytoplasmic) concentration and the external solution. SEM values are shown where they exceed the size of data markers.

References

    1. Alberts B, Bray D, Lewis J, Morgan D, Raff M, Roberts K, Walter P, Wilson J, Hunt TW (2015) Molecular biology of the cell. New York: Garland Science.
    1. Armstrong D, Lester HA (1979) The kinetics of tubocurarine action and restricted diffusion within the synaptic cleft. J Physiol 294:365–386. 10.1113/jphysiol.1979.sp012935 - DOI - PMC - PubMed
    1. Baldwin DS (2002) Escitalopram: efficacy and tolerability in the treatment of depression. Hosp Med 63:668–671. 10.12968/hosp.2002.63.11.1912 - DOI - PubMed
    1. Beasley CM Jr, Nilsson ME, Koke SC, Gonzales JS (2000) Efficacy, adverse events, and treatment discontinuations in fluoxetine clinical studies of major depression: a meta-analysis of the 20-mg/day dose. J Clin Psychiatry 61:722–728. 10.4088/jcp.v61n1003 - DOI - PubMed
    1. Beatty Z, Muthusamy A, unger E, Dougherty DA, Tian L, Looger LL, Shivange AV, Bera K, Lester HA, Nichols A (2022) Fluorescence screens for identifying central nervous system–acting drug-biosensor pairs for subcellular and supracellular pharmacokinetics. Bio Protoc 12:e4551. 10.21769/BioProtoc.4551 - DOI - PMC - PubMed

Publication types

LinkOut - more resources