. 2023 Mar 3;14(1):1223.
doi: 10.1038/s41467-023-36664-0.

Polynucleotide phosphorylase protects against renal tubular injury via blocking mt-dsRNA-PKR-eIF2α axis

Affiliations

Polynucleotide phosphorylase protects against renal tubular injury via blocking mt-dsRNA-PKR-eIF2α axis

Yujie Zhu et al. Nat Commun. .

Abstract

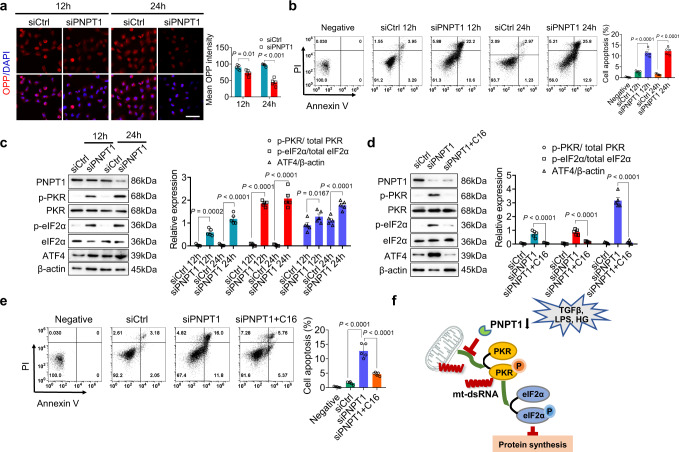
Renal tubular atrophy is a hallmark of chronic kidney disease. The cause of tubular atrophy, however, remains elusive. Here we report that reduction of renal tubular cell polynucleotide phosphorylase (PNPT1) causes renal tubular translation arrest and atrophy. Analysis of tubular atrophic tissues from renal dysfunction patients and male mice with ischemia-reperfusion injuries (IRI) or unilateral ureteral obstruction (UUO) treatment shows that renal tubular PNPT1 is markedly downregulated under atrophic conditions. PNPT1 reduction leads to leakage of mitochondrial double-stranded RNA (mt-dsRNA) into the cytoplasm where it activates protein kinase R (PKR), followed by phosphorylation of eukaryotic initiation factor 2α (eIF2α) and protein translational termination. Increasing renal PNPT1 expression or inhibiting PKR activity largely rescues IRI- or UUO-induced mouse renal tubular injury. Moreover, tubular-specific PNPT1-knockout mice display Fanconi syndrome-like phenotypes with impaired reabsorption and significant renal tubular injury. Our results reveal that PNPT1 protects renal tubules by blocking the mt-dsRNA-PKR-eIF2α axis.


Conflict of interest statement

The authors declared no competing interests.

Figures

Fig. 1
Fig. 1. Detection of cytosolic mt-dsRNAs in injured renal tubular cells.
a Immunostaining of cytosolic dsRNA by J2 antibody in tubule and glomerulus from acute tubular necrosis (ATN) patients and controls. Tissue sections were stained with anti-aquaporin 1 (AQP1) antibody (tubular cell) or anti-synaptopodin antibody (podocyte). b Quantification of cytosolic dsRNA levels in tubules and glomerulus (5 patients/group). c Immunostaining of dsRNA (J2) from 85 patients with various degrees of renal tubular injury, including ATN (5 males and 7 females), diabetic nephropathy (DN, 8 males and 6 females), IgA nephropathy (IgAN, 9 males and 7 females), lupus nephritis (LN, 5 males and 10 females), membranous nephropathy (MN, 8 males and 5 females) and focal segmental glomerulosclerosis (FSGS, 6 males and 9 females), as well as 5 non-renal tubular injury controls (3 males and 2 females). d Evaluation of tubular injury degree and cytosolic dsRNA levels. e Cytosolic dsRNA staining by J2 antibody in renal tubule from ischemia reperfusion-induced injury (IRI) or unilateral ureteral obstruction (UUO) mouse models. f Evaluation of renal tubular injury degree and cytosolic dsRNA levels in IRI or UUO mouse models. g Cytosolic mt-dsRNA levels in renal tubules of IRI and Sham mouse groups. h Renal tubular cytosolic levels of mt-dsRNAs detected using specific probes against the heavy and light strand (5 mice/group). Scale bars, 50 μm. The above experiments were successfully repeated three times. Two-way ANOVA with Sidak’s multiple comparisons test was performed in b, and the results were presented as mean ± SEM. In box plots (g, f), the centre line shows the median, lower and upper hinges of boxes represent 25th to 75th percentiles, and whiskers extend to minimum and maximum values. Source data are provided as a Source Data file.
Fig. 2
Fig. 2. Reduction of PNPT1 in injured renal tubule.
a Immunostaining of PNPT1 (red) in kidney sections from patients with various degrees of renal tubular injury or from non-renal tubular injury controls as previously described in Fig. 1. Renal tubules were stained with anti-AQP1 antibody (green). b Quantification of renal tubular PNPT1 level in patients and controls. Renal tissue samples were from 85 patients including ATN (5 males and 7 females), DN (8 males and 6 females), IgAN (9 males and 7 females), LN (5 males and 10 females), MN (8 males and 5 females) and FSGS (6 males and 9 females), as well as 5 non-renal tubular injury controls (3 males and 2 females). Images of 10 randomly selected regions per sample were obtained and analyzed. c Immunostaining of PNPT1 (red) in kidney sections from mice with or without IRI or UUO procedure. d Quantification of renal tubular PNPT1 levels in mice with or without IRI or UUO procedure (10 mice/group). e Top: Western blot (WB) of renal tubular PNPT1 in mice with or without IRI or UUO procedure. Bottom: quantification of protein levels from 3 independent WB experiments. Scale bars, 50 μm. The above experiments were successfully repeated three times. One-way ANOVA with Dunnett’s multiple comparisons test was performed in b, Tukey’s multiple comparisons test was performed in d, e, and the results were presented as mean ± SEM. Source data are provided as a Source Data file.
Fig. 3
Fig. 3. Reduction of PNPT1 in human renal tubular HK2 cells caused relocation of mt-dsRNAs into cytoplasm.
a Left: immunostaining of PNPT1 (green) and cytosolic dsRNA (J2, red) in HK2 cells treated with or without HG (40 mM, 7d), TGFβ1 (10 ng/mL, 48 h) or LPS (75 μg/mL, 24 h). Nuclei were stained with DAPI (blue). Right: quantification of PNPT1 and cytosolic dsRNA levels in HK2 cells. b Left: immunostaining of PNPT1 (green) and cytosolic dsRNA (J2, red) in HK2 cells treated with or without TGFβ1 (10 ng/mL, 48 h). Prior to TGFβ1 treatment, HK2 cells were infected with or without PNPT1-expressing lentivirus. Right: quantification of PNPT1 levels and cytosolic dsRNA in HK2 cells. c Left: immunostaining of dsRNA (J2, red) and PNPT1 (green) in HK2 cells transfected with PNPT1 siRNA-expressing plasmid (siPNPT1) or control oligonucleotide-expressing plasmid (siCtrl). Right: quantification of PNPT1 and cytosolic dsRNA levels in HK2 cells. d RT–qPCR analysis of cytosolic mt-dsRNAs in HK2 cells transfected with siPNPT1 or siCtrl plasmid. e Cytosolic levels of mt-dsRNAs detected using specific probes against their heavy and light strand in HK2 cells transfected with or without siPNPT1 plasmid. In situ staining of cytosolic mt-ND5 heavy (f) and light strand (g) in HK2 cells transfected with siPNPT1 or siCtrl plasmid. ATP5A1 served as a mitochondria marker. Scale bars, 50 μm. The above experiments were successfully repeated three times. Two-way ANOVA with Sidak’s multiple comparisons test was performed in ac. Two-tailed unpaired t test was performed for the statistical analyses in fg, and the results were presented as the mean ± SEM. Source data are provided as a Source Data file.
Fig. 4
Fig. 4. PNPT1 suppressed mt-dsRNA-mediated PKR-eIF2α signaling to prevent renal tubular injury.
a Left: measurement of total protein synthesis in HK2 cells transfected with siPNPT1 or siCtrl plasmid using Click-iT® Plus OPP Protein Synthesis Assay Kit. Right: quantification of OPP protein synthesis. b Time course of apoptosis of HK2 cells transfected with siPNPT1 or siCtrl plasmid. c Left: Western blot (WB) of p-PKR, p-eIF2α and ATF4 in HK2 cells infected with siPNPT1 or siCtrl plasmid. Right: quantification of protein levels. d Left: WB of p-PKR, p-eIF2α and ATF4 in HK2 cells with or without siPNPT1 lentivirus or PKR inhibitor C16. Right: quantification of protein levels. e Apoptosis of siPNPT1-transfected HK2 cells with or without PKR inhibitor C16 treatment. f Working model of renal tubular injury induced by mt-dsRNA-PKR-eIF2α axis. Scale bar, 50 μm. The above experiments were successfully repeated three times. One-way ANOVA with Tukey’s multiple comparisons test was performed in a, c, d. Two-way ANOVA with Tukey’s multiple comparisons test was performed in b, e. Results were presented as mean ± SEM. Image in f was created with BioRender.com. Source data are provided as a Source Data file.
Fig. 5
Fig. 5. Increasing PNPT1 expression in mouse renal tubule attenuated tubular injury.
a Top, schematic experimental approach of PNPT1-AAV infection in IRI mouse model. Bottom: WB analysis of renal tubular PNPT1 level (3 mice/group). b Left: renal tubular dsRNA (J2, red) staining in IRI mouse model with or without PNPT1 AAV infection. Right: quantification of renal tubular dsRNA level (8 mice/group). c Serum creatinine (top) and urinary KIM-1 levels (bottom) in IRI mouse model with or without PNPT1 AAV infection (5 mice/group). d Top: TUNEL assay of renal tubular apoptosis in IRI model mouse with or without PNPT1 AAV infection. Bottom: quantification of TUNEL assay (5 mice/group). e Top: schematic experimental approach of PNPT1-AAV infection in UUO mouse model. Bottom: WB analysis of renal tubular PNPT1 level (3 mice/group). f Left: renal tubular dsRNA (J2, red) staining in UUO mouse model with or without PNPT1 AAV infection. Right: quantification of renal tubular dsRNA level (8 mice/group). g Serum creatinine (left) and urinary KIM-1 levels (right) in UUO mouse model with or without PNPT1 AAV infection (5 mice/group). h Left: TUNEL assay of renal tubular apoptosis in UUO model mouse with or without PNPT1 AAV infection. Right: quantification of TUNEL assay (5 mice/group). Scale bars, 50 μm. The above experiments were successfully repeated three times. One-way ANOVA with Tukey’s multiple comparisons test was performed in ah and the results were presented as mean ± SEM. Images of mouse in a, e were created with BioRender.com. Source data are provided as a Source Data file.
Fig. 6
Fig. 6. Inhibition of PKR protected renal tubule against injury in experimental mouse models.
a Schematic of experimental approach in IRI mouse model with or without C16 treatment. b Left: WB of renal tubular p-PKR levels in IRI mouse model with or without C16 treatment. Right: quantification of renal tubular p-PKR levels (3 mice/group). c Left: Scr in IRI mouse model with or without C16 treatment. Right: urinary KIM-1 levels in IRI mouse model with or without C16 treatment (5 mice/group). d Left: H&E staining of kidney tissue sections from IRI mouse model with or without C16 treatment. Right: quantification of kidney disease score (5 mice/group). e Left: TUNEL assay of kidney tissue sections from IRI mouse model with or without C16 treatment. Right: quantification of apoptosis in kidney tissues (5 mice/group). f Schematic of experimental approach in UUO mice with or without C16 treatment. g Left: WB of renal tubular p-PKR levels in in UUO mice with or without C16 treatment. Right: quantification of renal tubular p-PKR levels (3 mice/group). h Left: Scr in UUO mouse model with or without C16 treatment. Right: urinary KIM-1 levels in UUO mice with or without C16 treatment (5 mice/group). i Left: H&E staining of kidney tissue sections from UUO mice with or without C16 treatment. Right: quantification of kidney disease score (5 mice/group). j Left: TUNEL assay of kidney tissue sections from UUO mice with or without C16 treatment. Right: quantification of apoptosis in kidney tissues (5 mice/group). Scale bars, 50 μm. The above experiments were successfully repeated three times. One-way ANOVA with Tukey’s multiple comparisons test was performed in be, gj and the results were presented as mean ± SEM. Images of mouse in a, f were created with BioRender.com. Source data are provided as a Source Data file.
Fig. 7
Fig. 7. Renal tubular-specific PNPT1-/- mice displayed impaired reabsorption and renal tubular injury.
a Top: genotype identification and PNPT1 levels in WT and renal tubular-specific PNPT1-KO (KO) mice. Bottom: immunofluorescence labeling and WB analysis of PNPT1 in WT and KO renal tubules. b Image of WT and KO mice. c Weight monitoring of WT and KO mice (7 mice /group). d Tubular injury score in WT and KO mice (5 mice/group, 8w). Arrows: injured tubules. e Left: Bone mineral density scanning of WT and KO mice. Right: quantification of bone mineral density (10 mice/group, 8w). f Levels of serum calcium and phosphorus (5 mice/group, 6-10w). g Urine level of glucose, uric acid, phosphorus and potassium in WT and KO mice (6 mice/group, 8w). h Kidney/body weight index (6 mice/group, 8w). i Serum creatinine (Scr, left) and levels of renal tubular injury markers (right) in WT and KO mice (5 mice/group, 8w). j Left: TEM image of mitochondrial damage in renal tubule from WT and KO mice. Right: quantification of renal tubular mitochondrial damage (5 mice/group, 8w). Arrows: injured mitochondria. k Left: Masson staining in kidney tissue sections from WT and KO mice. Right: quantification of renal fibrosis (5 mice/group, 8w). Arrows: fibrotic tubules. l Left: TUNEL assay of kidney tissue sections from WT and KO mice. Right: quantification of renal tubular apoptosis (5 mice/group, 8w). Arrows: apoptotic tubules. Scale bars in a, d, k, and l, 50 μm. Scale bar in j, 2 μm. The above experiments were successfully repeated three times. Two-tailed unpaired t test was performed for the statistical analyses in (d, e, g, h, jl), Two-way ANOVA with Sidak’s multiple comparisons test was performed in f, i, and the results were presented as the mean ± SEM. Source data are provided as a Source Data file.

References

    1. Levin A, et al. Global kidney health 2017 and beyond: a roadmap for closing gaps in care, research, and policy. Lancet. 2017;390:1888–1917. doi: 10.1016/S0140-6736(17)30788-2. - DOI - PubMed
    1. Liang X, et al. Glycogen synthase kinase 3beta hyperactivity in urinary exfoliated cells predicts progression of diabetic kidney disease. Kidney Int. 2020;97:175–192. doi: 10.1016/j.kint.2019.08.036. - DOI - PubMed
    1. Najafian B, Kim Y, Crosson JT, Mauer M. Atubular glomeruli and glomerulotubular junction abnormalities in diabetic nephropathy. J. Am. Soc. Nephrol. 2003;14:908–917. doi: 10.1097/01.ASN.0000057854.32413.81. - DOI - PubMed
    1. Gilbert RE. Proximal Tubulopathy: Prime Mover and Key Therapeutic Target in Diabetic Kidney Disease. Diabetes. 2017;66:791–800. doi: 10.2337/db16-0796. - DOI - PubMed
    1. Khan S, et al. Lipotoxic disruption of NHE1 interaction with PI(4,5)P2 expedites proximal tubule apoptosis. J. Clin. Invest. 2014;124:1057–1068. doi: 10.1172/JCI71863. - DOI - PMC - PubMed

Publication types

Substances