. 2023 Mar 3;14(1):1208.
doi: 10.1038/s41467-023-36897-z.

An autoimmune pleiotropic SNP modulates IRF5 alternative promoter usage through ZBTB3-mediated chromatin looping

Affiliations

An autoimmune pleiotropic SNP modulates IRF5 alternative promoter usage through ZBTB3-mediated chromatin looping

Zhao Wang et al. Nat Commun. .

Abstract

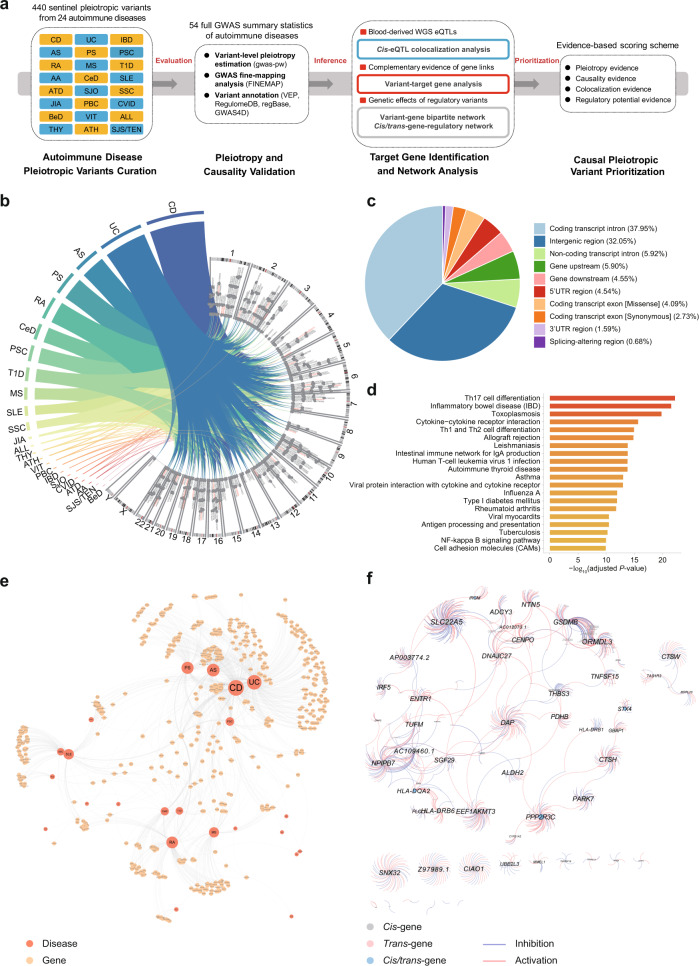
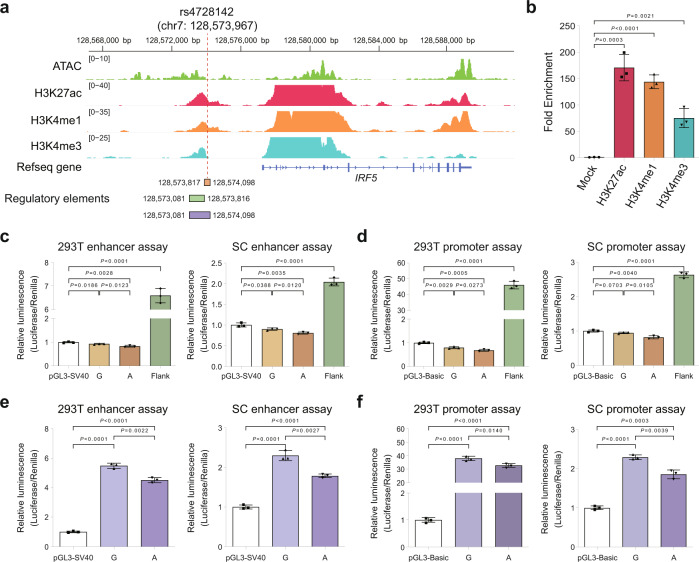
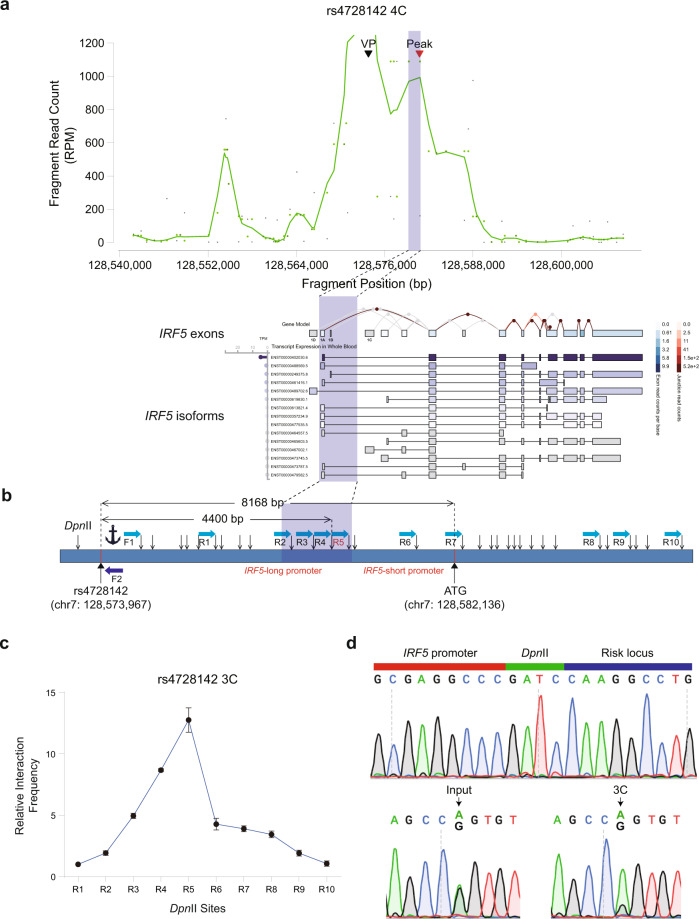
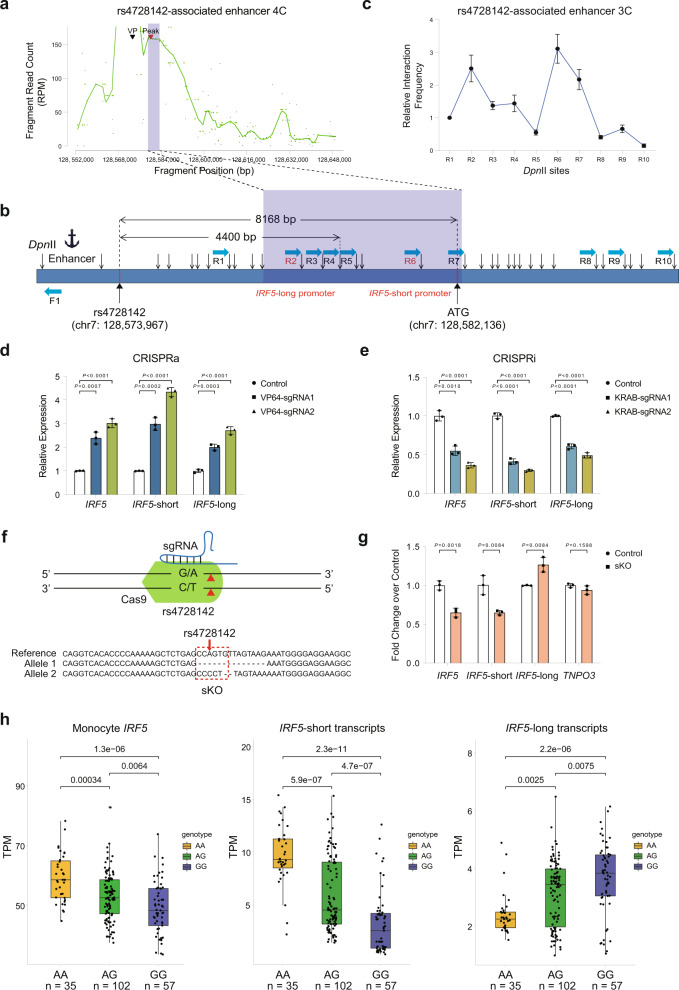
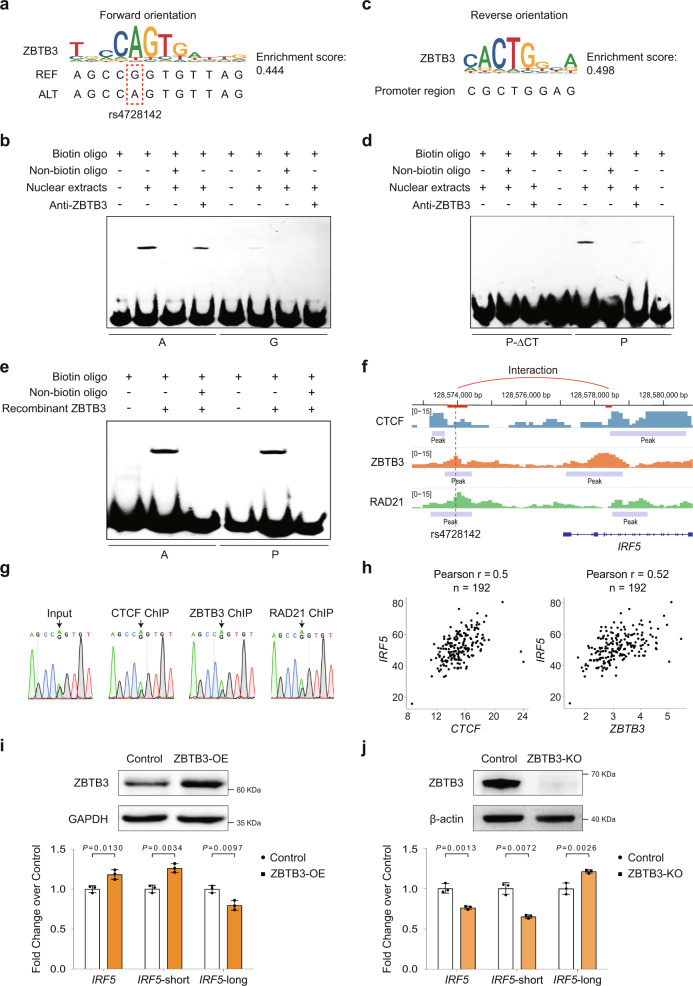
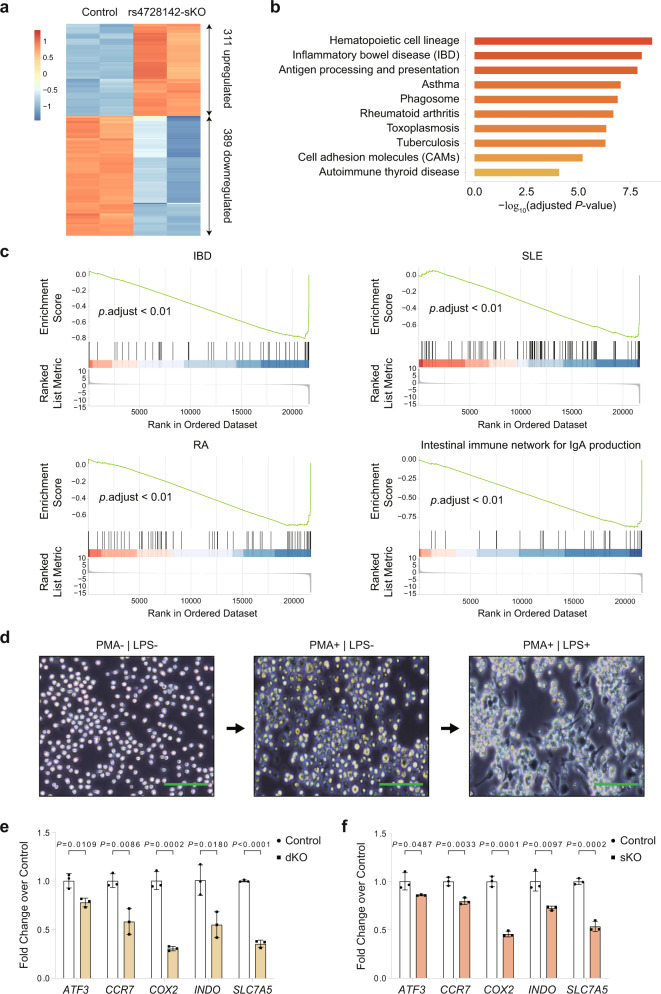
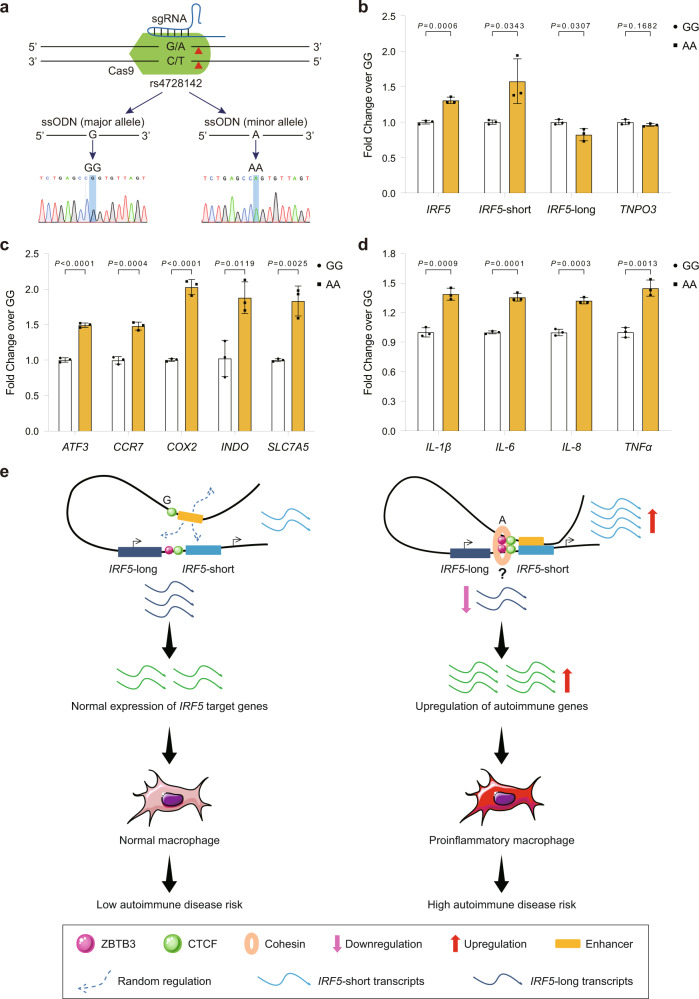
Genetic sharing is extensively observed for autoimmune diseases, but the causal variants and their underlying molecular mechanisms remain largely unknown. Through systematic investigation of autoimmune disease pleiotropic loci, we found most of these shared genetic effects are transmitted from regulatory code. We used an evidence-based strategy to functionally prioritize causal pleiotropic variants and identify their target genes. A top-ranked pleiotropic variant, rs4728142, yielded many lines of evidence as being causal. Mechanistically, the rs4728142-containing region interacts with the IRF5 alternative promoter in an allele-specific manner and orchestrates its upstream enhancer to regulate IRF5 alternative promoter usage through chromatin looping. A putative structural regulator, ZBTB3, mediates the allele-specific loop to promote IRF5-short transcript expression at the rs4728142 risk allele, resulting in IRF5 overactivation and M1 macrophage polarization. Together, our findings establish a causal mechanism between the regulatory variant and fine-scale molecular phenotype underlying the dysfunction of pleiotropic genes in human autoimmunity.


Conflict of interest statement

The authors declare no competing interests.

Figures

Fig. 1
Fig. 1. Functional annotation and target gene analysis of autoimmune disease-associated pleiotropic variants.
a Computational workflow for systematically functional annotation and prioritization of autoimmune disease-associated pleiotropic variants. GWAS genome-wide association studies, WGS whole-genome sequencing, eQTLs expression Quantitative Trait Loci. b Systematically curated genome-wide studies for identification of the potential pleiotropic or shared genetic loci associated with at least two autoimmune diseases. 440 sentinel pleiotropic variants for 24 autoimmune diseases from 12 genome-wide pleiotropy studies were collected and analyzed. Numbers and letters mark chromosome order numbers. Abbreviations for autoimmune diseases: CD Crohn’s disease, UC ulcerative colitis, AS ankylosing spondylitis, PS psoriasis, RA rheumatoid arthritis, CeD celiac disease, PSC primary sclerosing cholangitis, T1D type 1 diabetes, MS multiple sclerosis, SLE systemic lupus erythematosus, SSC systemic sclerosis, JIA juvenile idiopathic arthritis, ALL any allergies, THY thyroiditis, ATH asthma, VIT vitiligo, PBC primary biliary cirrhosis, IBD inflammatory bowel disease, SJO Sjogren’s syndrome, CVID common variable immunodeficiency, ATD autoimmune thyroid disease, AA alopecia areata, SJS/TEN Stevens–Johnson syndrome/toxic epidermal necrolysis, BeD Behcet’s disease. c Functional annotation and variant consequence distribution of the curated pleiotropic variants. UTR untranslated region. d Kyoto Encyclopedia of Genes and Genomes (KEGG) pathway enrichment analysis for all identified target genes affected by the pleiotropic variants, the overrepresentation test is used to calculate adjusted P value. e Genetic relationships among the investigated autoimmune diseases by constructing a bipartite network between the pleiotropic variants and their target genes. f Gene regulatory network for causal relationships of the autoimmune disease-associated genes using the Genotype-Tissue Expression (GTEx) whole blood cis/trans-eQTLs summary statistical information.
Fig. 2
Fig. 2. rs4728142 affects the activity of a promoter-like enhancer adjacent to IRF5 promoter.
a Assay of Transposase Accessible Chromatin sequencing (ATAC-seq), and H3K27ac, H3K4me1, and H3K4me3 Chromatin immunoprecipitation followed by sequencing (ChIP-seq) signals at the interferon regulatory factor 5 (IRF5) nearby region in SC cells, a human monocyte-derived cell line with heterozygote alleles (the nonrisk allele G and the risk allele A) at rs4728142. Red dotted line denotes the rs4728142 location. Sequence location information (GRCh37/hg19) for regulatory elements (including the rs4728142-containing sequence, the rs4728142-associated upstream enhancer sequence, and the integrated sequence) used in the luciferase assays is shown at the bottom of the graph. b ChIP enrichments of H3K27ac, H3K4me1, and H3K4me3 at the rs4728142-containing region in SC cells as determined by ChIP-qPCR. c, d Luciferase reporter assays utilizing vectors harboring the rs4728142-containing sequences with different alleles (G or A) or the upstream regulatory element (Termed Flank) for enhancer (c) or promoter (d) assay in 293T and SC cells. e, f Luciferase reporter assays utilizing vectors containing the integrated sequences harboring the upstream regulatory element and rs4728142-containing sequence with different alleles (G or A) for enhancer (e) or promoter (f) assay in 293T and SC cells. pGL3-Basic vector without a promoter was used for the promoter assay, and pGL3-Promoter vector with SV40 promoter was used for the enhancer assay. Luciferase signals were normalized to renilla signals. Data are represented as the means ± standard deviations (SD), n = 3 biologically independent samples, and unpaired two-tailed Student’s t test is used to calculate P values in (bf). Source data are provided as a Source Data file.
Fig. 3
Fig. 3. The rs4728142-containing region interacts with the IRF5 downstream alternative promoter in an allele-specific manner.
a Circularized Chromosome Conformation Capture (4C) assay for the rs4728142-containing region. RPM reads per million. VP (viewpoint) denotes the DpnII cutting fragment harboring rs4728142. Peak denotes the fragment with the highest interaction frequency. General location information (in the shadow) of the fragments with high interaction frequencies corresponding to the IRF5 downstream alternative promoter is shown in the bottom graph. IRF5 transcript diagram was extracted from the GTEx portal based on the GENCODE annotation. b A schematic view of Chromosome Conformation Capture (3C) assay at the rs4728142-containing region. The DpnII cutting fragment containing rs4728142 was measured as the bait indicated by an anchor, and a series of fragments downstream of rs4728142 were measured as preys. Blue rectangle denotes the chromosome, black arrows denote the DpnII cutting sites, light blue arrows denote the location and direction of primers, dark blue arrow “F2” denotes the reverse primer used in allele-specific detection, and “ATG” represents the common start codon in the second exon. c Enrichment quantification of 3C assay at the rs4728142-containing region normalized to control in SC cells. Data are represented as the means ± SD, and n = 3 biologically independent samples. Source data are provided as a Source Data file. d Sanger sequencing chromatograms of 3C ligation fragment (top) and rs4728142 locus from Input (bottom left) and 3C (bottom right) samples. Black arrows denote the rs4728142 location.
Fig. 4
Fig. 4. The rs4728142-containing region orchestrates chromatin looping to regulate IRF5 alternative promoter usage.
a 4C assay for the enhancer adjacent to the downstream rs4728142-containing region (rs4728142-associated enhancer). RPM reads per million. VP (viewpoint) denotes the DpnII cutting fragment harboring the rs4728142-associated enhancer. b A schematic view of 3C assay at the rs4728142-associated enhancer. The DpnII cutting fragment harboring the rs4728142-associated enhancer was measured as the bait indicated by an anchor, and the fragments downstream of the enhancer were measured as preys. Blue rectangle denotes the chromosome, black arrows denote the DpnII cutting sites, light blue arrows denote the location and direction of primers, and “ATG” represents the common start codon in the second exon. General location information (in the shadow) of the fragments with relatively high interaction frequencies corresponding to IRF5 promoters is highlighted. c Enrichment quantification of 3C assay at the rs4728142-associated enhancer normalized to control in SC cells. d, e IRF5 transcript expression in the rs4728142-associated enhancer activation or inhibition SC cells as determined by RT-qPCR. sgRNAs targeting the rs4728142-associated enhancer were used in CRISPR activation (CRISPRa) (d) and CRISPR interference (CRISPRi) (e) assays. f Strategy of rs4728142 single-knockout (sKO, top) and Sanger sequencing result as analyzed by CRISP-ID Web Portal (bottom). Red triangle denotes the cutting site, and red dotted box denotes the ZBTB3 core motif sequence. g IRF5 transcript expression in the rs4728142-sKO SC-Cas9 cells compared with the unedited SC-Cas9 cells (control) as determined by RT-qPCR. TNPO3 is the gene adjacent to the upstream IRF5 gene. h eQTL analysis for correlation between the rs4728142 genotype and IRF5 transcript expression using 194 monocyte RNA-seq samples from the BLUEPRINT dataset. Box and whisker plot; boxes depict the upper and lower quartiles of the data, and whiskers depict the range of the data. Data are represented as the means ± SD, n = 3 biologically independent samples, and unpaired two-tailed Student’s t test is used to calculate P values in (c, d, e, g). Source data are provided as a Source Data file.
Fig. 5
Fig. 5. ZBTB3 mediates the allele-specific chromatin looping to regulate IRF5-short transcript expression at the rs4728142 locus.
a ZBTB3 motif binding sequence at the rs4728142 locus with a forward orientation as analyzed by CIS-BP and FIMO. REF reference allele, ALT alternative allele. b EMSA assay for the sequences harboring rs4728142 with different alleles using SC nuclear extracts and anti-ZBTB3 antibody. c ZBTB3 motif binding sequence in the IRF5 downstream alternative promoter region possessing the highest interaction frequency with the rs4728142-containing region, has the reverse (convergent) orientation compared with the ZBTB3 motif at the rs4728142 locus. d EMSA assay for the sequences possessing the highest interaction frequency with the rs4728142-containing region using SC nuclear extracts and anti-ZBTB3 antibody. P-ΔCT denotes the sequence deleting CT in the ZBTB3 core motif. e EMSA assay for the sequence harboring rs4728142-A and the sequence possessing the highest interaction frequency with the rs4728142-containing region using ZBTB3 recombinant protein. f CTCF, ZBTB3, and RAD21 ChIP-seq signals at the IRF5 nearby region in SC cells. Highlighted boxes denote the rs4728142-containing 3C/4C viewpoint and its highest interaction frequency region. g Sanger sequencing chromatograms of CTCF, ZBTB3, and RAD21 ChIP-qPCR at the rs4728142 locus. h Correlation analysis of CTCF and ZBTB3 with IRF5 expression using RNA-seq data of 194 human CD14+ monocyte samples from the BLUEPRINT dataset. i Western blotting for validating the ZBTB3 overexpression (ZBTB3-OE) and RT-qPCR for detecting the IRF5 transcript expression in ZBTB3-OE SC cells compared with the SC cells transfected with empty vector (control). j Western blotting for validating the ZBTB3 knockout (ZBTB3-KO) and RT-qPCR for detecting the IRF5 transcript expression in ZBTB3-KO SC-Cas9 cells compared with the unedited SC-Cas9 cells (control). Each experiment was repeated three times independently with similar results. Data are represented as the means ± SD, n = 3 biologically independent samples, and unpaired two-tailed Student’s t test is used to calculate P values in (i, j). Source data are provided as a Source Data file.
Fig. 6
Fig. 6. rs4728142 modulates the autoimmune disease-related signaling pathways and macrophage M1 polarization.
a Heatmap of the differentially expressed genes between the rs4728142 single-knockout (sKO) and unedited SC-Cas9 cells (control) as measured by RNA-seq (adjusted P value <0.05 and |Log2Fold Change| >1). b Top ten enriched Kyoto Encyclopedia of Genes and Genomes (KEGG) pathways associated with the differentially expressed genes after the rs4728142 locus disruption. Pathways were ranked by –log10 (adjusted P value). c Top significant gene set enrichment analysis (GSEA) with the differentially expressed genes after the rs4728142 locus disruption. Many sKO-affected genes in the autoimmune disease-related gene sets were enriched for the downregulated genes. IBD inflammatory bowel disease, SLE systemic lupus erythematosus, RA rheumatoid arthritis. d Induction of monocyte-derived M1 macrophages. SC cells with high activities (left) were induced under 50 ng/µl phorbol 12-myristate 13-acetate (PMA). After inducing the cells for 2 days (middle), lipopolysaccharide (LPS, final concentration: 100 ng/µl) was added, and then the cells were cultured for 2 days (right). Scale bars, 100 µm. e, f Expression of M1 macrophage polarization markers (ATF3, CCR7, COX2, INDO, and SLC7A5) in the rs4728142 double-knockout (dKO) (e) or rs4728142-sKO (f) induced cells compared with the unedited SC-Cas9 induced cells (GA, control) as determined by RT-qPCR. Data are represented as the means ± SD, n = 3 biologically independent samples, and unpaired two-tailed Student’s t test is used to calculate P values in (e, f). Source data are provided as a Source Data file.
Fig. 7
Fig. 7. A model depicting the function and molecular mechanism of rs4728142 in autoimmune diseases.
a Strategy of single-base editing by CRISPR knock-in technology. The sKO sgRNA and single-stranded donor oligonucleotides (ssODN) with major allele G or minor allele A were co-transfected into the single cell-derived SC-Cas9 cells, and single cells were sorted for identification by Sanger sequencing. The red triangle denotes the cutting site. b RT-qPCR for IRF5 transcript expression in rs4728142-AA SC cells compared with rs4728142-GG SC cells. TNPO3 is the gene adjacent to the upstream IRF5 gene. c RT-qPCR for M1 polarization markers (ATF3, CCR7, COX2, INDO, and SLC7A5) in rs4728142-AA-induced SC cells compared with rs4728142-GG-induced SC cells. d RT-qPCR for key M1 proinflammatory cytokines (IL-1β, IL-6, IL-8, and TNFα) in rs4728142-AA-induced SC cells compared with rs4728142-GG-induced SC cells. e A model depicting the function and molecular mechanism of rs4728142 in autoimmune diseases. In nonrisk allele status of rs4728142-G, the upstream promote-like enhancer could freely regulate different IRF5 alternative promoters or other genes without insulation. However, rs4728142-A steadily establishes specific regulation of the rs4728142-associated enhancer on IRF5-short promoter through ZBTB3-mediated chromatin looping. This elaborate regulation of IRF5 promoter usage leads to increases in both IRF5-short transcripts and ensemble gene expression of IRF5, ultimately resulting in monocytes/macrophage dysfunction and high autoimmune disease risk. Question mark denotes undetermined ZBTB3 functional manner in the loop formation. Data are represented as the means ± SD, n = 3 biologically independent samples, and unpaired two-tailed Student’s t test is used to calculate P values in (bd). Source data are provided as a Source Data file.

Comment in

Similar articles

Cited by

References

    1. Najarian DJ, Gottlieb AB. Connections between psoriasis and Crohn’s disease. J. Am. Acad. Dermatol. 2003;48:805–821. doi: 10.1067/mjd.2003.540. - DOI - PubMed
    1. Loftus EV, et al. PSC-IBD: a unique form of inflammatory bowel disease associated with primary sclerosing cholangitis. Gut. 2005;54:91–96. doi: 10.1136/gut.2004.046615. - DOI - PMC - PubMed
    1. Solovieff N, Cotsapas C, Lee PH, Purcell SM, Smoller JW. Pleiotropy in complex traits: challenges and strategies. Nat. Rev. Genet. 2013;14:483–495. doi: 10.1038/nrg3461. - DOI - PMC - PubMed
    1. Cotsapas C, et al. Pervasive sharing of genetic effects in autoimmune disease. PLoS Genet. 2011;7:e1002254. doi: 10.1371/journal.pgen.1002254. - DOI - PMC - PubMed
    1. Li YR, et al. Meta-analysis of shared genetic architecture across ten pediatric autoimmune diseases. Nat. Med. 2015;21:1018–1027. doi: 10.1038/nm.3933. - DOI - PMC - PubMed

Publication types