. 2023 Mar 3;14(1):1212.
doi: 10.1038/s41467-023-36868-4.

Key innovations and the diversification of Hymenoptera

Affiliations

Key innovations and the diversification of Hymenoptera

Bonnie B Blaimer et al. Nat Commun. .

Abstract

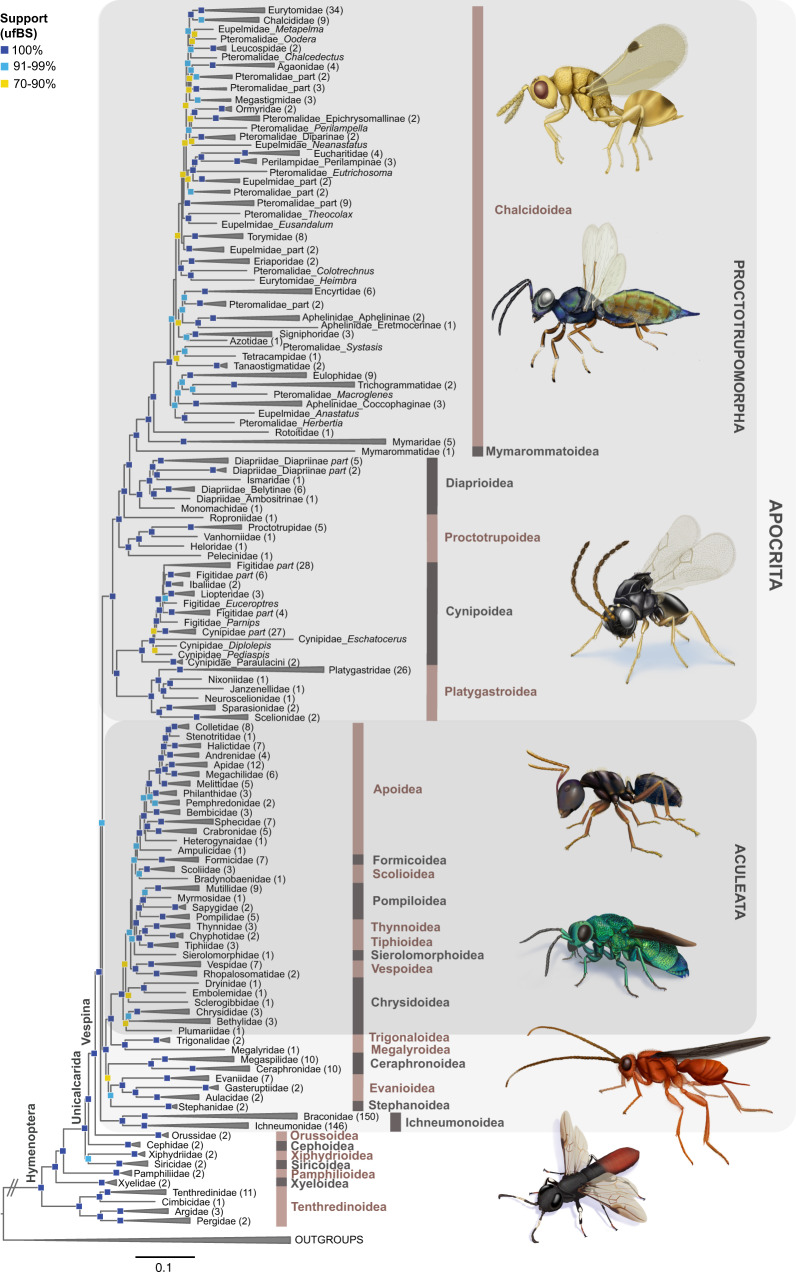
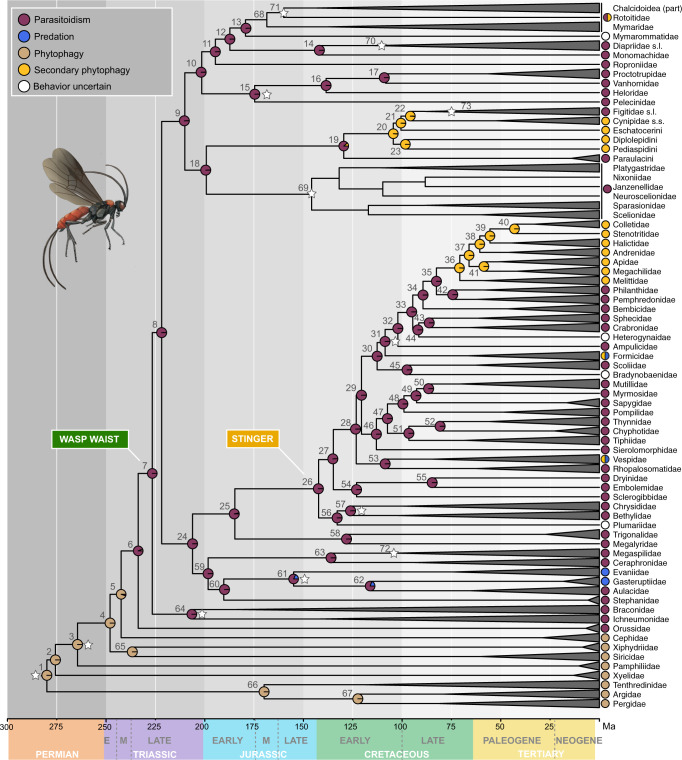
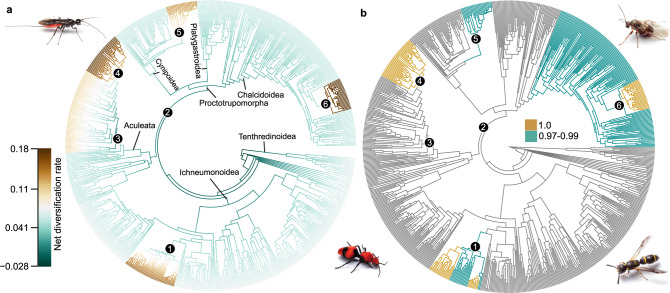
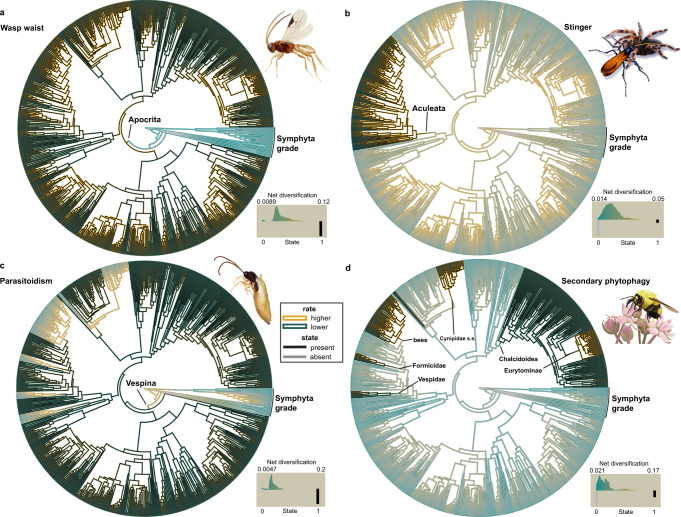
The order Hymenoptera (wasps, ants, sawflies, and bees) represents one of the most diverse animal lineages, but whether specific key innovations have contributed to its diversification is still unknown. We assembled the largest time-calibrated phylogeny of Hymenoptera to date and investigated the origin and possible correlation of particular morphological and behavioral innovations with diversification in the order: the wasp waist of Apocrita; the stinger of Aculeata; parasitoidism, a specialized form of carnivory; and secondary phytophagy, a reversal to plant-feeding. Here, we show that parasitoidism has been the dominant strategy since the Late Triassic in Hymenoptera, but was not an immediate driver of diversification. Instead, transitions to secondary phytophagy (from parasitoidism) had a major influence on diversification rate in Hymenoptera. Support for the stinger and the wasp waist as key innovations remains equivocal, but these traits may have laid the anatomical and behavioral foundations for adaptations more directly associated with diversification.


Conflict of interest statement

The authors declare no competing interests.

Figures

Fig. 1
Fig. 1. Family-level phylogeny of Hymenoptera.
Phylogeny shows relationships between hymenopteran families as estimated from 446 UCE loci in the nuc-70%-SWSC analysis. This data set was partitioned using the Sliding-Window Site Characteristics Entropy (SWSC-EN) algorithm and PartitionFinder2 in combination with the r cluster algorithm and analyzed using Maximum Likelihood (ML) best-tree and ultrafast bootstrap searches in IQ-TREE v1.6.10. This result is referred to as topology C-1 (topC-1) throughout the text and the remaining figures and tables. Various nodes have been collapsed for clarity of display, with numbers of species subtended by the respective branches included in brackets. Ultrafast bootstrap (ufBS) support values are indicated by colored squares on respective nodes: dark blue = 100%, light blue = 91–99%, and yellow = 70–90%. Support values lower than ufBS = 70 are not shown. Scalebar represents substitutions/bp. Source data for this figure can be found in the Dryad repository at 10.5061/dryad.08kprr54m (folder 2.1.7).
Fig. 2
Fig. 2. Timeline and evolution of parasitoidism in Hymenoptera.
Chronogram estimated using approximate likelihood in MCMCTREE with the PAMLv4.9 package from the nuc-70% matrix and topology C-1. All outgroups were pruned from the tree and alignment prior to divergence time estimation. Twelve calibration points were used, which are indicated by a white star. Terminals have been collapsed down to family or clade-level post analysis. Families of Platygastroidea are shown in the chronogram, but were lumped at the superfamily level for ancestral state reconstructions; therefore, pies are absent in this clade. Ancestral state reconstructions with corHMM were estimated from topology C-1 and mapped in pie format onto the chronogram; states for terminals are indicated beside terminal branches. Divergence estimates and ancestral state probabilities can be accessed in Supplementary Data 6 and 8, referring to numbers beside nodes. Pie states are red = parasitoid, blue = predatory, brown = phytophagous, yellow = secondarily phytophagous, and white = behavior unknown. For detailed information on methodology and results, also refer to the main text and the Supplementary Methods. Source data for this figure can be found in the Dryad repository at 10.5061/dryad.08kprr54m (folder 2.2.2).
Fig. 3
Fig. 3. Diversification history of Hymenoptera.
We assessed potential shifts in diversification rates over time in Hymenoptera using a sampling fraction approach and clade-specific sampling probabilities in BAMM v2.5, and the associated R package BAMMtools v2.1.7. All analyses shown are based on topology C-1. a Plot of best shift configuration with maximum a posteriori probability (MAP), indicating rate shifts on respective branches. Rates are shown as net diversification rates. Since this rate shift configuration only has a 0.019 probability among 9910 distinct shift configurations in the 95% credibility set, we summarized the cumulative probabilities for each branch that a shift occurred somewhere between the focal branch and the root of the tree. b Cumulative shift probability tree, indicating in dark cyan the branches with a shift probability ≥0.97 ≤ 0.99 and in gold the branches with a cumulative shift probability = 1. Golden branches thus occur in every distinct shift configuration and cyan branches in 97–99% of all distinct shift configurations. Numbered clades/shifts are (1) Ichneumonidae (internal); (2) Apocrita minus Ichneumonoidea; (3) Aculeata minus Chrysidoidea; (4) Bees minus Melittidae; (5) Cynipidae s.s.; (6) Eurytomidae (Eurytominae). For detailed information on methodology and results, refer to the main text, Supplementary Methods, and Supplementary Data 9 and 16. Images of wasps courtesy of Matt Bertone. Source data for this figure can be found in the Dryad repository at 10.5061/dryad.08kprr54m (folder 3.2).
Fig. 4
Fig. 4. Trait-dependent diversification analyses.
We tested 30 models of trait-dependent and trait-independent diversification in the HiSSE framework for the four putative key innovations and plotted net diversification rates and state reconstructions from the best-fitting model onto the Hymenoptera phylogeny. All results shown were based on topology C-1. Inner branch colors represent the presence/absence of the respective states (black = presence; gray = absence); outer branch colors represent the net diversification rate (highest = gold, lowest = dark cyan). Clades discussed in the context of the results are labeled. The histograms in the lower right of each panel represent the distribution of net diversification rates associated with the observed states (0 = absent, 1 = present). a Wasp waist, model: HiSSE—full, irreversible states; b Stinger, model: CID-4−9 distinct transition rates; c Parasitoidism, model: HiSSE—full, all free parameters; d Secondary phytophagy, model: HiSSE—full, irreversible states. Best-fitting models for the wasp waist (a), parasitoidism (c), and secondary phytophagy (d) are trait-dependent models that suggest the association of a hidden state with the analyzed traits influencing diversification in Hymenoptera. The best-fitting model for the stinger (b) is a trait-independent model. For detailed information on methodology, results, and model scores, refer to the main text, Supplementary Methods, and Supplementary Data 10–12 and 16–17. Source data for this figure can be found in the Dryad repository at 10.5061/dryad.08kprr54m (folder 3.3).

Similar articles

Cited by

References

    1. Heard SB, Hauser DL. Key evolutionary innovations and their ecological mechanisms. Hist. Biol. 1995;10:151–173. doi: 10.1080/10292389509380518. - DOI
    1. Hunter JP. Key innovations and the ecology of macroevolution. Trends Ecol. Evol. 1998;13:31–36. doi: 10.1016/S0169-5347(97)01273-1. - DOI - PubMed
    1. Schweizer M, Seehausen O, Hertwig ST. Macroevolutionary patterns in the diversification of parrots: effects of climate change, geological events and key innovations. J. Biogeogr. 2011;38:2176–2194. doi: 10.1111/j.1365-2699.2011.02555.x. - DOI
    1. Salzburger W, Mack T, Verheyen E, Meyer A. Out of Tanganyika: genesis, explosive speciation, key-innovations and phylogeography of the haplochromine cichlid fishes. BMC Evol. Biol. 2005;5:17. doi: 10.1186/1471-2148-5-17. - DOI - PMC - PubMed
    1. Chouvenc T, Šobotník J, Engel MS, Bourguignon T. Termite evolution: mutualistic associations, key innovations, and the rise of Termitidae. Cell. Mol. Life Sci. 2021;78:2749–2769. doi: 10.1007/s00018-020-03728-z. - DOI - PMC - PubMed

Publication types