

Effect of Fc core fucosylation and light chain isotype on IgG1 flexibility
- PMID: 36869088
- PMCID: PMC9982779
- DOI: 10.1038/s42003-023-04622-7
Effect of Fc core fucosylation and light chain isotype on IgG1 flexibility
Abstract
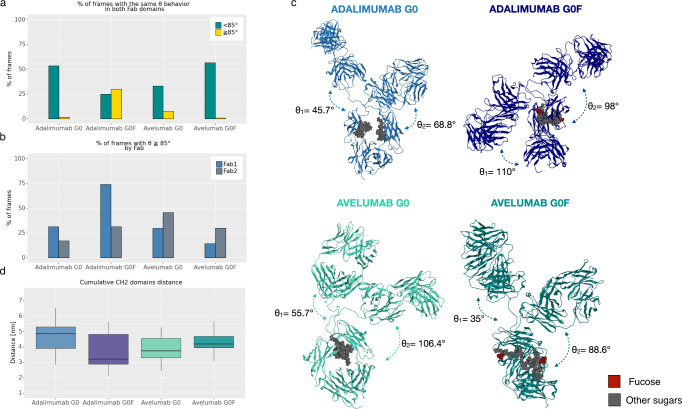
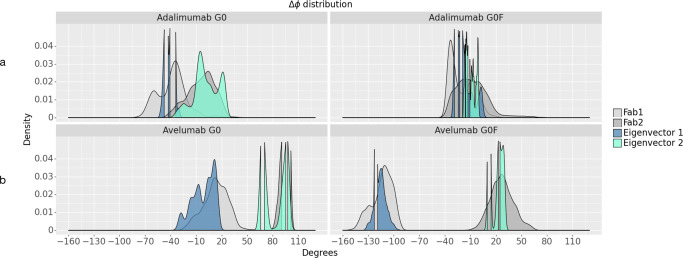
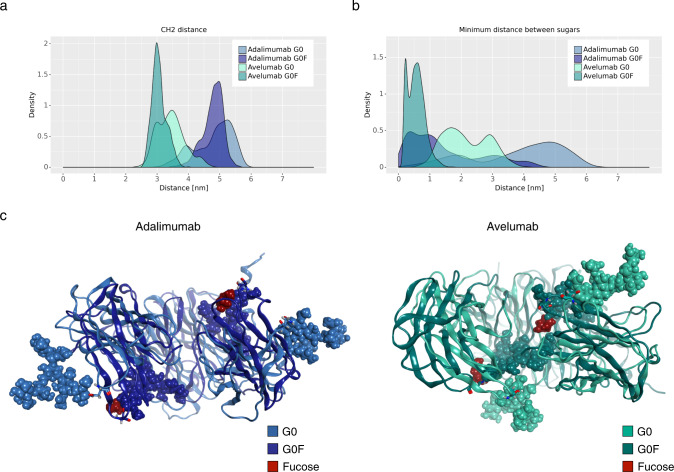
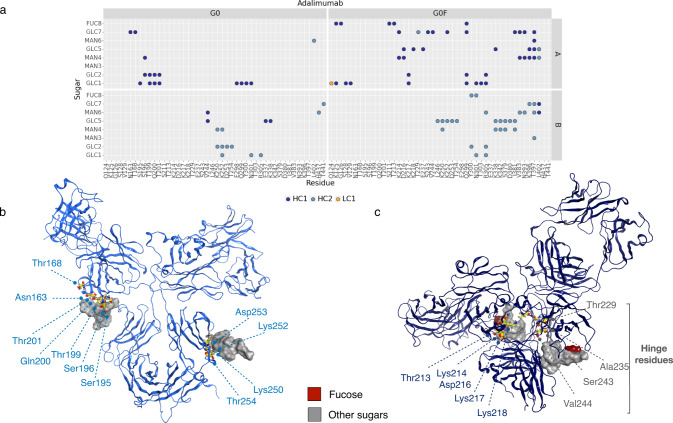
N-glycosylation plays a key role in modulating the bioactivity of monoclonal antibodies (mAbs), as well as the light chain (LC) isotype can influence their physicochemical properties. However, investigating the impact of such features on mAbs conformational behavior is a big challenge, due to the very high flexibility of these biomolecules. In this work we investigate, by accelerated molecular dynamics (aMD), the conformational behavior of two commercial immunoglobulins G1 (IgG1), representative of κ and λ LCs antibodies, in both their fucosylated and afucosylated forms. Our results show, through the identification of a stable conformation, how the combination of fucosylation and LC isotype modulates the hinge behavior, the Fc conformation and the position of the glycan chains, all factors potentially affecting the binding to the FcγRs. This work also represents a technological enhancement in the conformational exploration of mAbs, making aMD a suitable approach to clarify experimental results.
© 2023. The Author(s).
Conflict of interest statement
The authors declare no competing interests.
Figures


Similar articles
-
Antibody Fucosylation Lowers the FcγRIIIa/CD16a Affinity by Limiting the Conformations Sampled by the N162-Glycan.ACS Chem Biol. 2018 Aug 17;13(8):2179-2189. doi: 10.1021/acschembio.8b00342. Epub 2018 Jul 27. ACS Chem Biol. 2018. PMID: 30016589 Free PMC article.
-
Role of Fc Core Fucosylation in the Effector Function of IgG1 Antibodies.Front Immunol. 2022 Jun 30;13:929895. doi: 10.3389/fimmu.2022.929895. eCollection 2022. Front Immunol. 2022. PMID: 35844552 Free PMC article. Review.
-
Conformational effects of N-glycan core fucosylation of immunoglobulin G Fc region on its interaction with Fcγ receptor IIIa.Sci Rep. 2017 Oct 23;7(1):13780. doi: 10.1038/s41598-017-13845-8. Sci Rep. 2017. PMID: 29062024 Free PMC article.
-
IgG1 conformational behavior: elucidation of the N-glycosylation role via molecular dynamics.Biophys J. 2021 Dec 7;120(23):5355-5370. doi: 10.1016/j.bpj.2021.10.026. Epub 2021 Oct 26. Biophys J. 2021. PMID: 34710380 Free PMC article.
-
The "less-is-more" in therapeutic antibodies: Afucosylated anti-cancer antibodies with enhanced antibody-dependent cellular cytotoxicity.MAbs. 2018 Jul;10(5):693-711. doi: 10.1080/19420862.2018.1466767. MAbs. 2018. PMID: 29733746 Free PMC article. Review.
Cited by
-
In silico evaluation of the role of Fab glycosylation in cetuximab antibody dynamics.Front Immunol. 2024 Aug 8;15:1429600. doi: 10.3389/fimmu.2024.1429600. eCollection 2024. Front Immunol. 2024. PMID: 39185413 Free PMC article.
-
Light Chain Isotype and Antibody-Specificity Impact on Virus Neutralization.Antibodies (Basel). 2025 Jun 17;14(2):50. doi: 10.3390/antib14020050. Antibodies (Basel). 2025. PMID: 40558104 Free PMC article.
