. 2023 Mar 3;14(1):1210.
doi: 10.1038/s41467-023-36914-1.

The Wnt/TCF7L1 transcriptional repressor axis drives primitive endoderm formation by antagonizing naive and formative pluripotency

Affiliations

The Wnt/TCF7L1 transcriptional repressor axis drives primitive endoderm formation by antagonizing naive and formative pluripotency

Paraskevi Athanasouli et al. Nat Commun. .

Abstract

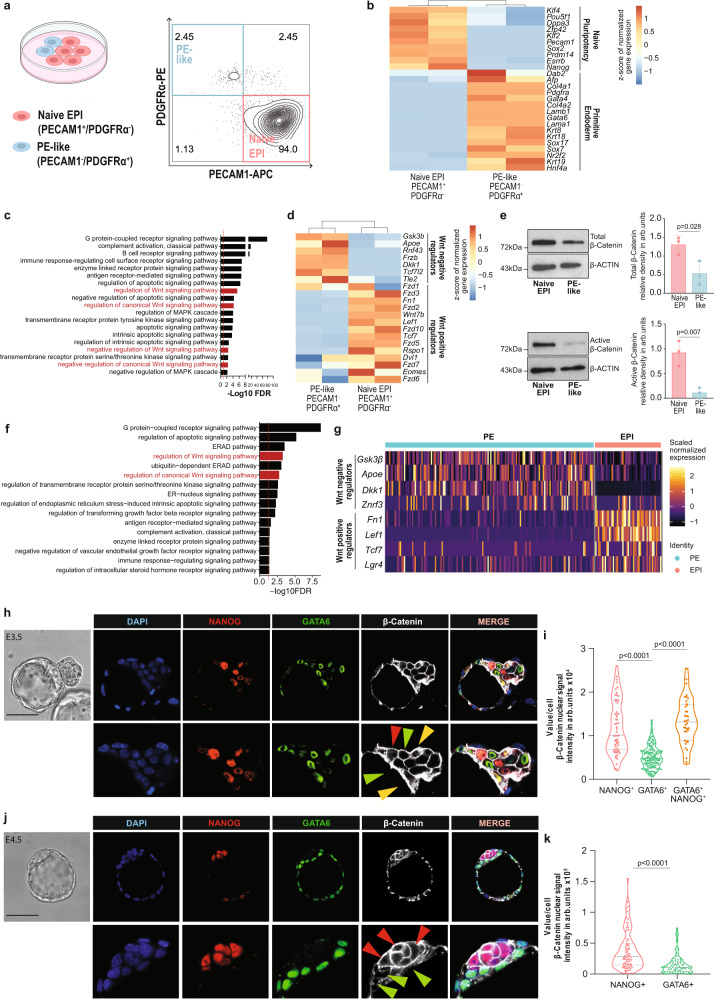
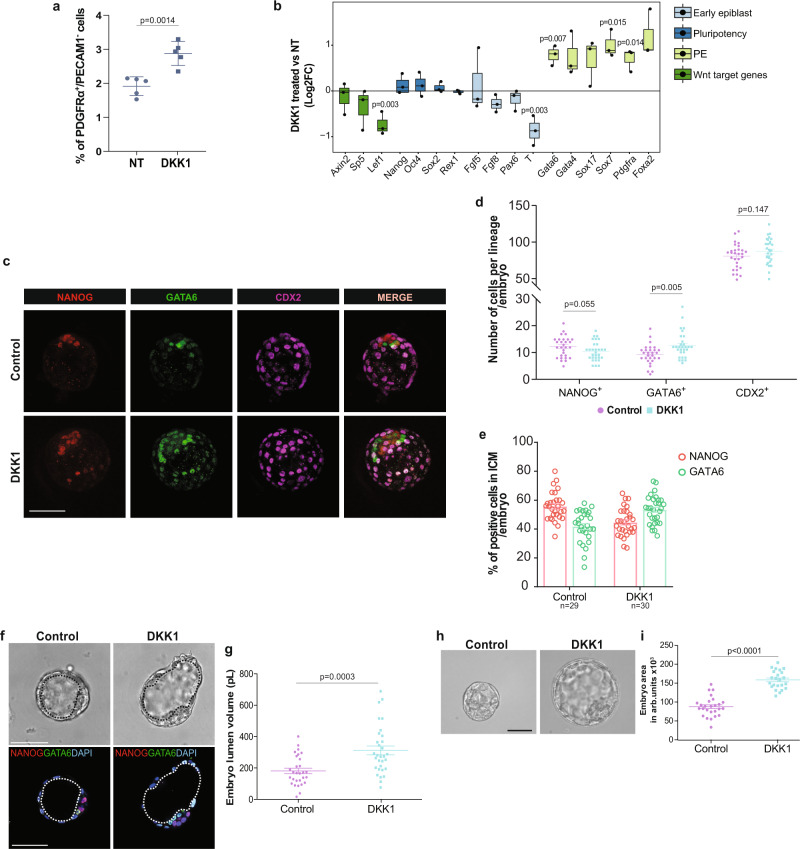
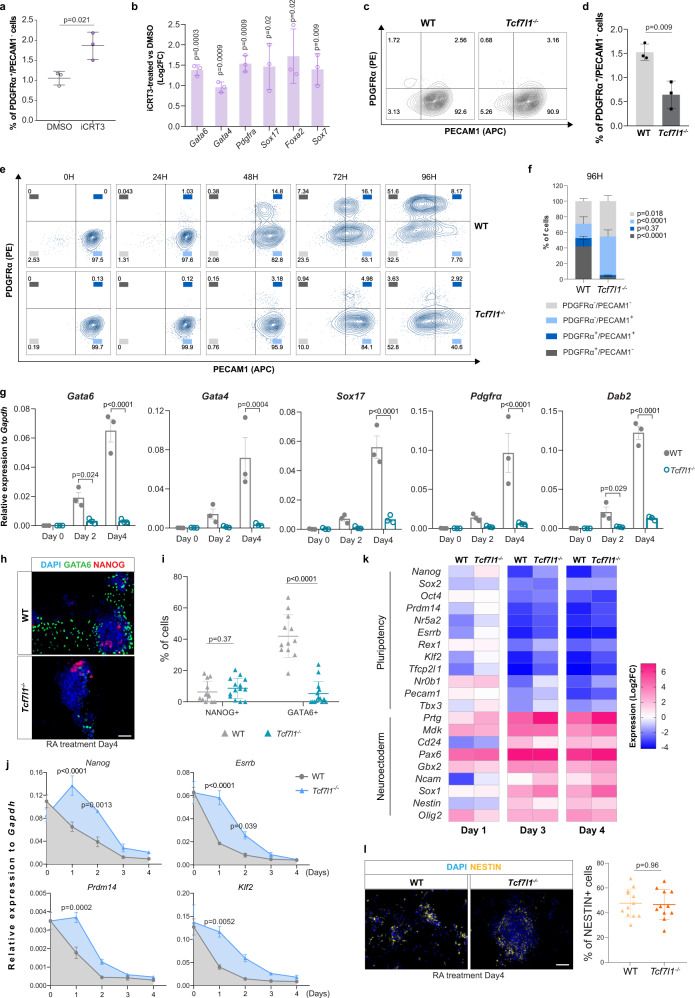
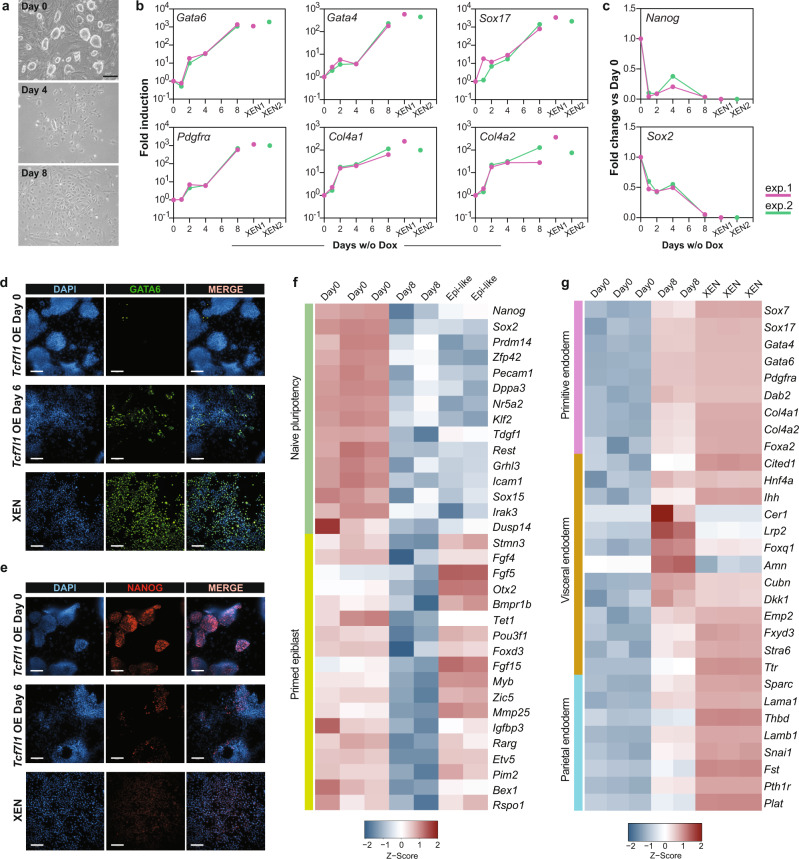
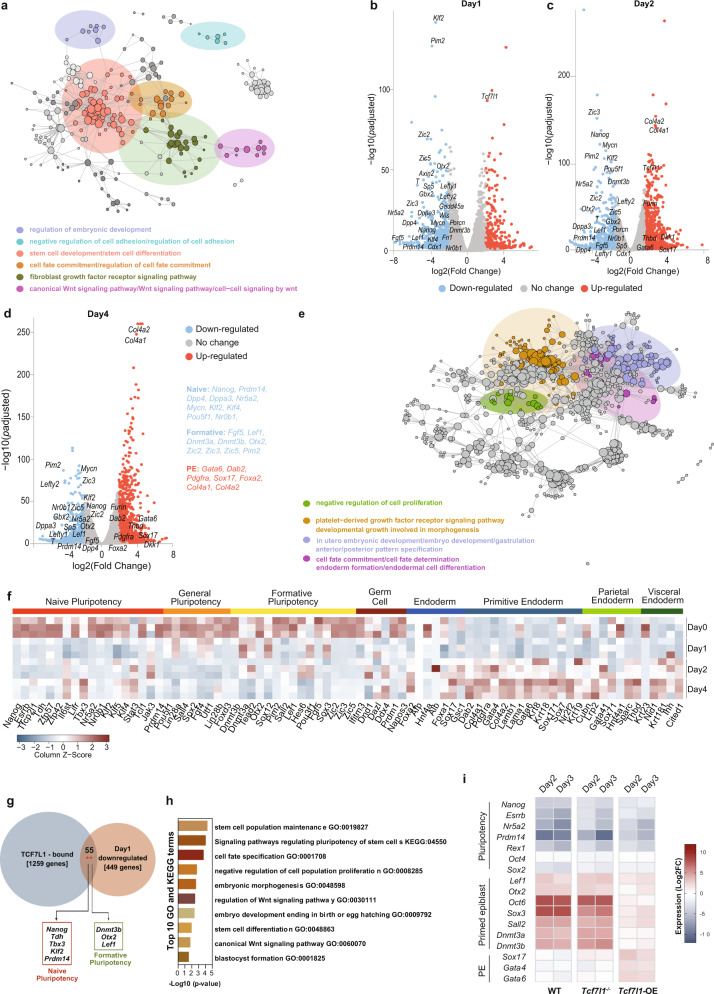
Early during preimplantation development and in heterogeneous mouse embryonic stem cells (mESC) culture, pluripotent cells are specified towards either the primed epiblast or the primitive endoderm (PE) lineage. Canonical Wnt signaling is crucial for safeguarding naive pluripotency and embryo implantation, yet the role and relevance of canonical Wnt inhibition during early mammalian development remains unknown. Here, we demonstrate that transcriptional repression exerted by Wnt/TCF7L1 promotes PE differentiation of mESCs and in preimplantation inner cell mass. Time-series RNA sequencing and promoter occupancy data reveal that TCF7L1 binds and represses genes encoding essential naive pluripotency factors and indispensable regulators of the formative pluripotency program, including Otx2 and Lef1. Consequently, TCF7L1 promotes pluripotency exit and suppresses epiblast lineage formation, thereby driving cells into PE specification. Conversely, TCF7L1 is required for PE specification as deletion of Tcf7l1 abrogates PE differentiation without restraining epiblast priming. Taken together, our study underscores the importance of transcriptional Wnt inhibition in regulating lineage specification in ESCs and preimplantation embryo development as well as identifies TCF7L1 as key regulator of this process.


Conflict of interest statement

The authors declare no competing interests.

Figures

Fig. 1
Fig. 1. EPI and PE populations show differential Wnt pathway activity in vitro and in embryos.
a (Left) Schematic representation of mESCs heterogeneity. Created with BioRender.com. (Right) Flow cytometry density plot of mESC populations co-stained for PECAM1 and PDGFRα. b Expression of EPI and PE specific markers by PECAM1+ and PDGFRα + sorted cell populations, respectively. Unsupervised clustering. n = 2 independent samples per condition. c GO enrichment analysis of DEGs between naive EPI and PE-like sorted cell populations. Red dashed line=FDR 0.05. d Expression of Wnt positive and negative regulators in naive EPI and PE-like sorted cell populations. Unsupervised clustering. n = 2 independent samples per condition. e (Left) Representative images and (right) quantification of total/active β-Catenin levels in naive EPI and PE-like sorted cell populations. Mean ± SD; n = 3 biologically independent samples; two-tailed unpaired t test. f GO enrichment analysis of DEGs between EPI and PE cells in E4.5 embryos from. Red dashed line = FDR 0.05. g Expression of Wnt positive and negative regulators in EPI and PE lineages in E4.5 embryos. h Representative immunofluorescence (IF) image of active β-Catenin signal in E3.5 embryo. EPI-NANOG+ cells (red arrow), PE-GATA6+ cells (green arrow) and double-positive NANOG+/GATA6+ cells (yellow arrow). Scale bar=50 μM. Zoomed region of interest is reported below the images. i Nuclear active β-Catenin signal in EPI-NANOG+, PE-GATA6+ and double-positive NANOG+/GATA6+ cells. Integrated intensity in arbitrary units (arb. units). NANOG+ n = 38, GATA6+ n = 111 and NANOG+/GATA6+ n = 58 cells; 2 independent experiments; one-way ANOVA test. j Representative IF image of active β-Catenin signal in freshly isolated E4.5 embryo. EPI-NANOG+ cells (red arrow), PE-GATA6+ cells (green arrow). Scale bar = 50 μM. Zoomed region of interest is reported below the images. k Nuclear active β-Catenin signal in EPI-NANOG+ and PE-GATA6+ cells. Integrated intensity in arbitrary units (arb. units). NANOG+ n = 78; GATA6+ n = 68 cells; 2 independent experiments; two-tailed unpaired t test. Source data for all experiments are provided as a Source data file.
Fig. 2
Fig. 2. Wnt signaling inhibition promotes a shift towards the PE fate.
a Percentage of PE-like cells (PDGFRα+/PECAM1-) in control and DKK1-treated mESCs. Mean ± SD; n = 5 independent experiments, two-tailed unpaired t test. b Gene expression analysis of early EPI, pluripotency, PE and Wnt target genes on control and DKK1-treated mESCs. Horizontal line denotes the median value, box refers to the 25th to 75th percentiles and whiskers mark min and max values. n = 3 independent experiments; two-tailed unpaired t test. c Representative IF image of NANOG, GATA6 and CDX2 protein signals in E2.5 + 48H control and DKK1 treated embryo. Scale bar = 50 μM. d Number of NANOG+,GATA6+ and CDX2+ cells (counts) per embryo. Mean ± SEM; Control: n = 29; DKK1 n = 30; 3 independent experiments; multiple unpaired t tests with Holm-Sidak method. e Percentage of NANOG+ and GATA6+ cells normalized on total number of ICM per embryo. Mean ± SEM; Ctrl n = 29, DKK1 n = 30; 3 independent experiments. f Representative BF and IF image of E2.5 + 48H control and DKK1 treated embryo. Black and white dotted lines delimitate blastocyst cavity (lumen). Scale bar = 50 μM. g Embryo lumen volume reported in pico liters (pL). Μean ± SEM; Ctrl n = 29, DKK1 n = 31; 3 independent experiments. two-tailed unpaired t test. h Representative brightfield (BF) image of embryo morphology. Scale bar = 50 μM. i Embryo total area reported in arb. units Μean ± SEM; Ctrl n = 26, DKK1 n = 23; 3 independent experiments, two-tailed unpaired t test. Source data for all experiments are provided as a Source data file.
Fig. 3
Fig. 3. Tcf7l1 deletion impairs PE transition without preventing pluripotency exit and neuroectodermal differentiation.
a Percentage of PDGFRα+/PECAM1- cells in mESC cultured with iCRT3. Mean ± SD; n = 3 independent experiments; two-tailed unpaired t test. b qRT-PCR of PE markers in mESCs cultured with iCRT3. Values represent Log2 of fold change expression relative to DMSO. Log2FC ± SD; n = 3 independent experiments; multiple unpaired t tests with Holm-Sidak method. c Representative flow cytometry plots of WT and Tcf7l1−/− cells co-stained for PECAM1 and PDGFRα. d Percentage of PDGFRα+/PECAM1- cells in WT and Tcf7l1−/− mESCs. Mean ± SD; n = 3 biologically independent samples; two-tailed unpaired t test. e Representative flow cytometric plots of WT and Tcf7l1−/− cells co-stained for PECAM1 and PDGFRα markers upon RA treatment. n = 3 independent experiments. f Flow cytometry analysis of PDGFRα and PECAM1 populations at 96H of RA treatment. Mean ± SD; n = 3 independent experiments; two-way ANOVA test. g qRT-PCR of PE markers in WT and Tcf7l1−/− mESCs upon RA treatment. Mean ± SEM; n = 3; two-way ANOVA test. h Representative IF image of GATA6 and NANOG in WT and Tcf7l1−/− mESCs upon RA treatment. Scale bar = 50 μm. i Quantification of NANOG+ and GATA6+ cells of Fig. 3h. Mean ± SD; two-tailed unpaired t test. Each dot represents % of cells in a field of view; WT:n = 12 non-overlapping images, Tcf7l1−/−: n = 14 non-overlapping images from n = 1 experiment. j qRT-PCR of pluripotency markers in WT and Tcf7l1−/− mESCs upon RA treatment. Mean ± SEM; n = 3 independent experiments; two-way ANOVA test. k qRT-PCR of embryonic neuroectodermal markers in WT and Tcf7l1−/− mESCs upon RA treatment. Gene expression values are reported as Log2 of fold change expression. n = 3 independent experiments. l (Left) Representative IF image of NESTIN in WT and Tcf7l1−/− mESCs upon RA treatment. (Right) Quantification of NESTIN+ cells. Mean ± SD; two-tailed unpaired t test. Each dot represents % of cells in a field of view; WT: n = 12 non-overlapping images, Tcf7l1−/−: n = 11 non-overlapping images from n = 1 experiment. Source data for all experiments are provided as a Source data file.
Fig. 4
Fig. 4. Tcf7l1 expression is sufficient to drive PE cell fate specification.
a Representative BF images of Tcf7l1-OE-mESCs cultured with Dox (D0) or without Dox (D4 and D8) from 3 independent experiments. Scale bar = 50 μm. b qRT-PCR of PE markers at indicated time points of Tcf7l1 OE from 2 independent experiments (pink and green lines). Expression levels of each gene is shown for XEN cells from the corresponding experiment (pink and green dots). All values are reported as fold change relative to Day0. The x-axis reports log10 scale. n = 2 independent experiments, see Source data file. c qRT-PCR of pluripotency markers at indicated time points of Tcf7l1 OE from 2 independent experiments (pink and green lines). Expression levels of each gene is shown for XEN cells from the corresponding experiment (pink and green dots). All values are reported as fold change relative to Day0. n = 2 independent experiments, see Source data file. d Representative IF image of GATA6 in Tcf7l1-OE-mESCs after 0 and 6 days of induction and XEN cells from 3 independent experiments. Scale bar = 100 μM. e Representative IF of NANOG as in Fig. 4d. f Normalized gene counts heatmap showing expression of naive pluripotency and primed epiblast markers in mESCs (D0), after 8 days of Tcf7l1 induction (D8) and in Epi-like cells. g Normalized gene counts heatmap showing expression of primitive endoderm, visceral and parietal endoderm markers in mESCs (D0), after 8 days of Tcf7l1 induction (D8) and XEN cells. Source data are provided in the Source data file.
Fig. 5
Fig. 5. PE cell fate specification is preceded by naive and formative pluripotency repression by TCF7L1.
a GO and KEGG functional enrichment analysis for Tcf7l1-OE-mESCs after 24 H of induction. Functional term networks were obtained using Cytoscape’s ClueGO plugin. Each node corresponds to an enriched term and edges connect terms that share a significant number of genes. Network communities (shown in color) were created using the Louvain algorithm, adjusted for betweenness centrality. bd Volcano plots showing down- (blue dots) and upregulated (red dots) genes altered on different timepoints of Tcf7l1 induction. Gene values are reported as a Log2FoldChange. Differential expression analysis was performed with a two-tailed Wald’s test. All p-values were adjusted for multiple comparisons using Benjamini-Hochberg correction. Annotated points correspond to selected marker genes. b DEGs after 24H of induction. c DEGs after 2 days of induction. d DEGs after 4 days of induction. e GO and KEGG functional enrichment analysis for Tcf7l1 mESCs after 4 days of induction. Network was created and analyzed as described in Fig. 5a. f Normalized gene counts heatmap showing 80 selected specific lineage markers in WT and Tcf7l1−/− cells upon 1, 2 and 4 days of induction. g Venn diagram indicating genes bound by TCF7L1 (1259 genes) from publicly available ChIP-seq data and downregulated genes in Tcf7l1-OE-mESCs after 1 day of induction (449 genes with unique promoters). There were 55 genes shared between the two sets (p-value of a two-tailed Fisher’s exact test = 0.0021) which include markers of naive and formative pluripotency. h Top 10 functional enrichment terms for the 55 genes downregulated in Tcf7l1-OE-mESCs after 1 day of induction and bound by TCF7L1. i qRT-PCR of pluripotency, primed epiblast/formative, and PE gene markers in WT, Tcf7l1−/− and Tcf7l1-OE-mESCs upon EpiLCs differentiation. Gene expression values are reported as Log2 of fold change expression, see Source data file.
Fig. 6
Fig. 6. Tcf7l1 is required for PE lineage formation in embryos.
a Regulon activity analysis of TCF/LEF factors during embryo preimplantation development. Circle size indicates % of cells in which TCF/LEF regulons are active. b Violin plot depicting Tcf7l1 and Tcf7l2 regulon activity at different developmental stages of embryo development. Dots represent individual cells (n). E2.5-E2.75: n = 114, E3.0-E3.5: n = 146, TE: n = 115, EPI: n = 71, PE: n = 81. Horizontal line denotes the median value, box indicates the interquartile range (IQR) and whiskers denote the 1.5 × IQR. c Tcf7l1 and Tcf7l2 gene expression along pseudo-time of PE specification trajectory during the transition between E3.5 to E4.5 developmental stages, compared to gene expression levels of different lineage markers. d Representative IF image of preimplantation embryos upon iCRT3 treatment from 2 independent experiments. Scale bar = 50 μM. e Number of NANOG+ and GATA6+ cells (counts) per embryo. Mean ± SEM; Control n = 17; iCRT3 n = 19; 2 independent experiments. multiple unpaired t tests with Holm-Sidak method. f Percentage of NANOG+ and GATA6+ cells normalized on total number of ICM per embryo. Mean ± SEM; Ctrl n = 17, iCRT3 n = 19; 2 independent experiments. g Embryo lumen volume reported in pL. Mean ± SEM; Ctrl n = 17, iCRT3 n = 19 embryos; 2 independent experiments; two-tailed unpaired t test. h Representative IF image of WT, negative control CRISPR/Cas9 and Tcf7l1−/− CRISPR/Cas9 embryos from 3 independent experiments. Scale bar=50 μM. Dashed lines delimitate lumen cavity. ik Analysis of WT, negative control CRISPR/Cas9 and Tcf7l1−/− CRISPR/Cas9 embryos. Horizontal line denotes the median value, box refers to the 25th to 75th percentiles and whiskers mark min and max values.; WT n = 15, negative control CRISPR/Cas9 n = 19, Tcf7l1−/− CRISPR/Cas9 n = 15. 3 independent experiments. i Total number of ICM cells. No statistically significant differences using one-way ANOVA test. j Number of NANOG+ and GATA4+ cells (counts) per embryo. One-Way ANOVA test. k Embryo lumen volume reported in pL. One-Way ANOVA test. Source data for all experiments are provided as a Source data file.

Similar articles

Cited by

References

    1. Cockburn K, Rossant J. Making the blastocyst: lessons from the mouse. J. Clin. Invest. 2010;120:995–1003. doi: 10.1172/JCI41229. - DOI - PMC - PubMed
    1. Saiz N, Plusa B. Early cell fate decisions in the mouse embryo. Reproduction. 2013;145:R65–R80. doi: 10.1530/REP-12-0381. - DOI - PubMed
    1. Hermitte S, Chazaud C. Primitive endoderm differentiation: from specification to epithelium formation. Philos. Trans. R. Soc. B Biol. Sci. 2014;369:20130537. doi: 10.1098/rstb.2013.0537. - DOI - PMC - PubMed
    1. Yamanaka Y, Lanner F, Rossant J. FGF signal-dependent segregation of primitive endoderm and epiblast in the mouse blastocyst. Development. 2010;137:715–724. doi: 10.1242/dev.043471. - DOI - PubMed
    1. Chazaud C, Yamanaka Y, Pawson T, Rossant J. Early lineage segregation between epiblast and primitive endoderm in mouse blastocysts through the Grb2-MAPK Pathway. Dev. Cell. 2006;10:615–624. doi: 10.1016/j.devcel.2006.02.020. - DOI - PubMed

Publication types

Substances