

Machine learning identifies straightforward early warning rules for human Puumala hantavirus outbreaks
- PMID: 36869118
- PMCID: PMC9984366
- DOI: 10.1038/s41598-023-30596-x
Machine learning identifies straightforward early warning rules for human Puumala hantavirus outbreaks
Abstract
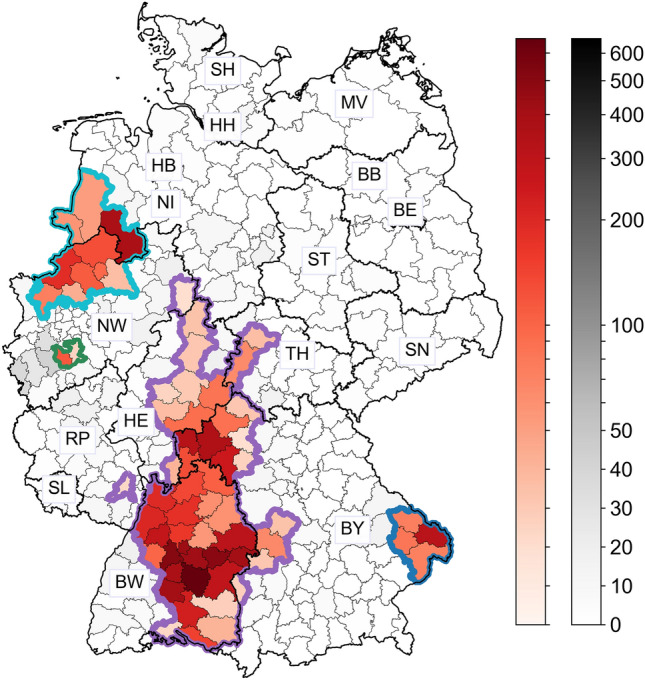
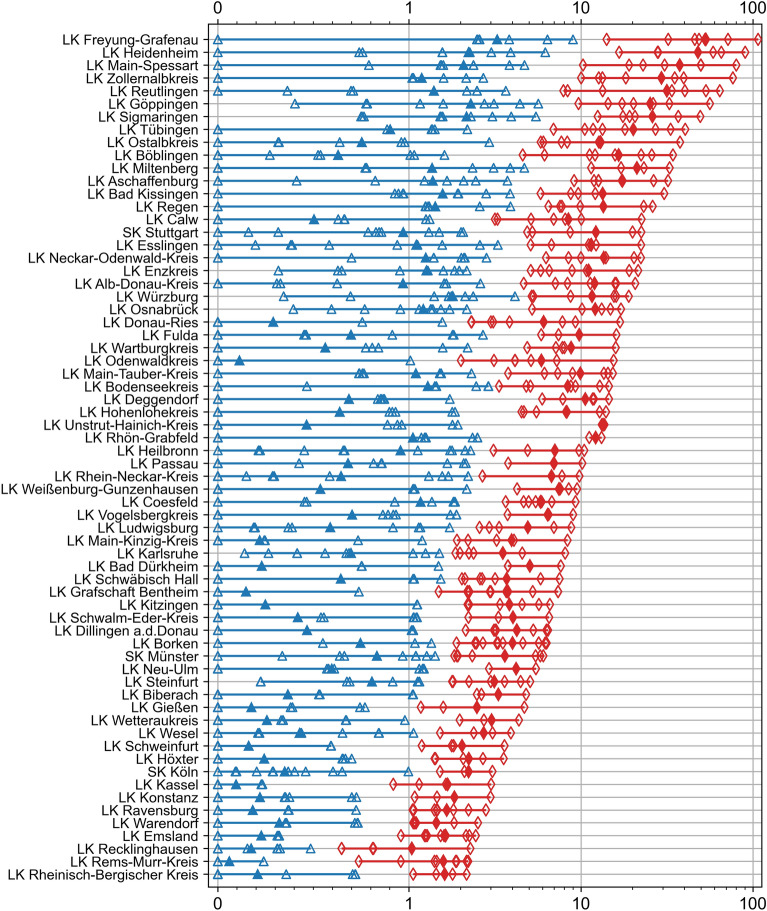
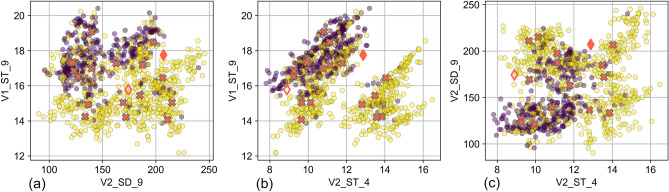
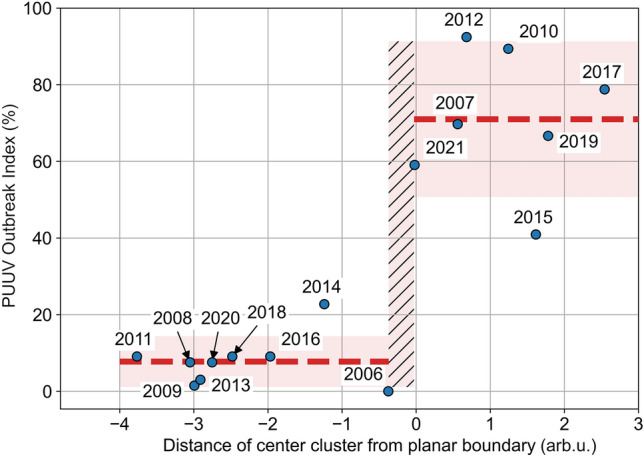
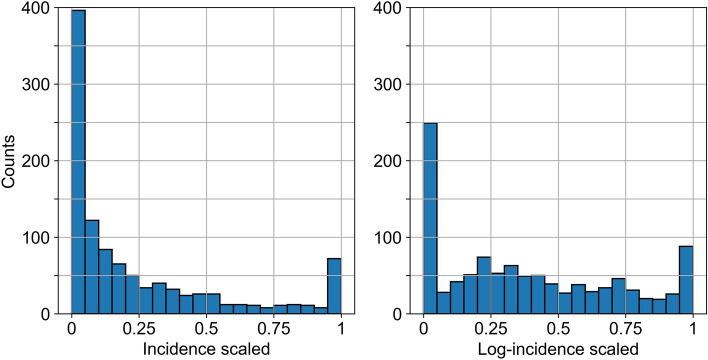
Human Puumala virus (PUUV) infections in Germany fluctuate multi-annually, following fluctuations of the bank vole population size. We applied a transformation to the annual incidence values and established a heuristic method to develop a straightforward robust model for the binary human infection risk at the district level. The classification model was powered by a machine-learning algorithm and achieved 85% sensitivity and 71% precision, despite using only three weather parameters from the previous years as inputs, namely the soil temperature in April of two years before and in September of the previous year, and the sunshine duration in September of two years before. Moreover, we introduced the PUUV Outbreak Index that quantifies the spatial synchrony of local PUUV-outbreaks, and applied it to the seven reported outbreaks in the period 2006-2021. Finally, we used the classification model to estimate the PUUV Outbreak Index, achieving 20% maximum uncertainty.
© 2023. The Author(s).
Conflict of interest statement
The authors declare no competing interests.
Figures
Similar articles
-
High-resolution early warning system for human Puumala hantavirus infection risk in Germany.Sci Rep. 2024 Apr 26;14(1):9602. doi: 10.1038/s41598-024-60144-0. Sci Rep. 2024. PMID: 38671000 Free PMC article.
-
Puumala virus outbreak in Western Thuringia, Germany, 2010: epidemiology and strain identification.Zoonoses Public Health. 2013 Dec;60(8):549-54. doi: 10.1111/zph.12037. Epub 2013 Feb 8. Zoonoses Public Health. 2013. PMID: 23398736
-
Environmental conditions in favour of a hantavirus outbreak in 2015 in Germany?Zoonoses Public Health. 2016 Mar;63(2):83-8. doi: 10.1111/zph.12217. Epub 2015 Jul 15. Zoonoses Public Health. 2016. PMID: 26177110
-
Innate and adaptive immune responses against human Puumala virus infection: immunopathogenesis and suggestions for novel treatment strategies for severe hantavirus-associated syndromes.J Intern Med. 2019 May;285(5):510-523. doi: 10.1111/joim.12876. Epub 2019 Feb 17. J Intern Med. 2019. PMID: 30663801 Free PMC article. Review.
-
Network "Rodent-borne pathogens" in Germany: longitudinal studies on the geographical distribution and prevalence of hantavirus infections.Parasitol Res. 2008 Dec;103 Suppl 1:S121-9. doi: 10.1007/s00436-008-1054-9. Epub 2008 Nov 23. Parasitol Res. 2008. PMID: 19030894 Review.
Cited by
-
A simple clinical score to reduce unnecessary testing for Puumala hantavirus.PLoS One. 2024 May 31;19(5):e0304500. doi: 10.1371/journal.pone.0304500. eCollection 2024. PLoS One. 2024. PMID: 38820375 Free PMC article.
-
High-resolution early warning system for human Puumala hantavirus infection risk in Germany.Sci Rep. 2024 Apr 26;14(1):9602. doi: 10.1038/s41598-024-60144-0. Sci Rep. 2024. PMID: 38671000 Free PMC article.
References
-
- Robert Koch Institute. SurvStat@RKI 2.0, https://survstat.rki.de. (deadline: 2022-02-07).
Publication types
MeSH terms
LinkOut - more resources
Full Text Sources
Miscellaneous
