. 2023 Mar 3;13(1):3609.
doi: 10.1038/s41598-023-30712-x.

A high sensitivity Cherenkov detector for prompt gamma timing and time imaging

Affiliations

A high sensitivity Cherenkov detector for prompt gamma timing and time imaging

Maxime Jacquet et al. Sci Rep. .

Abstract

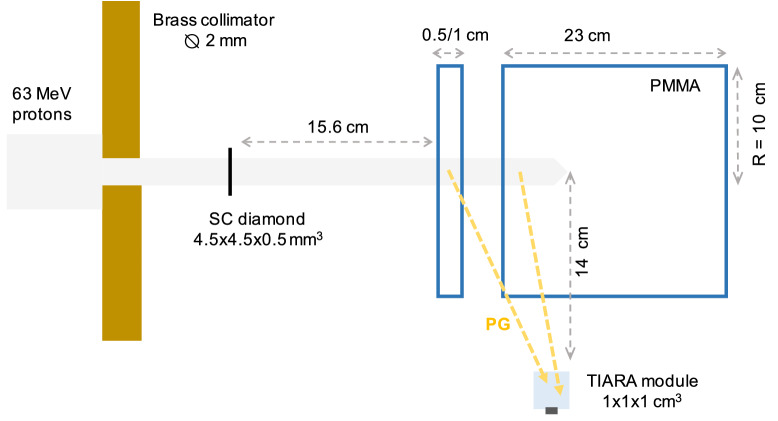
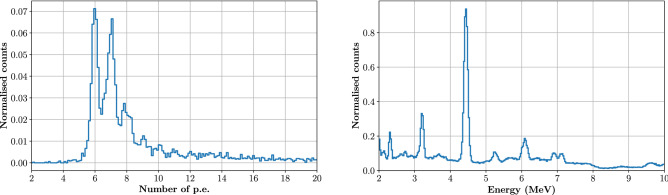
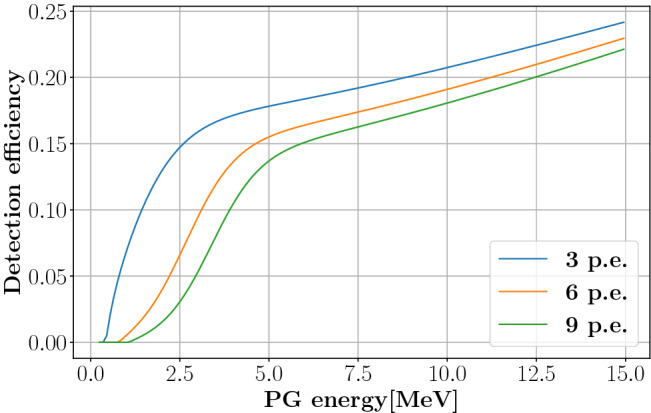
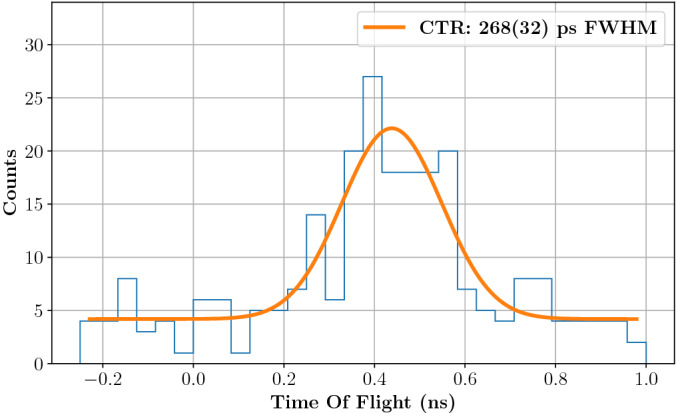
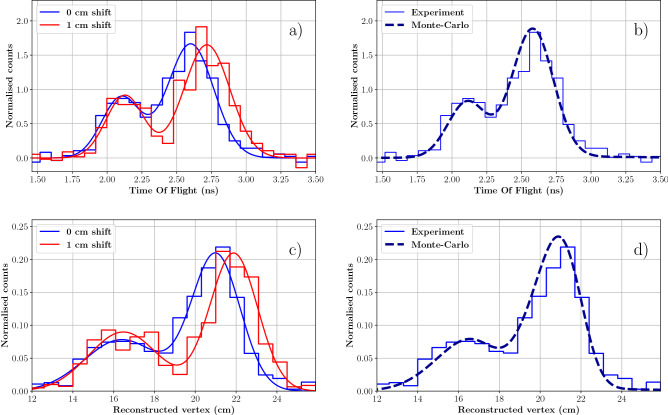
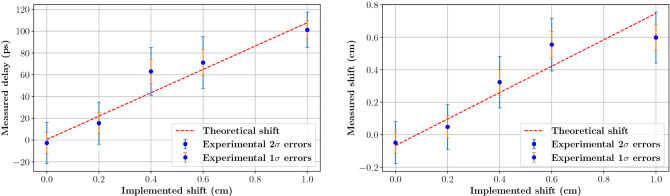
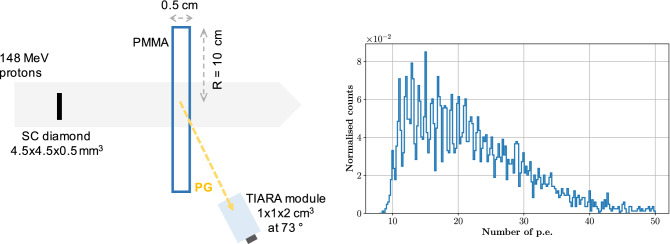
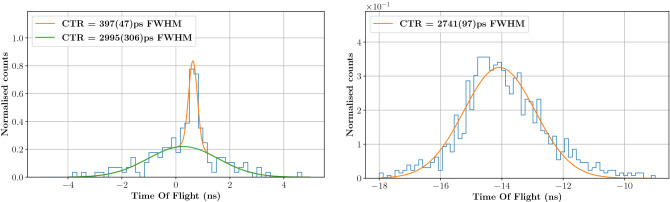
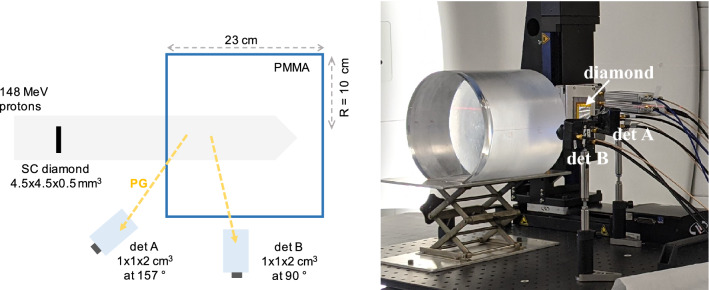
We recently proposed a new approach for the real-time monitoring of particle therapy treatments with the goal of achieving high sensitivities on the particle range measurement already at limited counting statistics. This method extends the Prompt Gamma (PG) timing technique to obtain the PG vertex distribution from the exclusive measurement of particle Time-Of-Flight (TOF). It was previously shown, through Monte Carlo simulation, that an original data reconstruction algorithm (Prompt Gamma Time Imaging) allows to combine the response of multiple detectors placed around the target. The sensitivity of this technique depends on both the system time resolution and the beam intensity. At reduced intensities (Single Proton Regime-SPR), a millimetric proton range sensitivity can be achieved, provided the overall PG plus proton TOF can be measured with a 235 ps (FWHM) time resolution. At nominal beam intensities, a sensitivity of a few mm can still be obtained by increasing the number of incident protons included in the monitoring procedure. In this work we focus on the experimental feasibility of PGTI in SPR through the development of a multi-channel, Cherenkov-based PG detector with a targeted time resolution of 235 ps (FWHM): the TOF Imaging ARrAy (TIARA). Since PG emission is a rare phenomenon, TIARA design is led by the concomitant optimisation of its detection efficiency and Signal to Noise Ratio (SNR). The PG module that we developed is composed of a small PbF[Formula: see text] crystal coupled to a silicon photoMultiplier to provide the time stamp of the PG. This module is currently read in time coincidence with a diamond-based beam monitor placed upstream the target/patient to measure the proton time of arrival. TIARA will be eventually composed of 30 identical modules uniformly arranged around the target. The absence of a collimation system and the use of Cherenkov radiators are both crucial to increase the detection efficiency and the SNR, respectively. A first prototype of the TIARA block detector was tested with 63 MeV protons delivered from a cyclotron: a time resolution of 276 ps (FWHM) was obtained, resulting in a proton range sensitivity of 4 mm at 2[Formula: see text] with the acquisition of only 600 PGs. A second prototype was also evaluated with 148 MeV protons delivered from a synchro-cyclotron obtaining a time resolution below 167 ps (FWHM) for the gamma detector. Moreover, using two identical PG modules, it was shown that a uniform sensitivity on the PG profiles would be achievable by combining the response of gamma detectors uniformly distributed around the target. This work provides the experimental proof-of-concept for the development of a high sensitivity detector that can be used to monitor particle therapy treatments and potentially act in real-time if the irradiation does not comply to treatment plan.


Figures

Figure 1
Figure 1
Set-up of the experiment carried out at the MEDICYC facility with 63 MeV protons. A first version of the TIARA module, composed of a 1 cm3 PbF2 crystal coupled to a 3×3 mm2 SiPM and facing the Bragg peak region at 90, was tested in time coincidence with a sc diamond detector of 4.5×4.5×0.55 mm3 volume. For the time and energy response characterisation, only PG signals from the thin PMMA target (cylinder of 10 cm radius) were considered: repeated measurement were carried out with either a 5 mm or a 1 cm thick target and the results were then averaged. The second target (cylinder of 10 cm radius and 23 cm thickness) was employed in the measurement of the proton range sensitivity; initially placed at 3 cm distance from the thin target, it was progressively moved by 2, 4, 6 and 10 mm in order to induce an artificial shift in the proton range. All the targets have a density of 1.19 g/cm3.
Figure 2
Figure 2
The left plot shows the histogram of the energy deposited in the TIARA module (1 cm3 PbF2 crystal coupled to a 3×3 mm2 SiPM and placed at 90 respect to the beam) expressed as the integral of the SiPM signal. PGs are generated by 63 MeV protons impinging on the two PMMA targets described in Fig. 1. The first peak in the histogram corresponds to 6 p.e; the 7, 8, 9 p.e. peaks are also visible: a median number of 7 p.e. per PG were detected. The right plot shows the expected energy spectrum of PGs obtained by MC simulation for comparison. The simulation is performed with the Geant4.10.4.p02 toolkit implementing the QGSP-BIC-EMY physics list and reproducing the PMMA target and beam parameters used in the experiment.
Figure 3
Figure 3
Intrinsic detection efficiency (neglecting geometrical efficiency) of a PG detection module composed of a 1 cm3 PbF2 crystal coupled to a 3×3 mm2 SiPM. The three functions were obtained from MC simulation using the Geant4.10.4.p02 toolkit with the QGSP-BIC-EMY physics list to establish the PG interaction probability, while the UNIFIED model was applied to model the interactions of Cherenkov photons inside the crystal. Three different thresholds of 3, 6 and 9 p.e. were considered.
Figure 4
Figure 4
TOF distribution obtained with the 5 mm thick, 10 cm radius PMMA target irradiated by 63 MeV protons. The PG detector consisted of a 1 cm3 PbF2 crystal coupled to a 3×3 mm2 SiPM and placed at 90 respect to the beam. Data are fitted with a gaussian distribution convolved with a uniform distribution of 51 ps width. The resulting FWHM of 268 ps (114 ps rms) corresponds to the gaussian distribution FWHM and it can be interpreted as the system CTR.
Figure 5
Figure 5
PGT profiles (top) and PGTI reconstructed profiles (bottom) obtained from the PMMA targets described in Fig. 1 irradiated with 63 MeV protons. In (a) the experimental TOF profile obtained for the reference geometry (in blue) is compared to the one obtained after engendering a proton range shift of 1 cm (in red). The two histograms are fitted with a double gaussian fuction to improve readability; the fit was not used for analysis. In (b), the simulated reference profile (dashed line) is compared to the corresponding experimental data. In (c) the two profiles shown in (a) are reconstructed with the PGTI algorithm to convert them into the space domain. In (d) the reconstructed simulated (dashed line) and experimental (continuous line) reference profiles, corresponding to data in figure (b) are presented. The experimental profiles are obtained with a PG module composed of a 1 cm3 PbF2 crystal coupled to a 3×3 mm2 SiPM and placed at 90 respect to the beam. For the simulation of the reference profile, we used the Geant4.10.4.p02 toolkit with the QGSP-BIC-EMY physics list and the UNIFIED model.
Figure 6
Figure 6
Range shift sensitivities obtained with a PMMA target including an air cavity ranging from 3 to 4 cm, and irradiated with 63 MeV protons. On the left, the proton range shift measured with the PGT technique in unit of time is compared to the actual shift implemented in the phantom. On the right, the PGTI reconstruction allows measuring the proton range shift directly in the space domain. The dashed red line corresponds to the theoretical correlation between the implemented shift and the measured parameter as obtained from MC simulation using the Geant4.10.4.p02 toolkit with the QGSP-BIC-EMY physics list and the UNIFIED model. Error bars represent the 1σ (orange) and 2σ (blue) statistical errors obtained by the bootstrap technique (see the Methods section). With both techniques, the TIARA detection module (1 cm3 PbF2 crystal coupled to a 3×3 mm2 SiPM and placed at 90 from the beam direction) permits to achieve a proton range shift sensitivity of 4 mm at 2σ with a statistics of approximately 600 PGs.
Figure 7
Figure 7
Left: experimental set-up for the CTR measurement carried out at the S2C2. A 5 mm thick, 10 cm radius PMMA target was used as a source of PGs to measure the CTR. Given the limited transit time of protons within the target, the PG source can be considered point-like. The beam size (4.3 mm σ) was larger than the diamond surface (4.5×4.5 mm2) as no collimator was employed. The TIARA detection module was composed of a 2 cm3 PbF2 crystal coupled to a 6×6 mm2 SiPM and placed at approximately 73 from the beam direction. The effective beam intensity at the beam monitor level was 0.78 p/bunch. Right: energy deposited in the TIARA detection module expressed as the integral of the SiPM signal. A threshold of 10 p.e. was applied for data acquisition, resulting in a median number of 21 p.e. detected.
Figure 8
Figure 8
On the left, TOF distribution obtained from the irradiation of the 5 mm target. The gaussian peak with 397 ps (FWHM) corresponds to PGs generated by protons traversing the beam monitor; the large background signal corresponds to PGs generated by protons passing by the diamond detector. On the right, the TOF distribution obtained from random coincidences between the diamond and the PG detectors confirms the origin of the background on the left plot: it is a measure of the bunch-induced time resolution.
Figure 9
Figure 9
Experimental set-up for the PGT profile measurement at the S2C2 facility. The 23 cm thick, 10 cm radius PMMA target fully stopped the 148 MeV protons after a range of 13.4 cm. Two gamma detector modules were placed upstream the target (det A, at 157) and at the Bragg peak (det B, at 90). Each module was composed of a 2 cm3 PbF2 crystal coupled to a 6×6 mm2 SiPM. The effective beam intensity at the beam monitor level was 0.78 p/bunch.
Figure 10
Figure 10
TOF distributions obtained with the thick PMMA target and with detector A (in blue) placed at 157 and detector B (in red) placed at 90 from the beam direction. The relevant signal is in the region between 0.5 and 3 ns. Outside this region, the background is mainly due to random coincidences caused by the limited size of the beam monitor. The two bumps located at (−1.0 ÷ 0.5) ns and (2.9 ÷ 4.1) ns for detectors A and B distributions, respectively, are associated to protons scattered in the beam detector.
Figure 11
Figure 11
Vertex distributions of different secondary particles generated by a 100 MeV proton beam impinging on the spherical phantom head described in Jacquet et al.. Data are obtained by MC simulation (Geant4.10.4.p02 toolkit with the QGSP-BIC-EMY physics list); the detector is not simulated. The contribution of PG scattered in the phantom is reported separately. It can be observed that their profile has the same shape as the one from unscattered PGs and therefore they constitute a valuable signal. The contribution of secondary neutrons (in red) is not constant and cannot be easily rejected by TOF without compromising the measurement of the PG profile fall-off. Data are taken from Jacquet et al..

References

    1. Durante M, Paganetti H. Nuclear physics in particle therapy: A review. Rep. Prog. Phys. 2016;79:096702. doi: 10.1088/0034-4885/79/9/096702. - DOI - PubMed
    1. Pausch G, et al. Detection systems for range monitoring in proton therapy: Needs and challenges. Nucl. Instrum. Methods Phys. Res., Sect. A. 2020;954:161227. doi: 10.1016/j.nima.2018.09.062. - DOI
    1. Parodi K, Polf JC. In vivo range verification in particle therapy. Med. Phys. 2018 doi: 10.1002/mp.12960. - DOI - PMC - PubMed
    1. Park JH, et al. Multi-slit prompt-gamma camera for locating of distal dose falloff in proton therapy. Nucl. Eng. Technol. 2019;51:1406–1416. doi: 10.1016/j.net.2019.03.008. - DOI
    1. Priegnitz M, et al. Detection of mixed-range proton pencil beams with a prompt gamma slit camera. Phys. Med. Biol. 2016;61:855–871. doi: 10.1088/0031-9155/61/2/855. - DOI - PubMed