. 2023 May;30(5):1349-1365.
doi: 10.1038/s41418-023-01141-0. Epub 2023 Mar 3.

A noncanonical response to replication stress protects genome stability through ROS production, in an adaptive manner

Affiliations

A noncanonical response to replication stress protects genome stability through ROS production, in an adaptive manner

Sandrine Ragu et al. Cell Death Differ. 2023 May.

Abstract

Cells are inevitably challenged by low-level/endogenous stresses that do not arrest DNA replication. Here, in human primary cells, we discovered and characterized a noncanonical cellular response that is specific to nonblocking replication stress. Although this response generates reactive oxygen species (ROS), it induces a program that prevents the accumulation of premutagenic 8-oxoguanine in an adaptive way. Indeed, replication stress-induced ROS (RIR) activate FOXO1-controlled detoxification genes such as SEPP1, catalase, GPX1, and SOD2. Primary cells tightly control the production of RIR: They are excluded from the nucleus and are produced by the cellular NADPH oxidases DUOX1/DUOX2, whose expression is controlled by NF-κB, which is activated by PARP1 upon replication stress. In parallel, inflammatory cytokine gene expression is induced through the NF-κB-PARP1 axis upon nonblocking replication stress. Increasing replication stress intensity accumulates DNA double-strand breaks and triggers the suppression of RIR by p53 and ATM. These data underline the fine-tuning of the cellular response to stress that protects genome stability maintenance, showing that primary cells adapt their responses to replication stress severity.


Conflict of interest statement

The authors declare no competing interests.

Figures
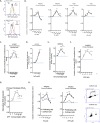
Fig. 1
Fig. 1. Primary cells induce ROS upon nonblocking replication stress.
A HU- or APH-induced ROS production in primary human fibroblasts was monitored using the DCFDA fluorescent probe and FACS analysis. The shift in the fluorescence peak reveals the induction of intracellular ROS production. B HU dose-dependent induction of ROS production using the DCFDA fluorescent probe in four different primary fibroblast strains. C HU dose response of RIR production in primary mammary epithelial cells (HUMEC). D H2O2 dose response of ROS production measured with the DCFDA fluorescent probe and FACS analysis. The data from three independent experiments are presented as the mean (± SEM) level of ROS production normalized to that of the control. E HU-induced ROS monitored with a different fluorescent probe: DHR (dihydrorhodamine 123). F Impacts of aphidicolin (APH) on ROS production in primary fibroblasts. G Impact of camptothecin (CPT) on the production of ROS in primary fibroblasts. Data from three independent experiments are presented as the mean ( ± SEM) level of ROS production normalized to that of the control. H Cell confluence abrogates HU- and APH-induced ROS production (left panel). Data from three independent experiments are presented as the mean ( ± SEM) level of ROS production normalized to that of the control. Right panel: Measurement of the impact of confluence on DNA replication monitored by BrdU incorporation and measured by FACS analysis.
Fig. 2
Fig. 2. RIR production by different replication stress inducers.
A Oxidation of ro1pEGFP-N1 expressed in primary fibroblasts exposed to HU or APH. Cells were treated with HU (250 µM; 3 days), APH (0.6 µM; 3 days) or H2O2 (100 µM; 20 min) as a positive control. Left panel: fluorescence of ro1pEGFP-N1 (480 nm excitation) in primary cells exposed to HU or APH. Right panel: Ratio of fluorescence at 400/480 nm excitation; the histogram represents the mean ± S.E.M. of four independent experiments. *p < 0.01 vs. control, determined by the t-test. B ROS induced by HU or APH are excluded from the nucleus in primary fibroblasts. Left panels: representative image of GFP fluorescence. The positive control (H2O2) exhibited GFP fluorescence in the nucleus. Right panel: quantification of cells with nuclear ROS (GFP fluorescence in the nucleus). The histogram represents the mean ± S.E.M. (normalized to the control) of four independent experiments. Ns Not significant vs. control as determined by the t-test.
Fig. 3
Fig. 3. RIR prevents the accumulation of genomic 8-oxoG.
A Accumulation of 8-oxoG in the genome of primary fibroblasts exposed to 450 µM H2O2 for 90 min (positive control). B 8-OxoG levels in the genome of primary fibroblasts after 72 h of exposure to HU. Quantification of 8-oxoG (8-oxoG/million bases). C Effect of NAC on 8-oxoG levels in the genome of primary fibroblasts. D 8-OxoG-positive primary fibroblasts upon 72 h exposure to HU using an antibody raised against 8-oxoG. Left panel: representative photos of immunofluorescence staining for 8-oxoG (red) in primary fibroblasts. Scale bars: 10 µm. Upper right panel: scheme of the experimental protocol; 24 h after plating, HU (250 µM) was added to the cells and maintained for the rest of the experiment; 24 h after HU pretreatment, cells were exposed to H2O2 (100 µM H2O2); 24 h after H2O2 treatment, cells were fixed for analysis with the anti-8-OxoG antibody. Lower right panel: Quantification of the frequency of HU-pretreated primary fibroblasts exposed to nuclear localization of 8-oxoG. At least 200 cells were counted. E Quantification of the frequency of primary fibroblasts treated with 0.6 µM APH for 72 h, with nuclear localization of 8-oxoG. The histogram represents the mean ± S.E.M. (normalized to the control) of four independent experiments. *p < 0.01 vs. control as determined by the t-test.
Fig. 4
Fig. 4. RIR protects primary fibroblasts from endogenous premutagenic oxidative DNA lesions through FOXO1 activation.
A RIR-inducing doses of HU increase the mRNA levels of 4 different detoxification genes (SEPP1, catalase, GPX1, and SOD2) controlled by FOXO1 in primary fibroblasts. B Impact of silencing FOXO1 on the frequency of 8-oxoG-positive cells (primary fibroblasts) upon 72 h of exposure to HU. Two siRNAs were used: FOXO1(1) and FOXO1(2). Left panel: immunofluorescence staining for 8-oxoG (red) in primary fibroblasts: representative photos of immunofluorescence staining in primary fibroblasts. Nuclei were counterstained with DAPI (blue). Scale bars: 10 µm. Upper right panel: immunoblot of FOXO1 silencing in primary fibroblasts. Lower right panels: quantification of the frequency of nuclear 8-oxoG-positive cells upon exposure to 250 µM HU after FOXO1 silencing. The data from four independent experiments are presented. At least 200 cells were counted. C Four FOXO-controlled genes (namely, SEPP1, catalase, SOD2 and GPX1) were induced in CD3-positive T cells by HU therapy in CMML patients. D Four FOXO-controlled genes (namely, SEPP1, catalase, SOD2, and GPX1) were not systematically induced in nonproliferating CD14-positive cells.
Fig. 5
Fig. 5. Replication stress induces DUOX1- and DUOX2-dependent RIR in primary cells.
A Effect of DPI (an NADPH oxidase inhibitor) on RIR production in two different human primary fibroblast strains using two probes (left panels) and in one human primary epithelial cell strain (right panel). B Replication stress increases DUOX1 and DUOX2 mRNA levels in primary fibroblasts. C Impact of cell confluence on the induction of DUOX1 and DUOX2 mRNA levels by HU, monitored by qPCR. D DUOX1 and DUOX2 silencing impairs RIR production in primary fibroblasts. Two siRNAs for each DUOX were assayed: DUOX1(1) and DUOX1(2) and DUOX2(1) and DUOX2(2). E Impacts of p53 or ATM silencing on the decrease in RIR production induced by 1 mM HU. Data from three independent experiments are presented as the mean (± SEM) level of ROS production normalized to that of the control. The efficiency of silencing is shown in the right panels. Phospho-p53 corresponds to the lower band; its level is normally very low in untreated normal cells. To detect p53, we must induce it by Nutlin (third lane). The efficiency of the siRNA was then verified (compare the third and fourth lanes).
Fig. 6
Fig. 6. Control of RIR and DUOX1 and DUOX2 expression by NF-κB upon HU treatment.
A Transcriptome analysis. Left panel: Volcano plot from microarray data comparing primary human fibroblasts (GM03348) treated (or not) with 250 µM HU. The targets with log2 (fold change - FC) > 0.5 and < −0.5 and an adjusted p value of 0.05 are highlighted in blue. Right panel: Gene Ontology analysis of down- and upregulated genes. B Validation of microarray analysis results by real-time RT–PCR analysis of the downregulated (SMC4, LMB1, MCM3, HIST1H3F and Top2b) and upregulated (Ccl2, Cxcl14, p21, Il4l1, and CD82) genes. C Real-time RT–PCR analysis of IL6 and SOD2 using cDNA generated from primary human fibroblasts (GM03348) treated (or not) with 250 µM HU and DMSO or an NF-κB inhibitor (QNZ). D Nuclear translocation of RelA upon HU exposure. Immunofluorescence staining for the NF-B subunit RelA (red) in primary fibroblasts. Left panel: representative photos of immunofluorescence staining for RelA (red) in primary fibroblasts. Nuclei were counterstained with DAPI (blue). Scale bars: 10 µm. Right panel: quantification of the nuclear translocation of RelA upon exposure to 250 µM HU. At least 200 cells were counted. E Binding of RelA to an established NF-κB target, the IκB gene promoter. F Inhibition of NF-κB with two different inhibitors in primary fibroblasts. G Impact of the inhibition of NF-κB on the mRNA expression of DUOX1 and DUOX2. H Silencing RelA inhibits the expression of the DUOX1 and DUOX2 mRNAs. I Binding of RelA to the NF-κB RE sequences located upstream of the TSSs in the DUOX1 and DUOX2 genes. Top panel: electrophoretic analysis of the PCR-amplified fragments resulting from the RelA ChIP experiment. IgG: precipitate with a secondary antibody without the primary antibody. RelA: precipitation with the RelA antibody. Bottom panels: qPCR analysis and quantification relative to the input. ChIP was performed on primary GM03348 fibroblasts treated with or without HU using an anti-RelA antibody. Data from at least three independent experiments are presented (error bars,  ± SEM).
Fig. 7
Fig. 7. PARP1 controls RIR and cytokines production.
A Silencing PARP1 (2 different siRNAs) abolished the induction of HU- or APH-induced RIR. Upper panels: immunoblots of PARP1 silencing in primary fibroblasts. Lower panels: quantification of ROS (DCFA). B Silencing PARP1 inhibits the HU-induced translocation of RelA in primary fibroblasts. Left panel: representative photos of immunofluorescence staining for RelA (red) in primary fibroblasts. Nuclei were counterstained with DAPI (blue). Scale bars: 10 µm. Right panel: quantification of cells with nuclear RelA. Right panel: quantification of the nuclear translocation of RelA. At least 200 cells were counted. The data from four independent experiments are presented. C Impact of PARP1 silencing on the expression of DUOX1 and DUOX2 (RT-qPCR). D Impact of proliferation versus confluence on the expression of 5 classic cytokine genes upon exposure to HU (250 µM) or APH (0.6 µM) (RT–qPCR). E Impact of PARP1 silencing on the expression of 5 classic cytokine genes upon exposure to HU (250 µM) (RT–qPCR).
Fig. 8
Fig. 8. The biphasic model response to DNA damage.
Primary cells adapt their response to replication stress intensity according to distinct phases: the low-level/endogenous stress response and the high-level stress response. Below a certain stress intensity threshold, cells engage the low-level response (LoL-DDR), which does not repress DNA synthesis and cell progression. The LoL-DDR response regulates the production of extranuclear ROS (RIR) under the control of cellular PARP1, NF-κB, DUOX1 and DUOX2. In parallel, NF-κB induces the expression of inflammatory cytokine genes. RIR induces the FOXO1 detoxifying program, protecting against the accumulation of premutagenic lesions, such as 8-oxoG, in an adaptive-like detoxification response. Above the threshold, cells accumulate DSBs and activate the canonical DDR, which detoxifies RIR.

Similar articles

Cited by

References

    1. Negrini S, Gorgoulis VG, Halazonetis TD. Genomic instability–an evolving hallmark of cancer. Nat Rev Mol Cell Biol. 2010;11:220–8. doi: 10.1038/nrm2858. - DOI - PubMed
    1. Hanahan D, Weinberg RA. Hallmarks of cancer: The next generation. Cell. 2011;144:646–74. doi: 10.1016/j.cell.2011.02.013. - DOI - PubMed
    1. López-Otín C, Blasco MA, Partridge L, Serrano M, Kroemer G. The hallmarks of aging. Cell. 2013;153:1194–217. doi: 10.1016/j.cell.2013.05.039. - DOI - PMC - PubMed
    1. Bartkova J, Horejsi Z, Koed K, Kramer A, Tort F, Zieger K, et al. DNA damage response as a candidate anti-cancer barrier in early human tumorigenesis. Nature. 2005;434:864–70. doi: 10.1038/nature03482. - DOI - PubMed
    1. Bartkova J, Rezaei N, Liontos M, Karakaidos P, Kletsas D, Issaeva N, et al. Oncogene-induced senescence is part of the tumorigenesis barrier imposed by DNA damage checkpoints. Nature. 2006;444:633–7. doi: 10.1038/nature05268. - DOI - PubMed

Publication types