

Immune-related toxicity and soluble profile in patients affected by solid tumors: a network approach
- PMID: 36869232
- PMCID: PMC10264536
- DOI: 10.1007/s00262-023-03384-9
Immune-related toxicity and soluble profile in patients affected by solid tumors: a network approach
Abstract
Background: Immune checkpoint inhibitors (ICIs) have particular, immune-related adverse events (irAEs), as a consequence of interfering with self-tolerance mechanisms. The incidence of irAEs varies depending on ICI class, administered dose and treatment schedule. The aim of this study was to define a baseline (T0) immune profile (IP) predictive of irAE development.
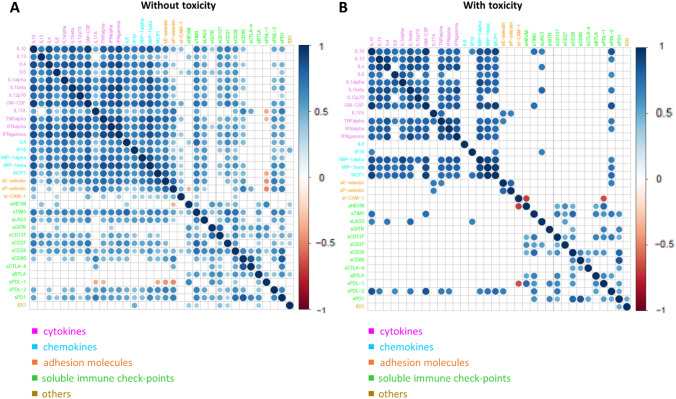
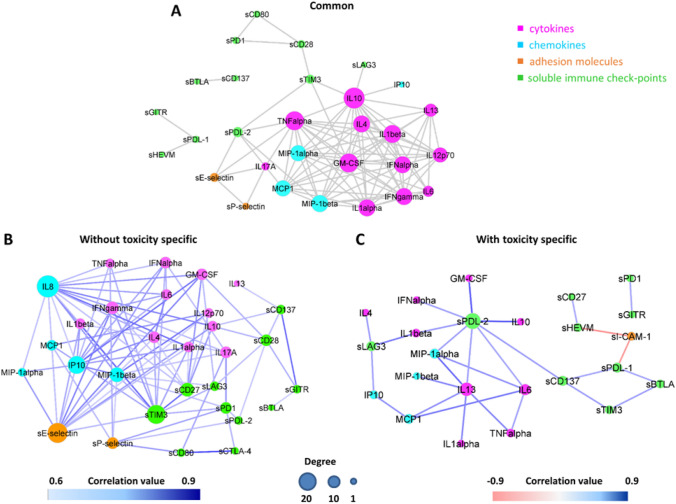
Methods: A prospective, multicenter study evaluating the immune profile (IP) of 79 patients with advanced cancer and treated with anti-programmed cell death protein 1 (anti-PD-1) drugs as a first- or second-line setting was performed. The results were then correlated with irAEs onset. The IP was studied by means of multiplex assay, evaluating circulating concentration of 12 cytokines, 5 chemokines, 13 soluble immune checkpoints and 3 adhesion molecules. Indoleamine 2, 3-dioxygenase (IDO) activity was measured through a modified liquid chromatography-tandem mass spectrometry using the high-performance liquid chromatography-mass spectrometry (HPLC-MS/MS) method. A connectivity heatmap was obtained by calculating Spearman correlation coefficients. Two different networks of connectivity were constructed, based on the toxicity profile.
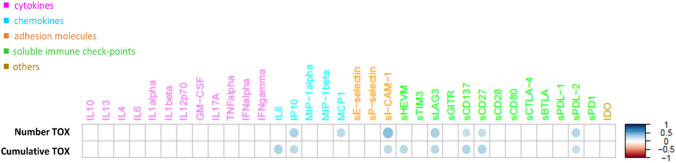
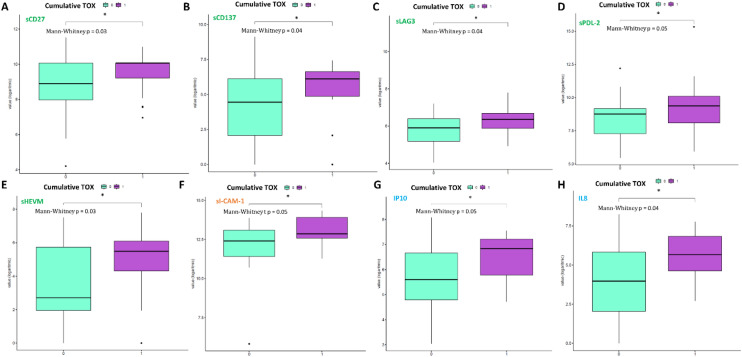
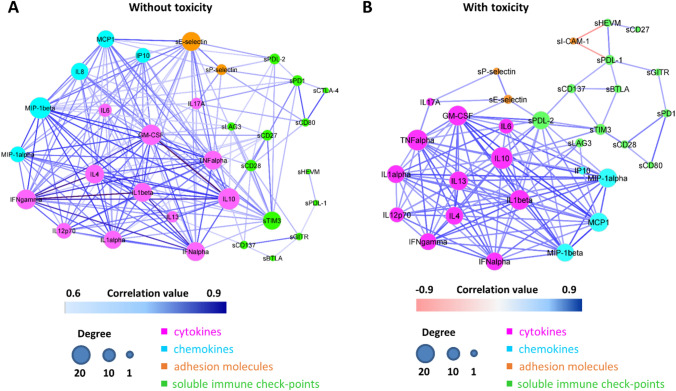
Results: Toxicity was predominantly of low/moderate grade. High-grade irAEs were relatively rare, while cumulative toxicity was high (35%). Positive and statistically significant correlations between the cumulative toxicity and IP10 and IL8, sLAG3, sPD-L2, sHVEM, sCD137, sCD27 and sICAM-1 serum concentration were found. Moreover, patients who experienced irAEs had a markedly different connectivity pattern, characterized by disruption of most of the paired connections between cytokines, chemokines and connections of sCD137, sCD27 and sCD28, while sPDL-2 pair-wise connectivity values seemed to be intensified. Network connectivity analysis identified a total of 187 statistically significant interactions in patients without toxicity and a total of 126 statistically significant interactions in patients with toxicity. Ninety-eight interactions were common to both networks, while 29 were specifically observed in patients who experienced toxicity.
Conclusions: A particular, common pattern of immune dysregulation was defined in patients developing irAEs. This immune serological profile, if confirmed in a larger patient population, could lead to the design of a personalized therapeutic strategy in order to prevent, monitor and treat irAEs at an early stage.
Keywords: Immunotherapy; Network; Solid tumors; Soluble profile; Toxicity.
© 2023. The Author(s).
Conflict of interest statement
PAOLO MARCHETTI (PM) has/had a consultant/advisory role for BMS, Roche-Genentech, MSD, Novartis, Amgen, Merck Serono, Pierre Fabre, Incyte. The other authors declare that they have no competing interests.
Figures
References
-
- Reck M, Rodríguez-Abreu D, Robinson AG, Hui R, Csőszi T, Fülöp A, Gottfried M, Peled N, Tafreshi A, Cuffe S, O’Brien M, Rao S, Hotta K, Leiby MA, Lubiniecki GM, Shentu Y, Rangwala R, Brahmer JR. KEYNOTE-024 investigators. Pembrolizumab versus chemotherapy for PD-L1-positive non-small-cell lung cancer. N Engl J Med. 2016;10375(19):1823–1833. doi: 10.1056/NEJMoa1606774. - DOI - PubMed
-
- Herbst RS, Baas P, Kim DW, Felip E, Pérez-Gracia JL, Jr, Han JY, Molina J, Kim JH, Arvis CD, Ahn MJ, Majem M, Fidler MJ, de Castro G, Garrido M, Lubiniecki GM, Shentu Y, Im E, Dolled-Filhart M, Garon EB. Pembrolizumab versus docetaxel for previously treated, PD-L1-positive, advanced non-small-cell lung cancer (KEYNOTE-010): a randomised controlled trial. Lancet. 2016;387(10027):1540–1550. doi: 10.1016/S0140-6736(15)01281-7. - DOI - PubMed
-
- Pelster MS, Gruschkus SK, Bassett R, Gombos DS, Shephard M, Posada L, Glover MS, Simien R, Diab A, Hwu P, Carter BW, Patel SP. Nivolumab and Ipilimumab in metastatic uveal melanoma: results from a single-arm phase II study. J Clin Oncol. 2021;39(6):599–607. doi: 10.1200/JCO.20.00605. - DOI - PMC - PubMed
Publication types
MeSH terms
Substances
LinkOut - more resources
Full Text Sources
Medical
Research Materials
