. 2023 Jul;40(13-14):1481-1494.
doi: 10.1089/neu.2022.0153. Epub 2023 May 17.

Non-Invasive Vagus Nerve Stimulation Improves Brain Lesion Volume and Neurobehavioral Outcomes in a Rat Model of Traumatic Brain Injury

Affiliations

Non-Invasive Vagus Nerve Stimulation Improves Brain Lesion Volume and Neurobehavioral Outcomes in a Rat Model of Traumatic Brain Injury

Afshin A Divani et al. J Neurotrauma. 2023 Jul.

Abstract

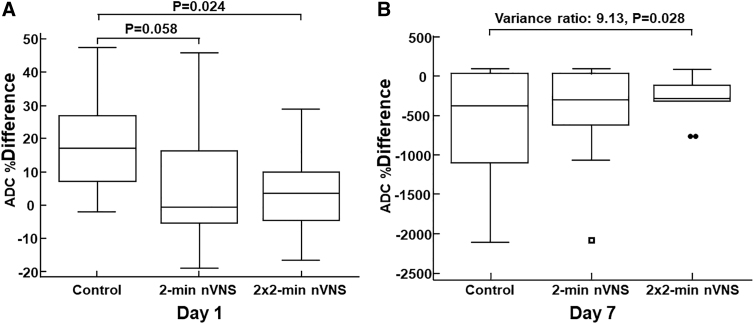
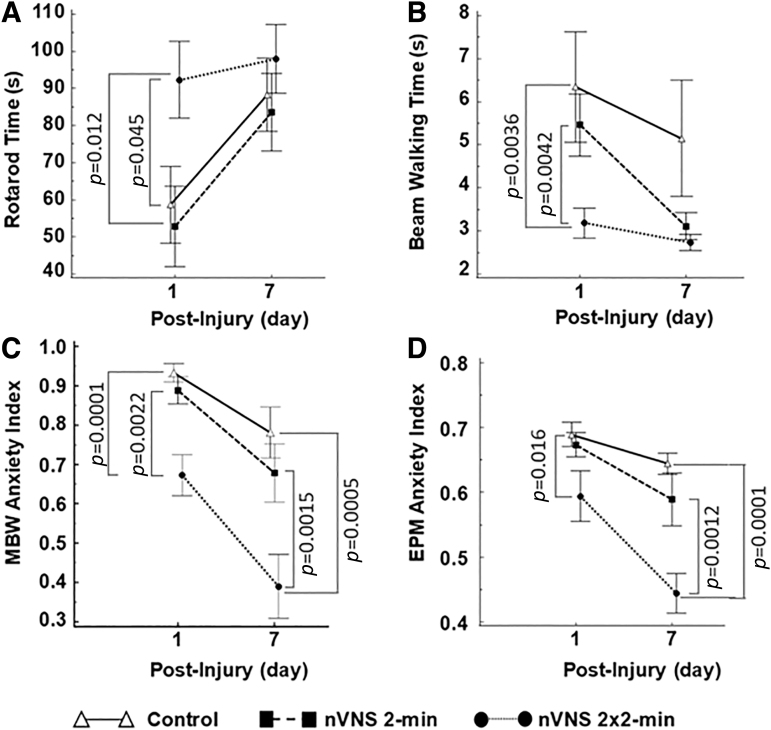
Abstract Traumatic brain injury (TBI) continues to be a major cause of death and disability worldwide. This study assessed the effectiveness of non-invasive vagus nerve stimulation (nVNS) in reducing brain lesion volume and improving neurobehavioral performance in a rat model of TBI. Animals were randomized into three experimental groups: (1) TBI with sham stimulation treatment (Control), (2) TBI treated with five lower doses (2-min) nVNS, and (3) TBI treated with five higher doses (2 × 2-min) nVNS. We used the gammaCore nVNS device to deliver stimulations. Magnetic resonance imaging studies were performed 1 and 7 days post-injury to confirm lesion volume. We observed smaller brain lesion volume in the lower dose nVNS group compared with the control group on days 1 and 7. The lesion volume for the higher dose nVNS group was significantly smaller than either the lower dose nVNS or the control groups on days 1 and 7 post-injury. The apparent diffusion coefficient differences between the ipsilateral and contralateral hemispheres on day 1 were significantly smaller for the higher dose (2 × 2 min) nVNS group than for the control group. Voxel-based morphometry analysis revealed an increase in the ipsilateral cortical volume in the control group caused by tissue deformation and swelling. On day 1, these abnormal volume changes were 13% and 55% smaller in the lower dose and higher dose nVNS groups, respectively, compared with the control group. By day 7, nVNS dampened cortical volume loss by 35% and 89% in the lower dose and higher dose nVNS groups, respectively, compared with the control group. Rotarod, beam walking, and anxiety performances were significantly improved in the higher-dose nVNS group on day 1 compared with the control group. The anxiety indices were also improved on day 7 post-injury compared with the control and the lower-dose nVNS groups. In conclusion, the higher dose nVNS (five 2 × 2-min stimulations) reduced brain lesion volume to a level that further refined the role of nVNS therapy for the acute treatment of TBI. Should nVNS prove effective in additional pre-clinical TBI models and later in clinical settings, it would have an enormous impact on the clinical practice of TBI in both civilian and military settings, as it can easily be adopted into routine clinical practice.

Keywords: brain lesion volume; magnetic resonance imaging; neurobehavioral outcomes; neuromodulation; traumatic brain injury; vagus nerve stimulation.


Conflict of interest statement

Eric Liebler is an employee of electroCore, Inc. Pascal Salazar is an employee of Canon Medical Informatics, Inc. The other authors have nothing to disclose.

Figures

FIG. 1.
FIG. 1.
Experiment setup configuration. (A) Modified gammaCore device for rat studies, (B) Miniaturized electrodes, (C) the non-invasive vagus nerve stimulation (nVNS) protocols used for the experiment: lower dose (five 2-min) stimulations and higher dose (five 2 × 2-min) stimulations. There are 10 min intervals between each stimulation, (D) Modified beam-walking apparatus (MBW), and (E) Standard elevated plus maze (EPM) apparatus. Color image is available online.
FIG. 2.
FIG. 2.
Sample T2-weighted images. Panels A & B are the control group on days 1 and 7, respectively. Panels C & D are the lower dose (2-min) non-invasive vagus nerve stimulation (nVNS) group on days 1 and 7, respectively. Panels E & F are the higher dose (2 × 2-min) nVNS group on days 1 and 7, respectively. Arrows point to the site of the injury. Panel G shows mean ± standard error of the mean (SEM) of brain lesion volume for the studied group on days 1 and 7 post-injury. Significant p values from the post-hoc Conover tests are shown for each time point.
FIG. 3.
FIG. 3.
Sample hematoxylin and eosin (H&E) staining shows the damaged area on the somatosensory cortex on day 7. (A) Control, (B) lower dose (2-min) non-invasive vagus nerve stimulation (nVNS), and (C) higher dose (2 × 2-min) nVNS. The H&E slides confirm the level of damage observed on the magnetic resonance image (MRI). Arrows point to the site of the injury. Color image is available online.
FIG. 4.
FIG. 4.
Apparent diffusion coefficient (ADC) % difference values. (A) On day 1, the ADC % difference is significantly reduced for the 2 × 2-min non-invasive vagus nerve stimulation (nVNS) group compared with the control group. Alhough not significant, a trend is also observed for the 2-min nVNS versus the control group and (B) On day 7, even though no significant intergroup reduction is observed for the % difference in ADC (not shown), the variance of the 2 × 2-min nVNS group is significantly reduced compared with the control group (Levene test: p = 0.028).
FIG. 5.
FIG. 5.
Voxel-based morphometry (VBM) statistical comparisons of brain volume changes without (control) and with non-invasive vagus nerve stimulation (nVNS) treatments (n = 40). Group means are displayed with red color (positive volume change) and blue color (negative volume change) compared with the intact baseline template. In composite images (overlaying the seven baseline T2W magnetic resonance imaging [MRI] templates with the analysis of variance [ANOVA] results) the regions of p < 0.05 are shown in red. The arrow in the day 1 composite coincides with the injury site. Color image is available online.
FIG. 6.
FIG. 6.
Neurobehavioral assessments for the studied groups on days 1 and 7 post-injury. (A) Rotarod time, (B) beam-walking time, (C) modified beam walking (MBW) anxiety index, and (D) Elevated plus maze (EPM) anxiety index. Error bars represent the standard error of the mean (SEM). Significant p values from the post-hoc Conover tests are shown for each time point.

References

    1. Corps KN, Roth TL, McGavern DB. Inflammation and neuroprotection in traumatic brain injury. JAMA Neurol 2015;72(3):355–362; doi:10.1001/jamaneurol.2014.3558 - DOI - PMC - PubMed
    1. Centers for Disease Control and Prevention. Report to Congress on Traumatic Brain Injury in the United States: Epidemiology and Rehabilitation. Atlanta: National Center for Injury Prevention and Control, Division of Unintentional Injury Prevention; 2014.
    1. Summers CR, Ivins B, Schwab KA. Traumatic brain injury in the United States: an epidemiologic overview. Mt Sinai J Med, New York 2009;76(2):105–110; doi:10.1002/msj.20100 - DOI - PubMed
    1. Kim CC, Nakamura MC, Hsieh CL. Brain trauma elicits non-canonical macrophage activation states. J Neuroinflammation 2016;13(1):117; doi:10.1186/s12974-016-0581-z - DOI - PMC - PubMed
    1. Ben-Menachem E, Revesz D, Simon BJ, et al. . Surgically implanted and non-invasive vagus nerve stimulation: a review of efficacy, safety and tolerability. Eur J Neurol 2015;22(9):1260–1268; doi:10.1111/ene.12629 - DOI - PMC - PubMed

Publication types