. 2023 May 29;35(6):1984-2005.
doi: 10.1093/plcell/koad059.

Hello darkness, my old friend: 3-KETOACYL-COENZYME A SYNTHASE4 is a branch point in the regulation of triacylglycerol synthesis in Arabidopsis thaliana

Affiliations

Hello darkness, my old friend: 3-KETOACYL-COENZYME A SYNTHASE4 is a branch point in the regulation of triacylglycerol synthesis in Arabidopsis thaliana

Urszula Luzarowska et al. Plant Cell. .

Abstract

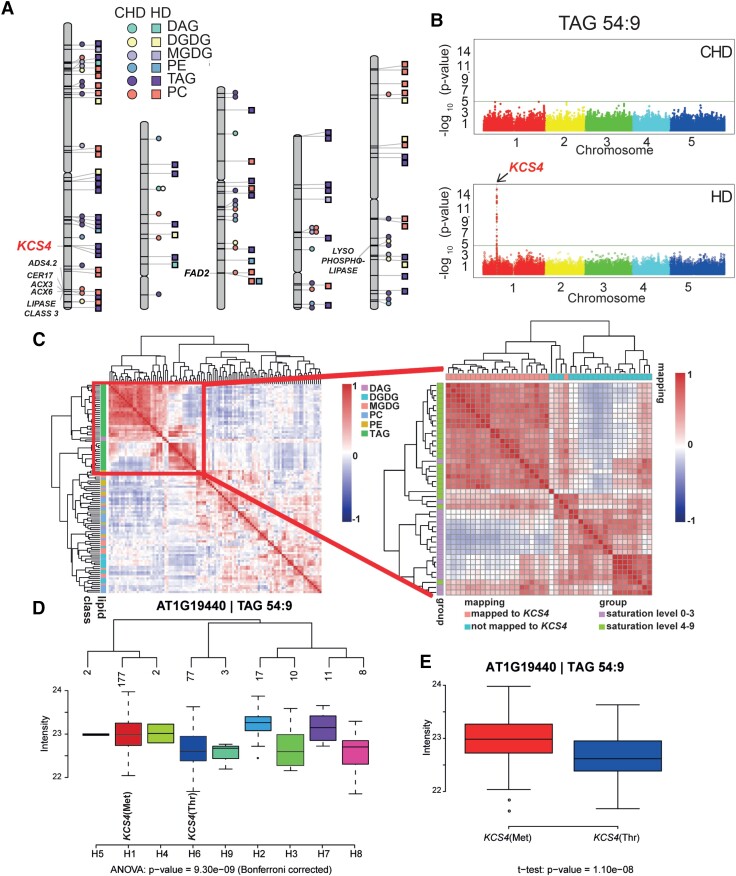
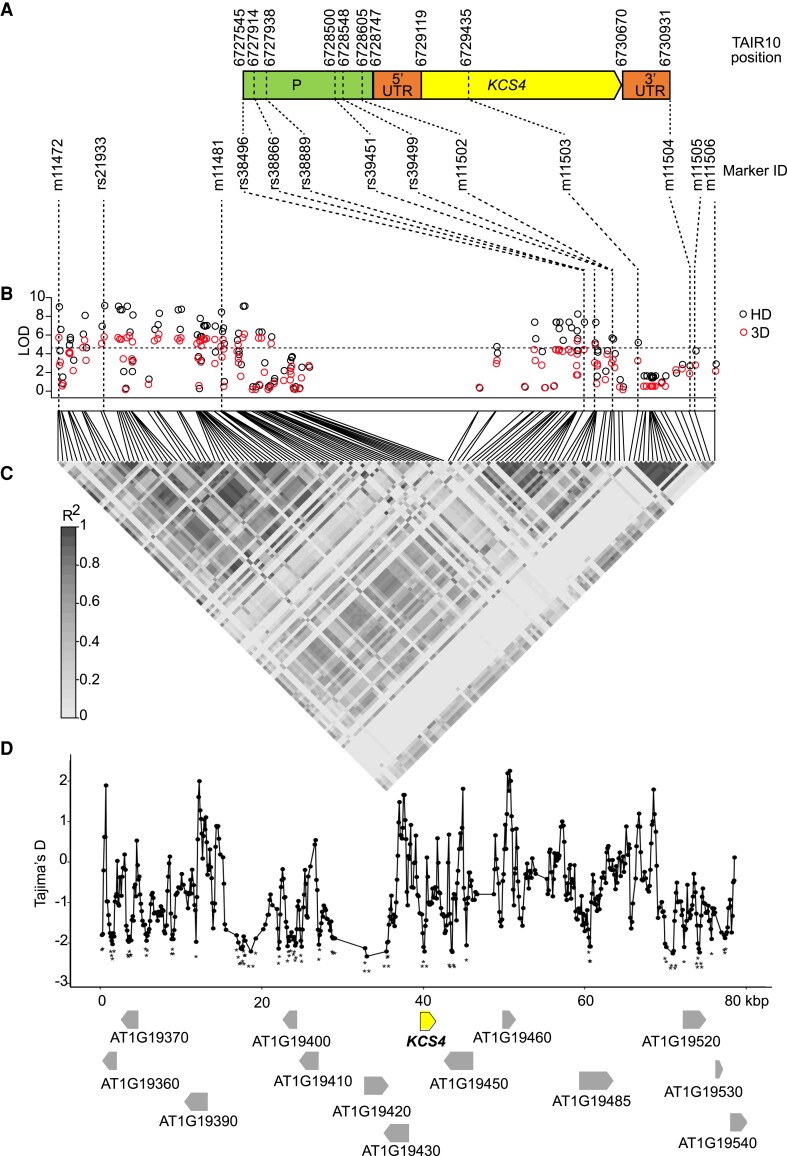
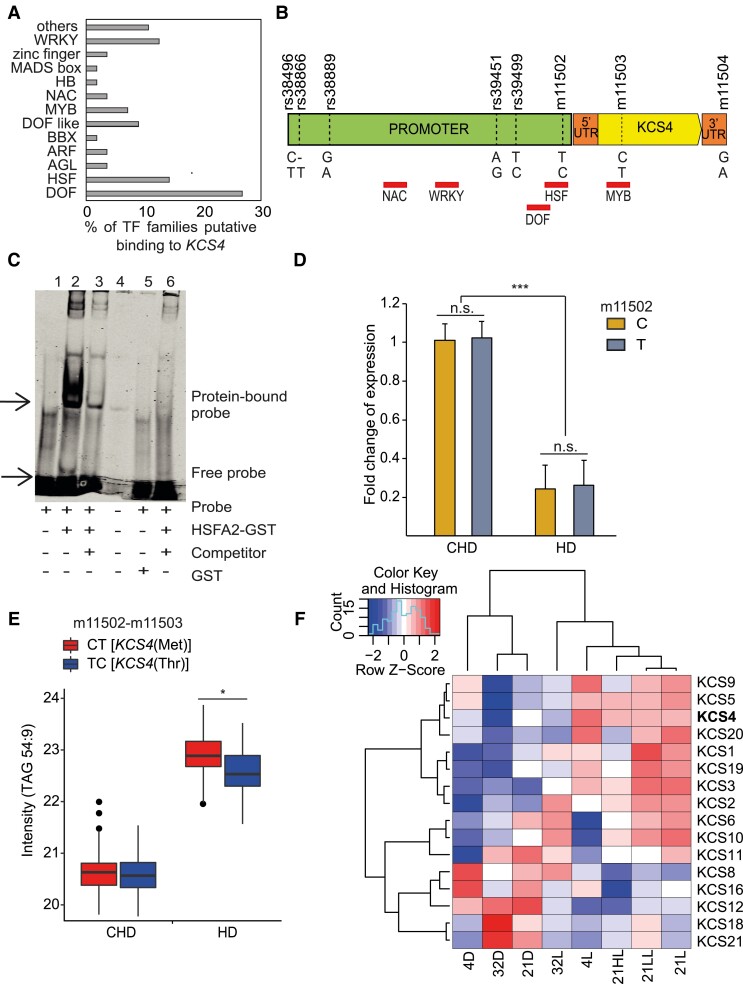
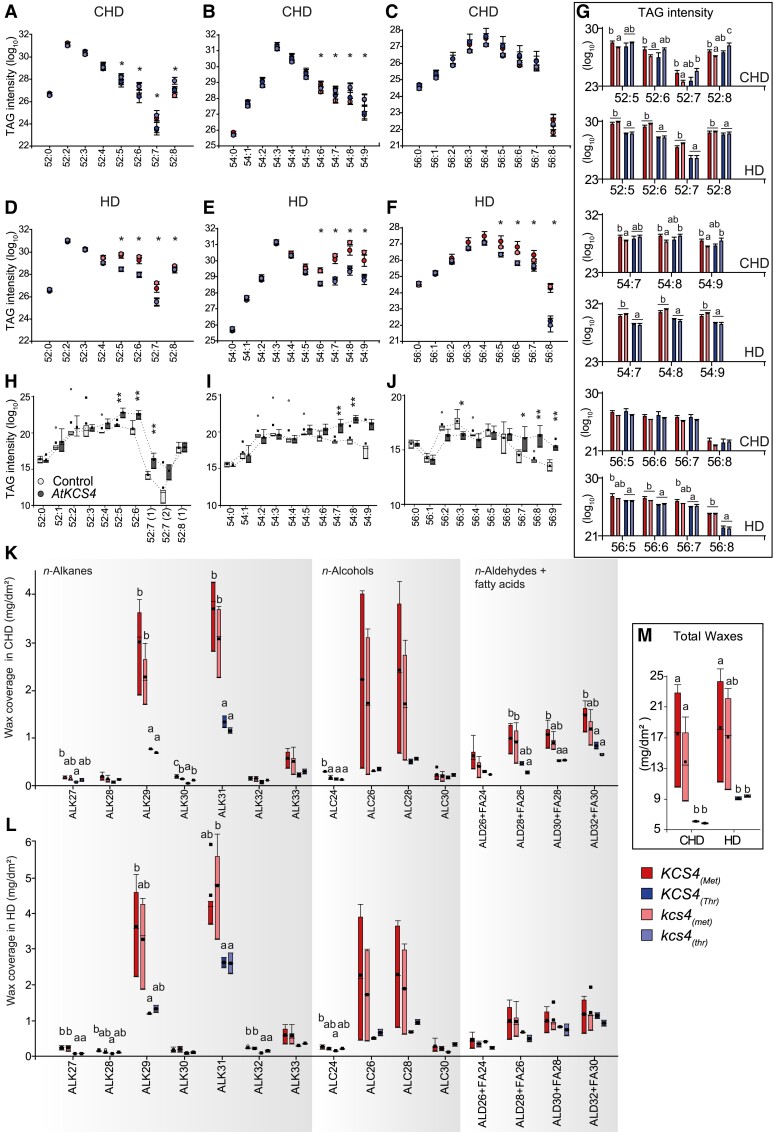
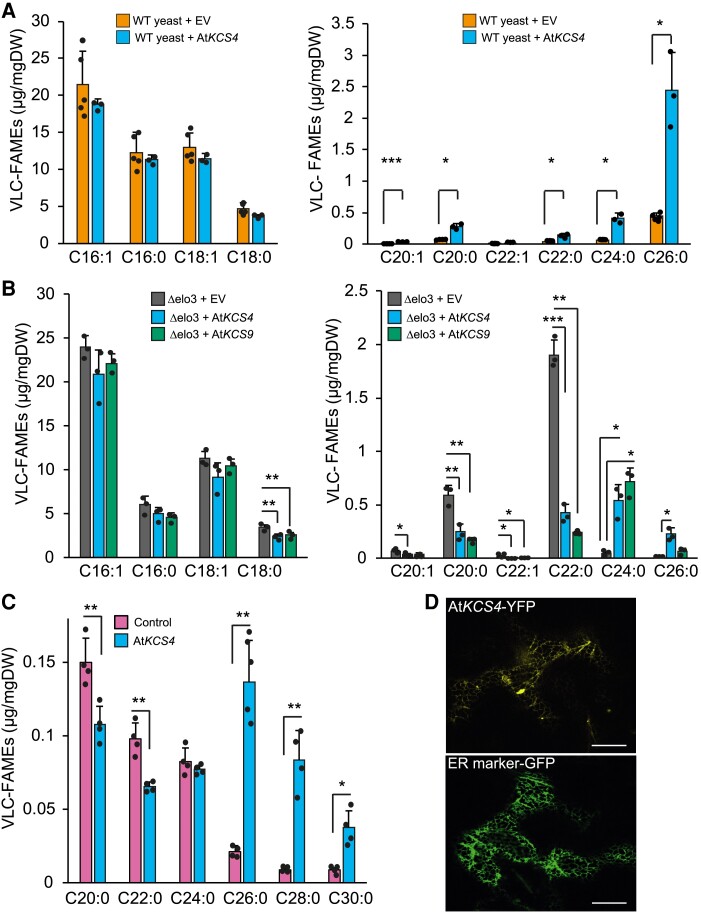
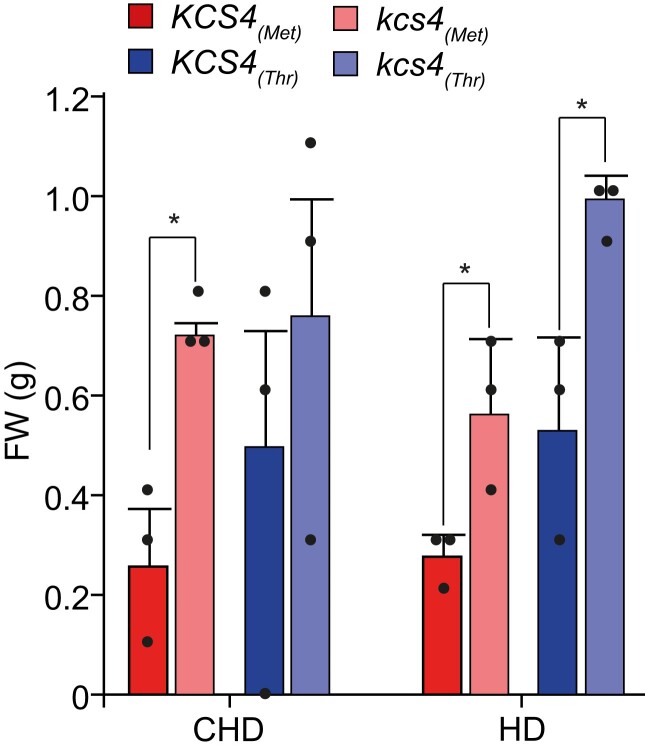
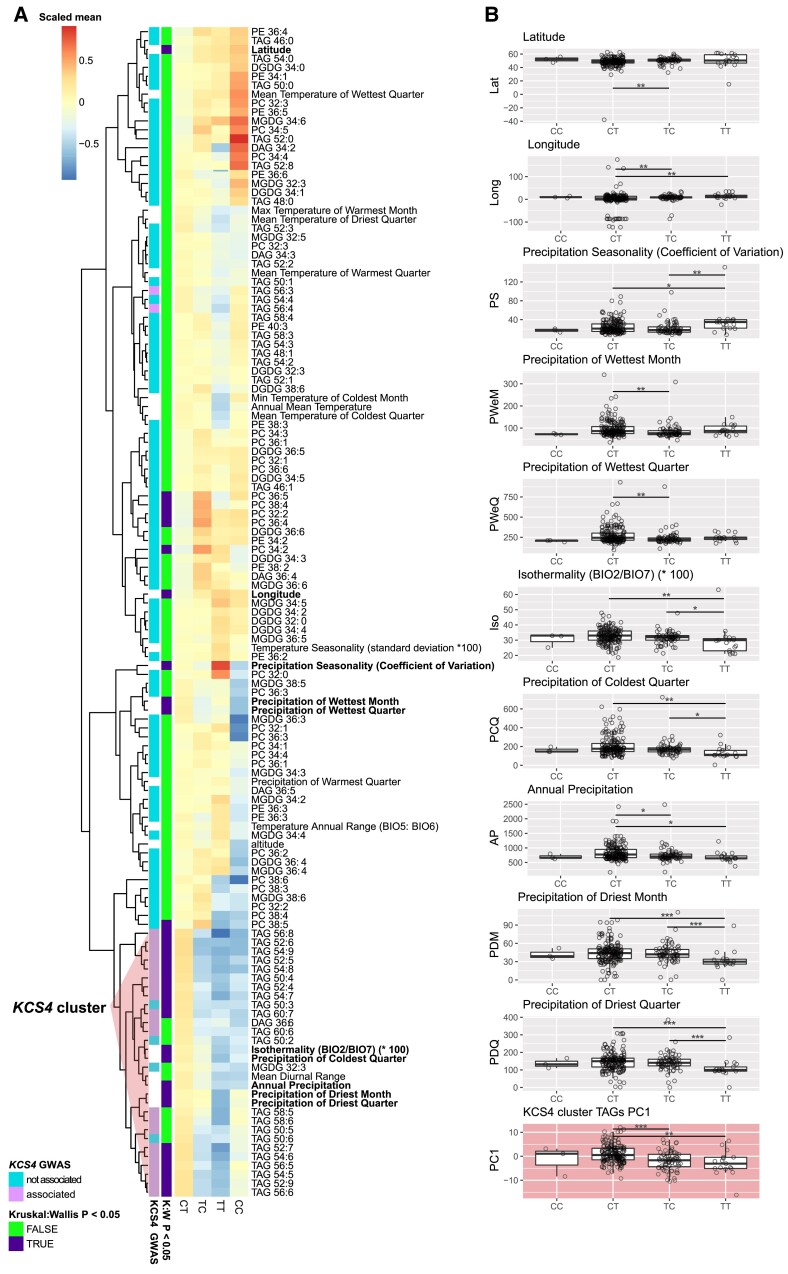
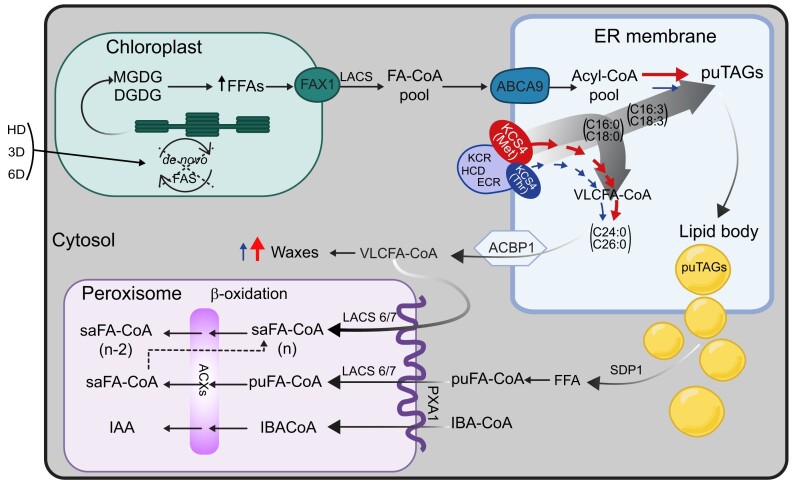
Plant lipids are important as alternative sources of carbon and energy when sugars or starch are limited. Here, we applied combined heat and darkness or extended darkness to a panel of ∼300 Arabidopsis (Arabidopsis thaliana) accessions to study lipid remodeling under carbon starvation. Natural allelic variation at 3-KETOACYL-COENZYME A SYNTHASE4 (KCS4), a gene encoding an enzyme involved in very long chain fatty acid (VLCFA) synthesis, underlies the differential accumulation of polyunsaturated triacylglycerols (puTAGs) under stress. Ectopic expression of KCS4 in yeast and plants proved that KCS4 is a functional enzyme localized in the endoplasmic reticulum with specificity for C22 and C24 saturated acyl-CoA. Allelic mutants and transient overexpression in planta revealed the differential role of KCS4 alleles in VLCFA synthesis and leaf wax coverage, puTAG accumulation, and biomass. Moreover, the region harboring KCS4 is under high selective pressure and allelic variation at KCS4 correlates with environmental parameters from the locales of Arabidopsis accessions. Our results provide evidence that KCS4 plays a decisive role in the subsequent fate of fatty acids released from chloroplast membrane lipids under carbon starvation. This work sheds light on both plant response mechanisms and the evolutionary events shaping the lipidome under carbon starvation.


Conflict of interest statement

Conflict of interest statement. None declared.

Figures

Figure 1.
Figure 1.
Results from GWAS analysis on lipidomic data from plants grown under control (CHD) and stress (HD) conditions. A) Chromosome scheme and QTL identified in the 2 experimental conditions (CHD = circles, HD = squares), for different lipid classes: phosphatidylethanolamine (PE), phosphatidylcholine (lecithin) (PC), MGDG, DGDG, diacylglycerol (DAG), and triacylglycerol (TAG). Color/shape references are included in the figure. Gene names are included only for colocalizing QTL for 2 or more lipid species with LOD > 5.3. B) Manhattan plots obtained for TAG 54:9 in CHD (top) and in HD (bottom). The KCS4 (AT1G19440) QTL was found at Chromosome 1 only under HD condition. C) Pearson correlations coefficients calculated between all lipid species across all accessions, for HD condition. Lipids are color-coded according to class (see reference at right) and clustered using Ward’s distance on pairwise dissimilarity. A zoom-in of the TAG cluster shows the grouping pattern of TAGs according to the number of unsaturated bonds and to the GWAS result (left). D) Average trait value (intensity of TAG 54:9, log2 scale) for the different KCS4 haplotypes using SNPs m11502, m11503, m11504, and m11505. The 2 major haplotypes have the alternative alleles for m11503 (Met or Thr) E. TAG 54:9 is the average value for accessions carrying the KCS4(Met) (left) and KCS4(Thr) (right) alleles.
Figure 2.
Figure 2.
Dissection of KCS4 alleles involved in TAG variation, pattern of LD, and signatures of selection. A)KCS4 gene model depicting promoter region (P), 5′UTR, coding region (KCS4), and 3′UTR of KCS4 (AT1G19440). Beginning, end and relevant SNP positions are indicated above (TAIR10) and below (SNP ID) gene structure. B) Manhattan plot of GWAS results (HD: black circles; 3D: red circles) obtained for TAG 54:9 using re-sequenced information for 149 accessions. The re-sequenced region on Chromosome 1 (positions 6689119 to 6769118, TAIR10) included 131 SNPs genotyped in the 250 K SNPchip plus 1,137 additional polymorphisms. Bonferroni threshold (LOD = 4.4) is indicated with a horizontal dashed line. C) LD is depicted as a heat map of the coefficient of correlation (r2). The LD block (0.8 > r2 > 0.2, P < 0.001) includes the lead SNPs rs21933 and m11481, SNPs in KCS4 promoter (rs39451, rs39499, m11502), in KCS4 genomic region (m11503) and in KCS4 3′UTR (m11504). D) Tajima's D value in sliding windows for the genomic region analyzed in (B). Gene models and gene orientation are depicted with arrows, KCS4 (in bold) is highlighted. Significantly negative Tajima's D values are marked with asterisks (*P < 0.05, **P < 0.01).
Figure 3.
Figure 3.
KCS4 transcriptional regulation. A) Percentage of TFs classes predicted to bind KCS4 genomic region according to in silico analysis of binding motives using DAP-seq database (O’Malley et al. 2016). B) Position of the binding motifs (red rectangles, names below) for the main TF classes. SNP positions in the promoter and in coding region are marked with vertical dash-lines and IDs are stated above gene model. C) EMSA showing the interaction between HEAT SCHOCK FACTOR A2 (HSFA2/AT2G26150) and the HSE binding motif (heat shock element: 5′-nnGnAnnTnCtn-3′) found within the SNP m11502 in KCS4 promoter region; 1: labeled probe (5′-DY682-labeled double-stranded oligonucleotide) only; 2: labeled probe plus HSFA2-GST protein; 3: labeled probe, HSFA2-GST protein and 200× competitor DNA (unlabeled oligonucleotide containing HSE binding site with the “C” allele at m11502), 4: well spill, 5: labeled probe plus free GST, 6: labeled probe, HSFA2-GST protein and 200× competitor DNA (unlabeled oligonucleotide containing HSE binding site with the “T” allele at m11502). D)KCS4 expression for the complete GWAS population in CHD and HD conditions, grouped based on C or T allele at SNP m11502 in KCS4 promoter region. Expression (fold change) was measured by RT-qPCR. Significant differences between CHD and HD transcript levels and between C and T alleles are shown (t-test: *P < 0.05, **P < 0.001, ***P < 0.0001, n.s. not significant). Data represent means ± Sd. For CHD n = 193 for the C allele and n = 94 for the T allele. For HD n = 163 for the C allele n = 75 for the T allele. E) Average trait value (TAG 54:9 intensity, in log2) for the 2 major haplotypes determined by SNPs m11502 (promoter) and m11503 (coding region). CT and TC haplotypes encodes for KCS4(Met) and KCS4(Thr), respectively. Significant differences between haplotypes (t-test: *P < 0.05). F) Heatmap of expression pattern for 16 members of the KCS multigene family clustered using complete-average method. Transcript abundance was measured 24 h after treatment. Data used in F was obtained previously (Caldana et al. 2011).
Figure 4.
Figure 4.
KCS4 functional validation using allelic mutants in Arabidopsis and heterologous expression in N. benthamiana.A–G) Average TAG profiles for wild-type (WT) accessions and allelic mutants carrying the KCS4(Met) allele (WT: red; mutant: pink) and the KCS4(Thr) allele (WT: blue; mutant: light-blue) in CHD and HD conditions. Dot plots (A–F) and bars (G) represent means ± Se, n = 14 to 25. One-way ANOVA followed by Fisher-Lsd post hoc test was performed to detect differences between lines for each TAG species. Significant changes (P < 0.05) are marked with asterisks (A–F) or different letters (G). H–J) Transient expression of AtKCS4(Met) in N. benthamiana leaves. Plants were grown in CHD conditions for the whole experiment. TAG levels for classes 52 (52:0 to 52:8), 54 (54:0 to 54:9) and 56 (56:0 to 56:0) for the control line (white) and for the AtKCS4(Met) line (dark grey). Box-plots (n = 3). Significant values (t-test) are indicated (*P < 0.05, **P < 0.01). K–M) Leaf cuticular wax coverage for WT accessions and allelic mutants carrying the KCS4(Met) allele (WT: red; mutant: pink) and the KCS4(Thr) allele (WT: blue; mutant: light-blue) in CHD and HD conditions. ALK: alkane, ALC: alcohol, ALD: aldehyde, FA: fatty acid. Box-plots (n = 4). One-way ANOVA followed by Fisher-Lsd post hoc test was performed to detect differences between lines for each wax species. Means with a common letter are not significantly different (P < 0.05).
Figure 5.
Figure 5.
KCS4 activity and specificity in FAE and subcellular localization. A) Very long chain fatty acid methyl ester (VLC-FAME) profiles (16 to 18 and 20 to 26, separate panels) of WT yeast transformed with an empty vector and AtKCS4(Met) (reference included in the figure). B) VLC-FAME profiles (16 to 18 and 20 to 26, separate panels) of Δelo3 yeast mutant transformed with an empty vector (EV, grey), AtKCS4(Met) (blue), and AtKCS9 (green). C) VLC-FAME profiles (20 to 30) from leaves of N. benthamiana control plants or transformed with AtKCS4(Met). Bars represent means ±Sd (n = 3 to 5), individual values are plotted as filled circles. Significant differences for t-test are shown (*P < 0.05, **P < 0.01, ***P < 0.001). D) Confocal images of N. benthamiana leaves transiently transformed with KCS4(Met)-YFP construct. The plasmid ER-GK CD3-955 was used as an ER marker. Scale = 20 µm. DW: dry weight.
Figure 6.
Figure 6.
Biomass changes in KCS4 WT and allelic mutants. Rosettes fresh-weight measured in accessions carrying KCS4(Met) allele (WT: red, mutant: pink) or KCS4(Thr) allele (WT: blue, mutant: light-blue). Plants were grown in control conditions (CHD) or subjected to heat and darkness for 24 h (HD). Data represent means ± Se, n = 3. Significant differences for t-test are shown (*P < 0.05).
Figure 7.
Figure 7.
KCS4 haplotype correlation with climate and geographic parameters. A) Heatmap of the mean values of lipid, climate, and geographical variables for each of the 4 KCS4 haplotypes (SNPs m11502-m11503). Results of the KCS4 locus association as well as nonparametric ANOVA test (Kruskal–Wallis) are highlighted in the row annotation bar. Cluster dominated by KCS4-associated TAGs is marked. B) Average haplotype value for the principal component 1 (PC1) obtained using the data in KCS4 cluster (in A), and the climate and geographical parameters showing significant Kruskal–Wallis in A. Significant differences are shown (pairwise Wilcoxon rank sum test: *P < 0.05, **P < 0.01, ***P < 0.001).
Figure 8.
Figure 8.
Model summarizing the role of KCS4 on FA fate in Arabidopsis under carbon starvation. The lack of de novo FA synthesis under heat and darkness (HD) or extended darkness (3D, 6D) induces the degradation of galactolipids (MGDGs and DGDGs) from the chloroplasts’ thylakoids. FFAs are then exported to the ER (FA-CoA pool), where KCS4 is localized and acts as a branch point in the fate of FAs, channeling saturated FAs to VLCFA elongation and tipping the balance to a higher polyunsaturated-to-saturated-FA ratio for puTAG accumulation (degrade grey arrows). Two KCS4 alleles have differential capacity to allocate saturated FAs into the VLCFA pathway, with a major -more efficient- allele, KCS4(Met), and a minor -weaker allele, KCS4(Thr), exemplified here in different sizes. KCS4(Met) accessions efficiently channel the saturated FA from the Acyl-CoA pool to cuticular waxes, as they present higher accumulation of waxes than KCS4(Thr) accessions under stress. In addition, polyunsaturated TAG (puTAGs) levels are, therefore, higher in KCS4(Met) accessions compared to KCS4(Thr) accessions, as the result of a rise in the ratio of polyunsaturated-to-saturated FAs going to TAG formation. VLCFA-CoA produced by the elongase complex (here exemplified by KCS4, KCR, HCD, ECR) go to increase the cuticular waxes under HD and/or directly serve as a source of carbon undergoing degradation in the peroxisome; whereas puTAGs accumulate into lipid bodies first. FFAs are then released from lipid bodies by the action of lipases (SDP1) and further imported to the peroxisome to undergo β-oxidation. Acronyms: ABCA9 (ATP-BINDING CASSETTE A9; AT5G61730), ACBP-1 (Acyl-CoA-binding protein 1; AT5G53470); ACX (ACYL-COA OXIDASE); CoA (coenzyme A); DGDG (digalactosyldiacylglycerol); ECR (ENOYL-COA REDUCTASE; AT3G55360); FAs (fatty acids); FAS (fatty acid synthesis); FAX1 (FATTY ACID EXPORT1; AT3G57280); FFAs (free fatty acids); HCD (β-HYDROXYACYL-COA DEHYDRATASE); IAA (indol-3-acetic-acid), IBA (indol-3-butyric-acid), KCR (β-KETOACYL REDUCTASE); KCS4(Met/Thr) (3-KETOACYL-COA SYNTHASE4); LACS (LONG-CHAIN ACYL-COA SYNTHETASE); SDP1 (SUGAR DEPENDENT1; AT5G04040); MGDG (monogalactosyldiacylglycerol); PXA1 (PEROXISOMAL ABC-TRANSPORTER 1; AT4G39850); pu (polyunsaturated), sa (saturated), TAGs (triacylglycerols); VLCFA (very long chain fatty acid).

References

    1. Alseekh S, et al. Mass spectrometry-based metabolomics: a guide for annotation, quantification and best reporting practices. Nat Methods. 2021:18(7):747–756. 10.1038/s41592-021-01197-1 - DOI - PMC - PubMed
    1. Anderson MJ. A new method for non-parametric multivariate analysis of variance. Austral Ecol. 2001:26(1):32–46. 10.1111/j.1442-9993.2001.01070.pp.x - DOI
    1. Baxter I, Brazelton JN, Yu D, Huang YS, Lahner B, Yakubova E, Li Y, Bergelson J, Borevitz JO, Nordborg M, et al. A coastal cline in sodium accumulation in Arabidopsis thaliana is driven by natural variation of the sodium transporter AtHKT1; 1. PLoS Genet. 2010:6(11):e1001193. 10.1371/journal.pgen.1001193 - DOI - PMC - PubMed
    1. Blacklock BJ, Jaworski JG. Substrate specificity of Arabidopsis 3-ketoacyl-CoA synthases. Biochem Biophys Res Commun. 2006:346(2):583–590. 10.1016/j.bbrc.2006.05.162 - DOI - PubMed
    1. Blomberg SP, Garland T Jr, Ives AR. Testing for phylogenetic signal in comparative data: behavioral traits are more labile. Evolution. 2003:57(4):717–745. 10.1111/j.0014-3820.2003.tb00285.x - DOI - PubMed

Publication types