. 2023 Apr 24;51(7):3391-3409.
doi: 10.1093/nar/gkad135.

PRRC2 proteins impact translation initiation by promoting leaky scanning

Affiliations

PRRC2 proteins impact translation initiation by promoting leaky scanning

Jonathan Bohlen et al. Nucleic Acids Res. .

Abstract

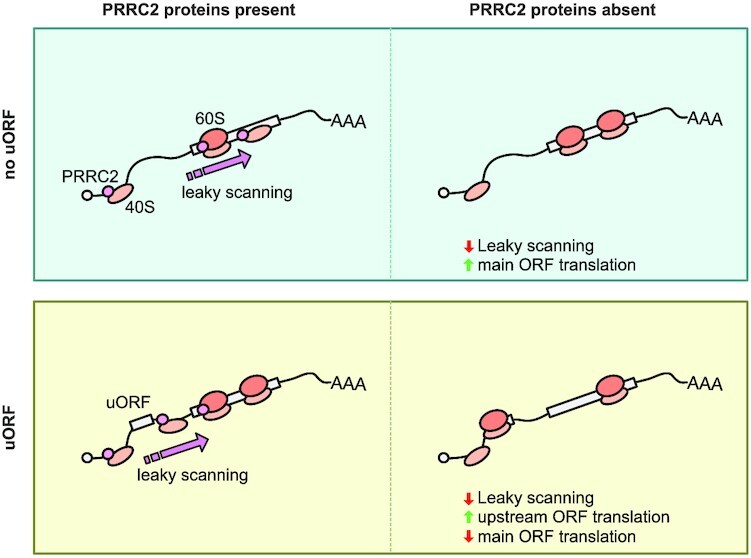
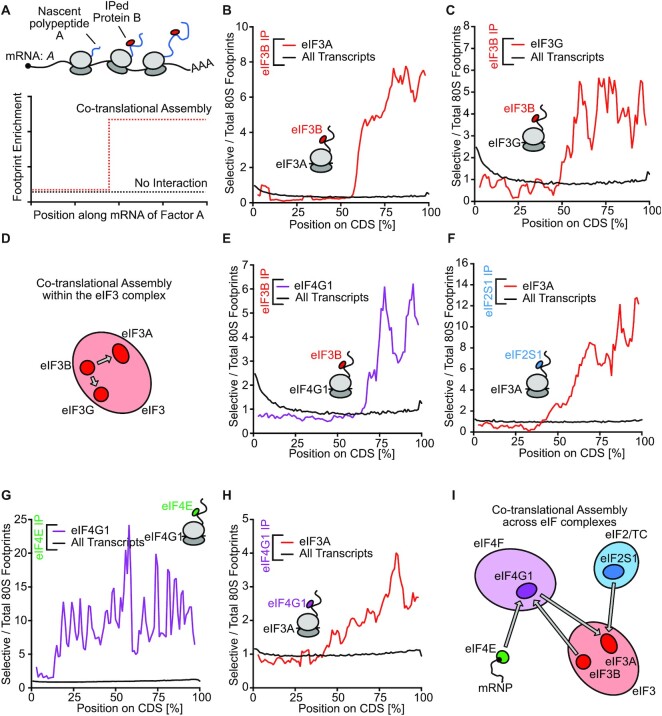
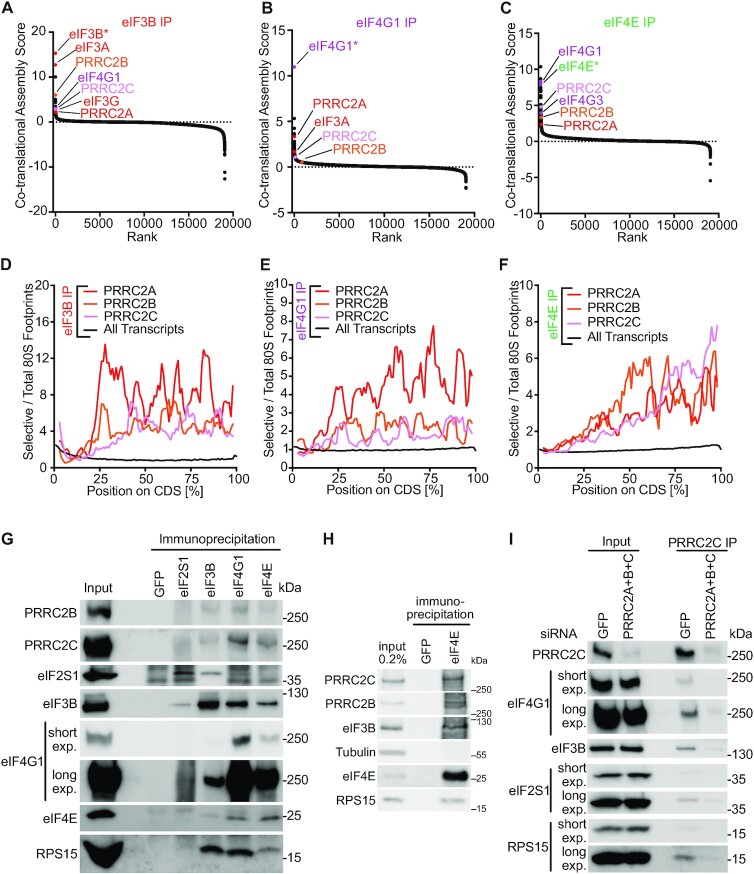
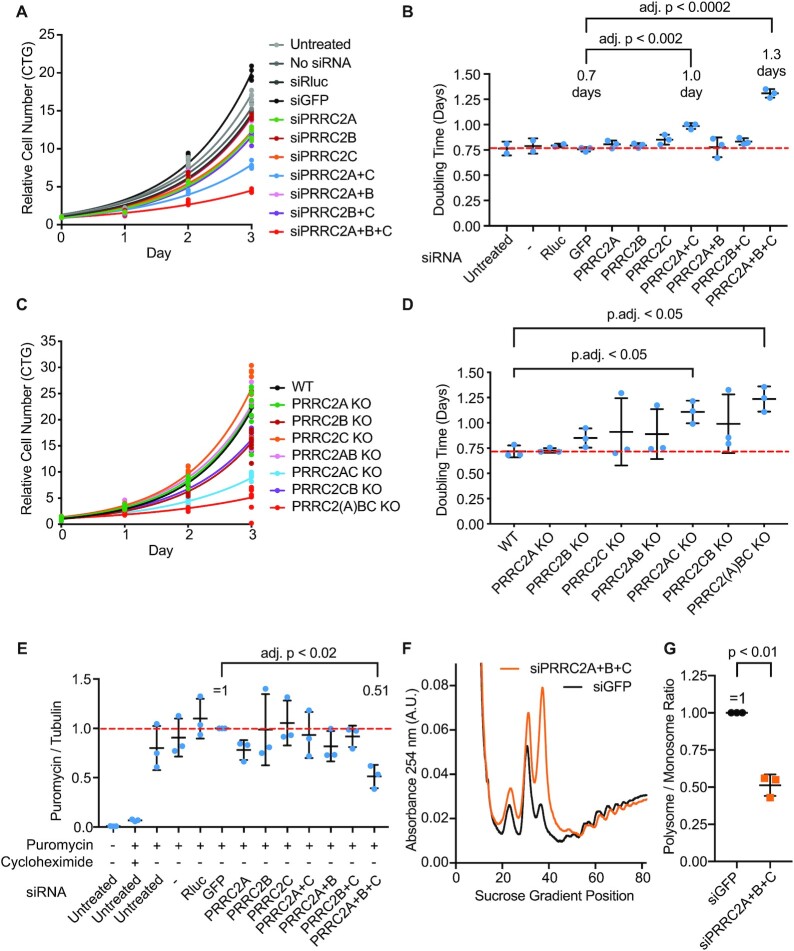
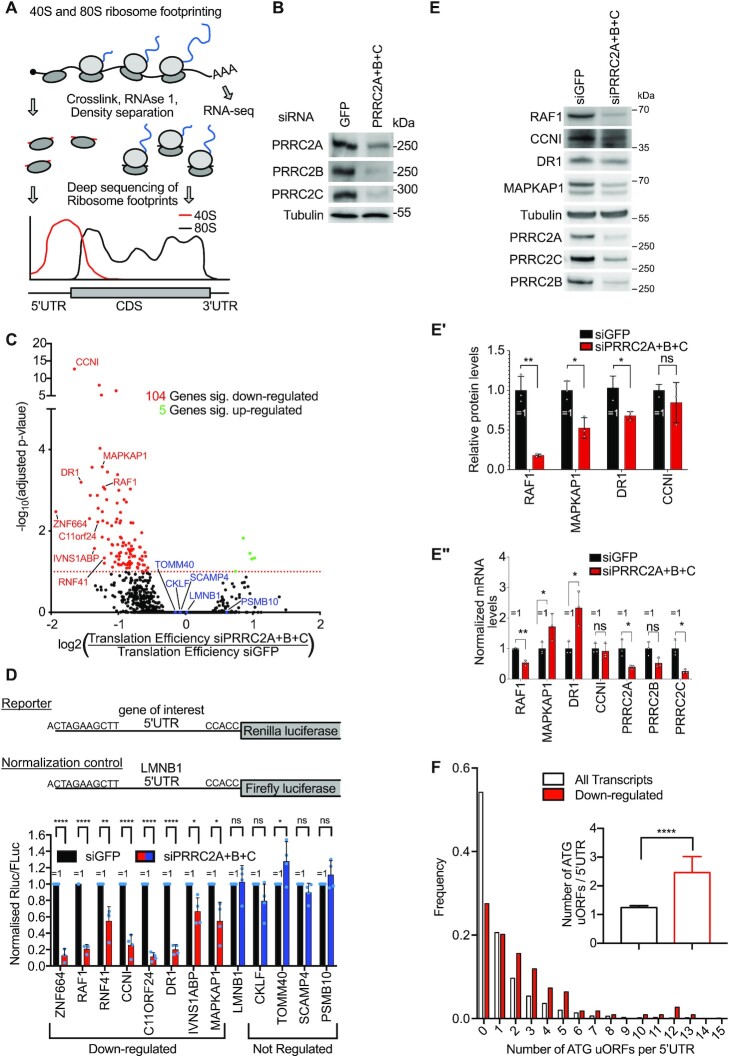
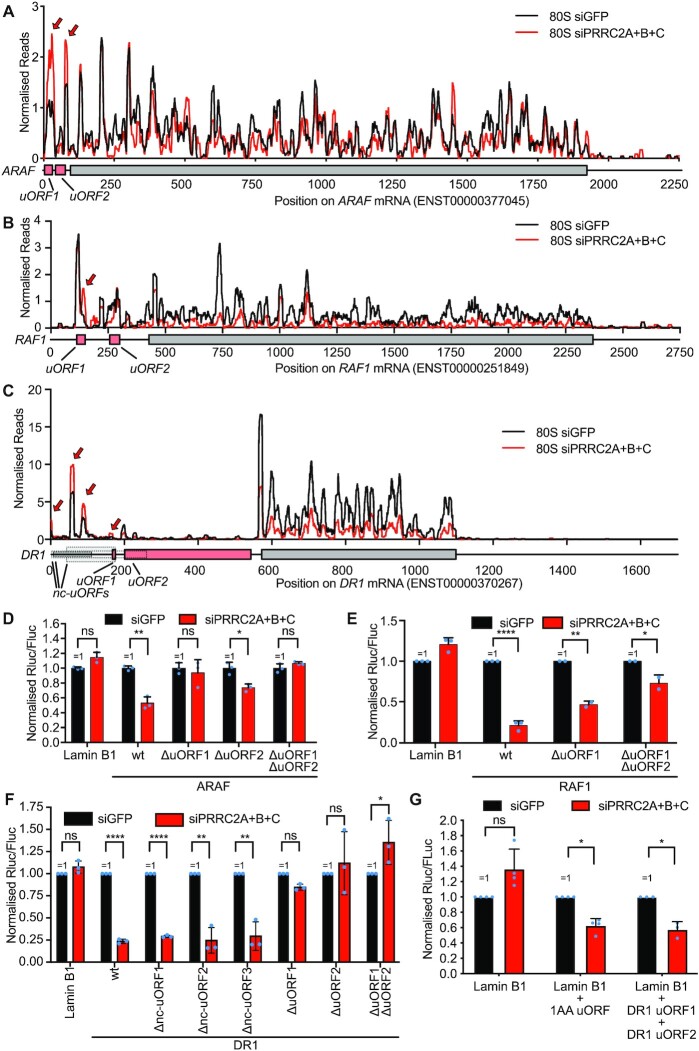
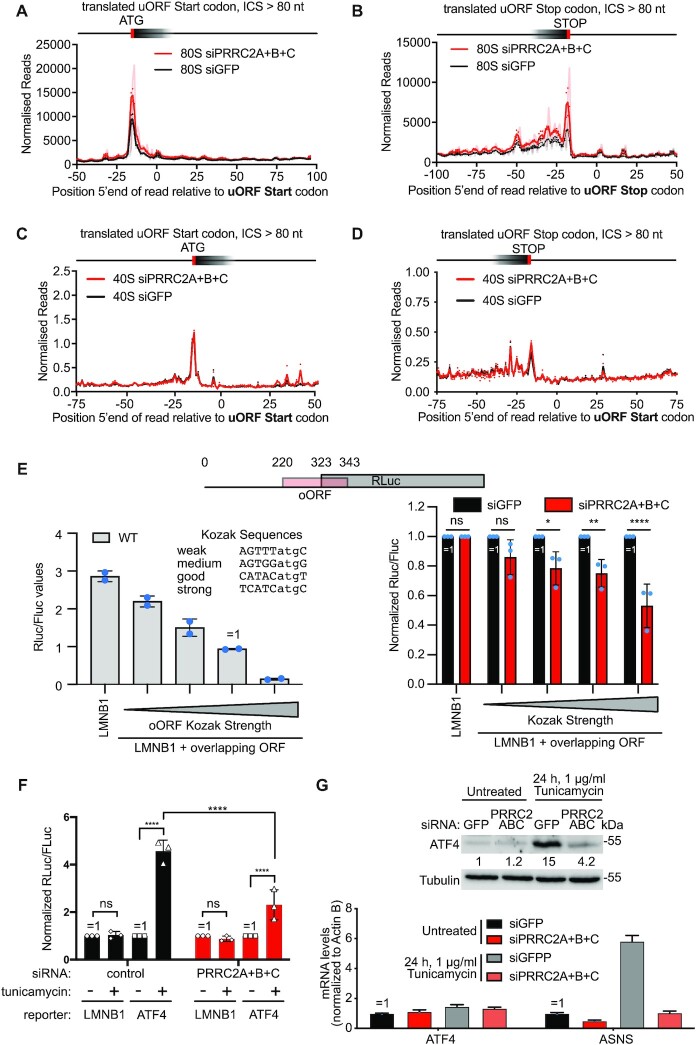
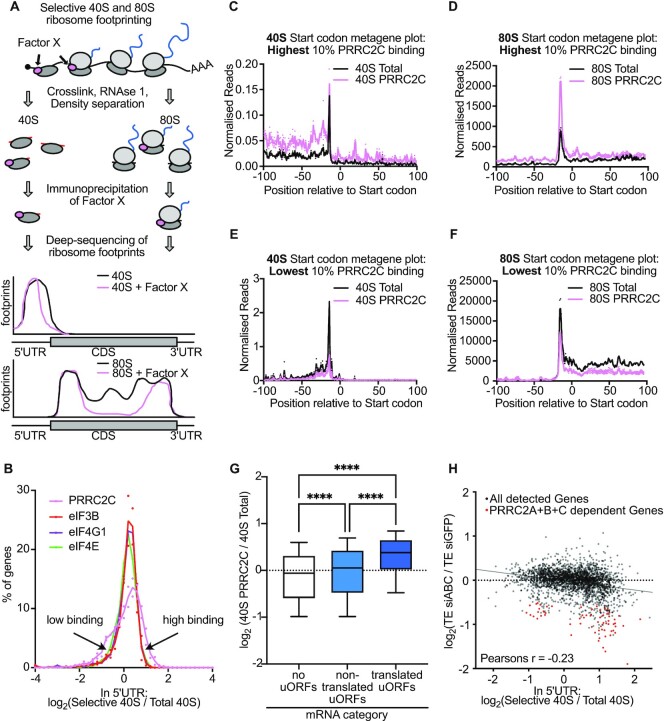
Roughly half of animal mRNAs contain upstream open reading frames (uORFs). These uORFs can represent an impediment to translation of the main ORF since ribosomes usually bind the mRNA cap at the 5' end and then scan for ORFs in a 5'-to-3' fashion. One way for ribosomes to bypass uORFs is via leaky scanning, whereby the ribosome disregards the uORF start codon. Hence leaky scanning is an important instance of post-transcriptional regulation that affects gene expression. Few molecular factors regulating or facilitating this process are known. Here we show that the PRRC2 proteins PRRC2A, PRRC2B and PRRC2C impact translation initiation. We find that they bind eukaryotic translation initiation factors and preinitiation complexes, and are enriched on ribosomes translating mRNAs with uORFs. We find that PRRC2 proteins promote leaky scanning past translation start codons, thereby promoting translation of mRNAs containing uORFs. Since PRRC2 proteins have been associated with cancer, this provides a mechanistic starting point for understanding their physiological and pathophysiological roles.


Figures

Graphical Abstract
Graphical Abstract
PRRC2A, PRRC2B and PRRC2C proteins impact translation initiation by promoting leaky scanning at the start codons of upstream ORFs (uORFs), overlapping uORFs (oORFs) and main ORFs. In the absence of PRRC2 proteins, translation of mRNAs lacking uORFs or oORFs increases. In contrast, on mRNAs that have high initiation rates on uORFs or oORFs, the absence of PRRC2 proteins causes translation of the uORF or oORF to increase and as a consequence translation of the main ORF is reduced.
Figure 1.
Figure 1.
Selective ribosome footprinting reveals co-translational assembly within and across eIF complexes. (A) Concept of co-translational assembly and its detection by selective ribosome footprinting. In case of co-translational assembly, ribosomes bound by the bait factor B are pulled down due to interaction with the nascent polypeptide chain A. Therefore, co-translational assembly will be visible as a sudden increase in the rate of factor B bound ribosomes observed on the mRNA of gene A, with the position of this increase representing the onset of interaction between factor B and the nascent chain. (B–D) eIF3B interacts with nascent eIF3A (B) and eIF3G (C). Ratio of eIF3B selective 80S ribosome footprints per total 80S ribosome footprints on the eIF3A (B) or eIF3G (C) mRNA coding sequence (red) and on the main coding sequence of all other transcripts (black). Length of coding sequences is scaled between 0 and 100%. Data are an average of two biological replicates. (D) Summary of co-translational interactions within the eIF3 complex detected in eIF3B selective 80S ribosome footprinting. (E–I) Co-translational assembly between eIF complexes. (E) eIF3B interacts with nascent eIF4G1, (F) eIF2S1 interacts with nascent eIF3A, (G) eIF4E interacts with nascent eIF4G1 and (H) eIF4G1 interacts with nascent eIF3A. Data are an average of two biological replicates. (I) Summary of co-translational interactions between eIF complexes detected in selective 80S ribosome footprinting.
Figure 2.
Figure 2.
eIF3 and eIF4 interact co-translationally with PRRC2 proteins, which are associated to pre-initiation complexes. (A–C) PRRC proteins have high eIF3B (A), eIFG1 (B) and eIF4E (C) co-translational assembly scores. Co-translational assembly scores, reflecting how well the footprint profile on an mRNA matches a step-function that shows increased binding as of a certain point on the profile, were determined as described in Methods, for all detected genes. Values were calculated from two biological replicates. (D–F) eIF3B, eIF4G1 and eIF4E interacts with nascent PRRC2A, PRRC2B and PRRC2C. Position-resolved number of eIF3B (D), eIF4G1 (E) and eIF4E (F) selective 80S ribosome footprints normalized to total 80S ribosome footprints on the PRRC2A, PRRC2B and PRRC2C mRNA coding sequences and on all transcript coding sequence (black). Length of coding sequences is scaled between 0 and 100%. Data are an average of two biological replicates. (G, H) PRRC2B and PRRC2C co-immunoprecipitate with eIF3B, eIF4G1 and eIF4E. Immunoprecipitation of eIF3B, eIF4G1 and eIF4E, but not control IgG (anti-GFP) from whole-cell lysates of crosslinked HeLa cells co-precipitates PRRC2B and PRRC2C. Immunoprecipitations were done on cell lysates from cells crosslinked with formaldehyde and DSP as described in the Methods and (24). (I) Immunoprecipitation of PRRC2C co-precipitates pre-initiation complexes (PIC). Immunoprecipitation of PRRC2C from whole-cell lysates of crosslinked HeLa cells co-precipitates eIFs and ribosomal proteins. As a specificity control, siRNA mediated depletion of PRRC2A + B + C strongly reduces the amounts of co-precipitated PIC components. Immunoprecipitations were done on cell lysates from cells crosslinked with formaldehyde and DSP as described in the Materials and Methods and (24).
Figure 3.
Figure 3.
PRRC2 proteins promote proliferation and mRNA translation. (A, B) PRRC2 proteins are required for optimal cell proliferation. Proliferation of HeLa cells upon knockdown of PRRC2 genes was assayed using Cell titer glo (A) and doubling times were calculated by fitting the data to exponential functions (B). (A) representative experiment. siRNAs targeting Renilla luciferase (siRLuc) and GFP were used as negative controls. (B) Quantification of three biological replicates. P-values were calculated by multiple, two-sided t-tests, not assuming equal standard deviations and correcting for multiple testing. (C, D) Proliferation of HeLa cells lines knocked out for different PRRC2 proteins or combination of knockouts assayed using Cell titer glo. (C) Representative example. (D) Quantification of three biological replicates. (E) PRRC2 proteins are required for optimal mRNA translation. Protein synthesis in HeLa cells after PRRC2 protein depletion was assayed by Puromycin incorporation probed by western blotting. n = 3 biological replicates. P-values were calculated by multiple, two-sided t-tests, not assuming equal standard deviations and correcting for multiple testing. (F, G) PRRC2 proteins are required for optimal mRNA translation. Protein synthesis in HeLa cells after PRRC2 protein depletion was assayed by polysome profiling. (F) Representative polysome profile. (G) Quantification of the polysome/monosome ratio for three biological replicates shown. Statistical significant was assessed with paired, two-sided t-test, P = 0.0073. All error bars = std dev.
Figure 4.
Figure 4.
PRRC2 proteins promote translation of mRNAs containing uORFs. (A) Principle of 40S and 80S ribosome footprinting. Polysomes containing 40s scanning and 80S translating ribosomes are fixed in cells, RNAse treated in whole cells lysates and separated by density centrifugation. Ribosome footprints are prepared into libraries and analyzed by next-generation sequencing. (B) Efficiency of PRRC2 protein depletion for Ribosome footprinting experiments as determined by western blotting. Result is representative of two biological replicates. (C) PRRC2 proteins act as translational activators. Volcano plot showing 104 significantly down-regulated (red) and 5 significantly up-regulated (green) genes at the translational level upon PRRC2A + B + C depletion. Plot shows log2(fold-change in Translation Efficiency) and adjusted P-values for all detected genes, as obtained by Xtail analysis. (D) PRRC2 proteins impact translation of mRNAs in virtue of their 5′UTRs. Activity of luciferase reporters carrying the 5′UTRs of down-regulated (red) and non-target (blue) genes from (C) upon PRRC2A + B + C depletion in HeLa cells. n = 3–4 biological replicates. P-values calculated by unpaired, two-sided, t-test and adjusted for multiple testing. P-values: *Padj. <0.05, **Padj. <0.005, ****Padj. < 0.00005, ns: Padj. >0.05. (E–E’’) Combined knockdown of PRRC2A + B + C causes reduced levels of RAF1, MAPKAP1, and DR1 proteins. (E) Representative immunoblot of control (siGFP) and PRRC2 knockdown cells. (E’) Quantification of protein levels from 3 biological replicates. (E’’) Corresponding mRNA levels from control and knockdown cells show that MAPKAP and DR1 mRNA levels do not decrease in PRRC2 knockdown cells. (F) uORFs are enriched in mRNAs affected by PRRC2 proteins. Histogram of the frequency of ATG-initiated uORFs per 5′UTR in PRRC2 dependent (n = 105) and independent (n = 5775) genes. Insert: Average number of ATG-initiated uORFs in PRRC2 dependent (n = 105) and independent (n = 5775) genes. Inset: mean number of uORFs per transcript; error bars: 95% confidence intervals. P-value < 0.0001 as calculated by Mann-Whitney test. All error bars = std dev.
Figure 5.
Figure 5.
uORFs are required for PRRC2-dependence. (A–C) Ribosome footprints on ARAF (A), RAF1 (B) and DR1 (C) mRNAs in control (black) or PRRC2-knockdown cells (red). Read counts were normalized to sequencing depth. Graphs were smoothened with a sliding window of 11nt (A), 16 nt (B) or 10nt (C). mRNA features: uORFs (pink), main ORF (grey) and uORFs with near-cognate start codons (dotted lines) that have evidence for initiation from aggregate harringtonine traces in GWIPs-viz (66). Red arrow indicates 80S accumulation on uORF. (D–F) uORFs are required for PRRC2 dependence of ARAF(D), RAF1 (E) and DR1 (F) luciferase reporters. Mutation of the uORFs removes or severely blunts the PRRC2-dependence. n = 2–3 biological replicates (E) or three biological replicates (D, F) ± standard deviation. P-values calculated by unpaired, two-sided, t-test and adjusted for multiple testing. P-values: *P.adj. <0.05, **Padj. <0.005, ****Padj. <0.00005, ns: Padj. >0.05. (G) Presence of uORFs is sufficient to induce PRRC2 translational regulation. Dual-luciferase translation reporter assay of LMNB1 (negative control) 5′UTR reporter and LMNB1 reporter with insertion of 1AA uORF or DR1 uORF1 + uORF2. Schematic diagrams of the reporters are shown in Supplementary Figure S4D. n = 3–4 biological replicates. P-values calculated by unpaired, two-sided, t-test and adjusted for multiple testing. P-values: *Padj. <0.05, ns: Padj. >0.05. All error bars = std dev.
Figure 6.
Figure 6.
PRRC2 proteins promote leaky scanning. (A–D) PRRC2 knockdown causes accumulation of 80S ribosomes (A, B), but not scanning 40S ribosomes (C-D) on AUG-initiated uORFs. Metagene plots of 80S (A-B) or 40S (C-D) footprints near uORF start (A, C) or stop codons (B, D) of translated, AUG-initiated uORFs with an intercistronic space between uORF stop and mORF start codon of at least 80 nucleotides. 80S graphs are normalized to library size. Each 40S library graph is normalized by the number required to equalize the regions indicated with ‘ = 1’ (scanning ribosomes) in Supplementary Figure S4B. Solid curves show data after triplet periodicity has been removed by averaging with a sliding window of 3 nt length. Shaded curves show non-smoothed data with triplet periodicity. (E) PRRC2 proteins promote leaky scanning. Luciferase reporter assay of Lamin B1 5′UTR reporters containing overlapping uORFs with start codons flanked by Kozak sequences of different strengths. Left panel: RLuc/FLuc ratios for the indicated reporters in wildtype cells shows the expected result that oORFs with stronger Kozak sequences inhibit RLuc translation more strongly. Right panel: PRRC2 knockdown reduces RLuc expression, and hence leaky scanning. n = 3 biological replicates ± standard deviation. P-values calculated by unpaired, two-sided, t-test and adjusted for multiple testing. P-values: *Padj. <0.05, **Padj. <0.005, ****Padj. <0.00005, ns: Padj. >0.05. (F) PRRC2 proteins are required for stress-dependent ATF4 induction via leaky scanning. Cells with PRRC2A + B + C or control siRNA knock-down were transfected with luciferase reporter bearing LMNB1 (negative control) 5′UTR or ATF4 5′UTR reporter. Induction of integrated stress response with 1 ug/ml tunicamycin shows blunted induction of ATF4 reporter upon PRRC2A + B + C knock-down. n = 3 biological replicates ± standard deviation. P-values: *Padj. <0.05, **Padj. <0.005, ****Padj. <0.00005, ns: Padj. >0.05. (G) PRRC2 knockdown causes impaired induction of ATF4 protein (top panel) and impaired transcriptional induction of the ATF4 target gene ASNS in response to stress (1 μg/ml tunicamycin 24 h). All error bars = std dev.
Figure 7.
Figure 7.
PRRC2C binding to mRNAs is heterogeneous and correlates to PRRC2-dependence. (A) Scheme and hypothetical example results of selective 40S and 80S ribosome footprinting. (B) PRRC2C binding to mRNAs is heterogenous when compared to binding of canonical eIFs. Histogram of the ratio of selective to total 40S ribosome footprints in 5′UTRs of all detected genes from PRRC2C, eIF3B, eIF4G1 and eIF4E selective 40S ribosome footprinting. n = 2 biological replicates. (C–F) Footprints of ribosomes bound to PRRC2C are elevated throughout selected mRNAs. Start codon metagene plots of mRNAs with highest (top 10%, C, D) or lowest (bottom 10%, E, F) PRRC2C binding of 40S ribosomes in 5′UTRs. High binding to 40S ribosomes in 5′UTRs (C, E) correlates with high binding to 80S ribosomes in 5′UTRs and coding sequences (D, F). 80S graphs are normalized to library size. Each 40S library graph is normalized by the number required to equalize the regions indicated with ‘ = 1’ (scanning ribosomes) in Supplementary Figure S4B. (G) Ribosomes containing PRRC2C are enriched on mRNAs containing translated uORFs. Transcripts were grouped into three categories: those without AUG-initiated uORFs (n = 1967), those containing bioinformatically annotated uORFs but no detectable 80S footprints on those uORFs (‘non-translated uORFs’, n = 2003), and those with translated uORFs (n = 2944). P values Kruskal-Wallis test followed by Dunn's multiple comparison ****Padj. <0.0001. (H) Genome-wide correlation between translational regulation by PRRC2 proteins and PRRC2C binding. Scatter plot of change in translational efficiency upon PRRC2A + B + C depletion versus PRRC2C binding rate to 40S ribosomes in 5′UTRs. Red dots: PRRC2-dependent transcripts from Figure 4C. Plot shows the average of two biological replicates.

Similar articles

Cited by

References

    1. Pelletier J., Sonenberg N.. The organizing principles of eukaryotic ribosome recruitment. Annu. Rev. Biochem. 2019; 88:307–335. - PubMed
    1. Hinnebusch A.G. The scanning mechanism of eukaryotic translation initiation. Annu. Rev. Biochem. 2014; 83:779–812. - PubMed
    1. de la Parra C., Walters B.A., Geter P., Schneider R.J.. Translation initiation factors and their relevance in cancer. Curr. Opin. Genet. Dev. 2018; 48:82–88. - PMC - PubMed
    1. Jackson R.J., Hellen C.U., Pestova T.V.. The mechanism of eukaryotic translation initiation and principles of its regulation. Nat. Rev. Mol. Cell Biol. 2010; 11:113–127. - PMC - PubMed
    1. Johnstone T.G., Bazzini A.A., Giraldez A.J.. Upstream ORFs are prevalent translational repressors in vertebrates. EMBO J. 2016; 35:706–723. - PMC - PubMed

Publication types