. 2023 Mar 3:kfad021.
doi: 10.1093/toxsci/kfad021. Online ahead of print.

A Model Template Approach for Rapid Evaluation and Application of Physiologically Based Pharmacokinetic Models: Extension to Volatile Organic Compounds

Affiliations

A Model Template Approach for Rapid Evaluation and Application of Physiologically Based Pharmacokinetic Models: Extension to Volatile Organic Compounds

Amanda S Bernstein et al. Toxicol Sci. .

Abstract

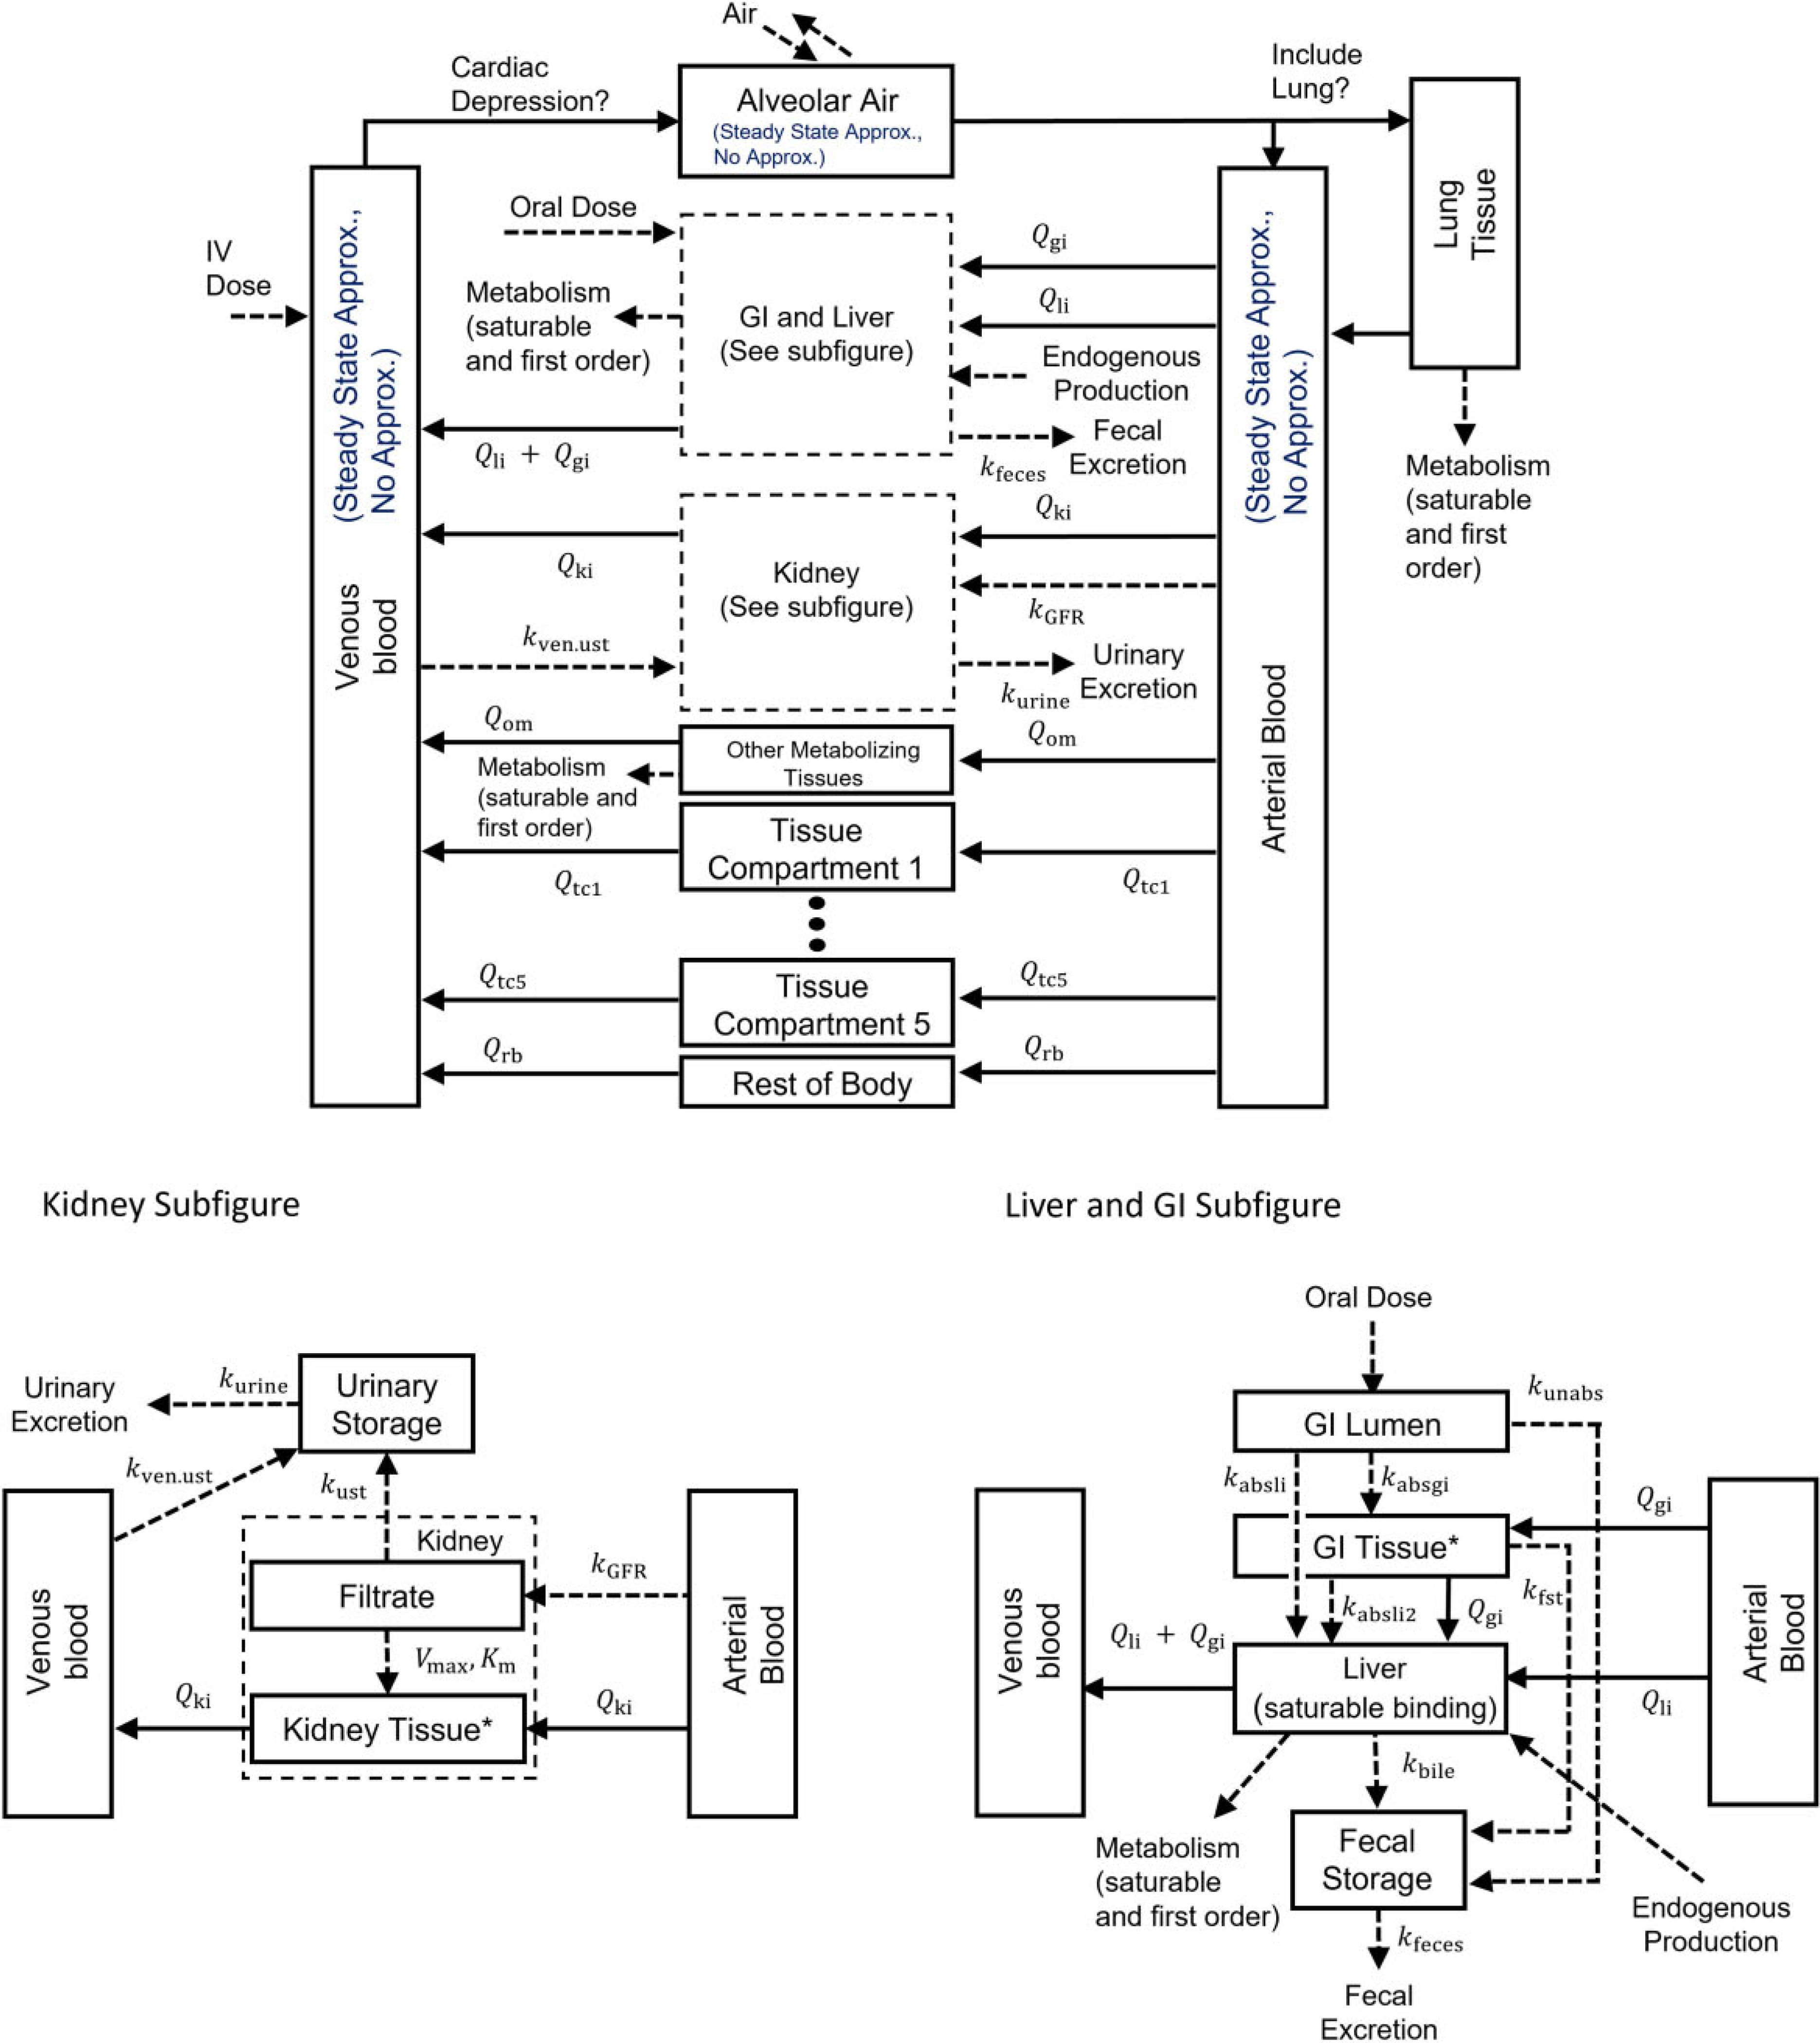
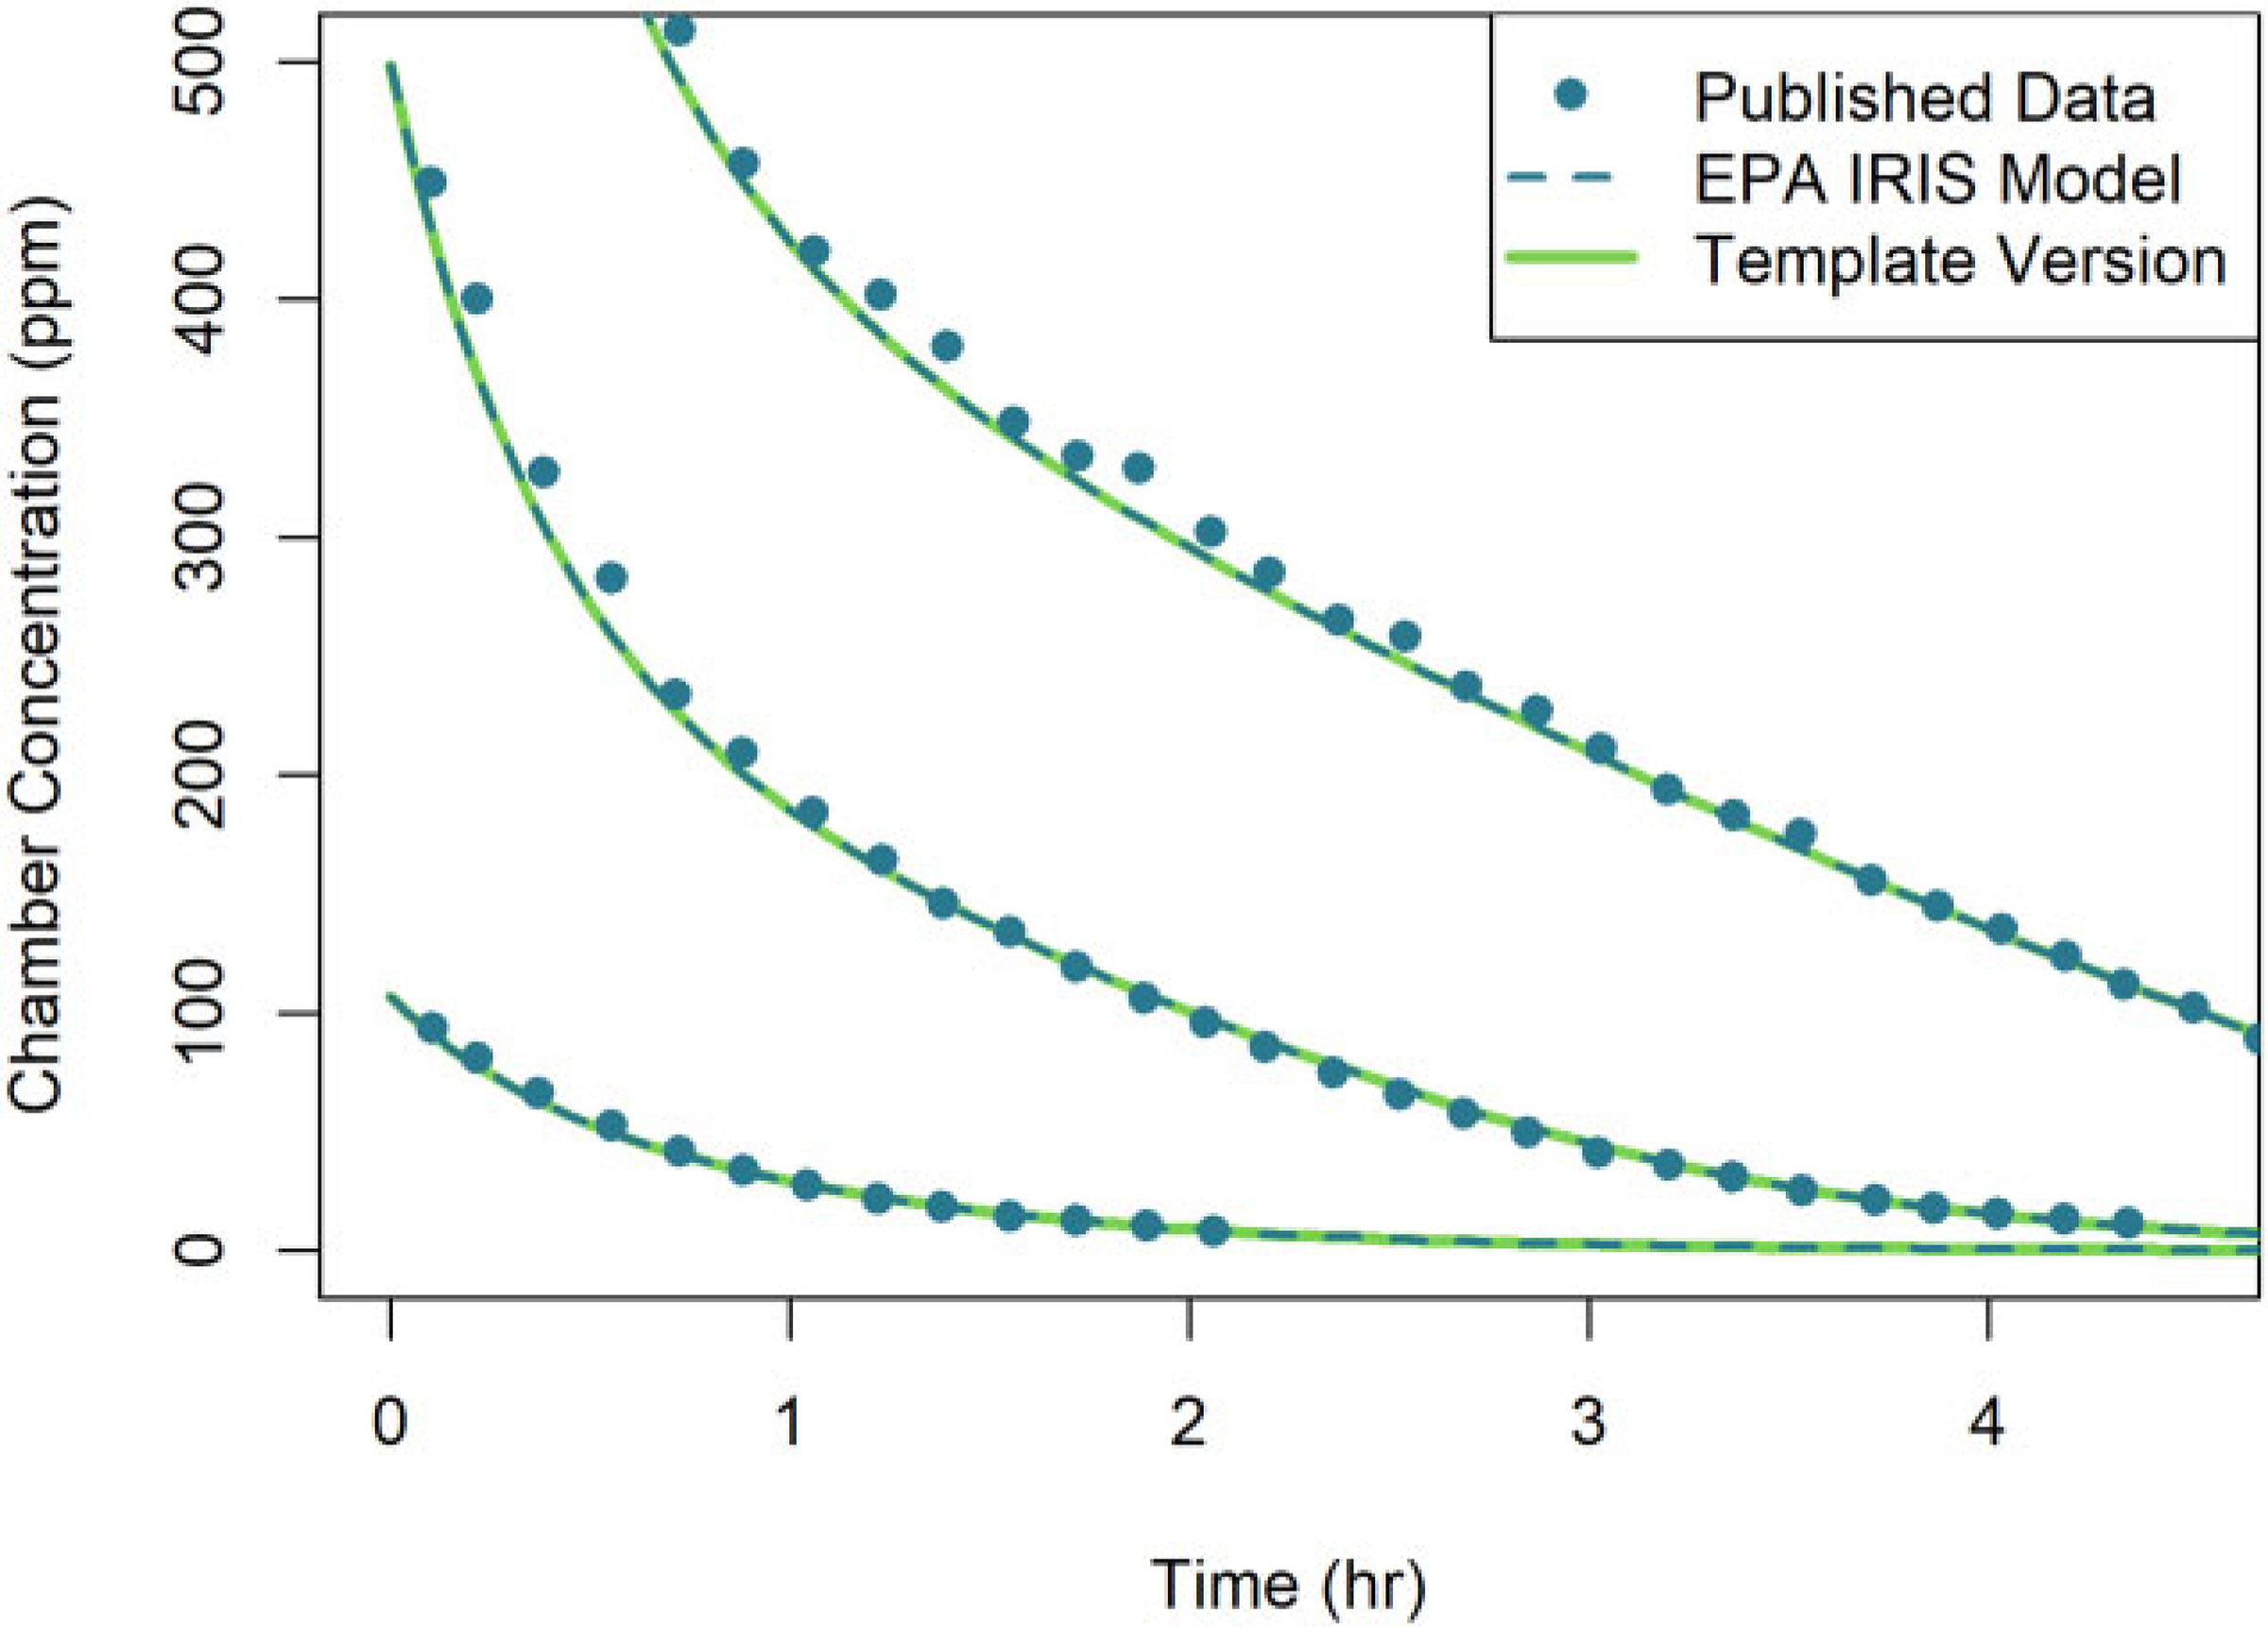
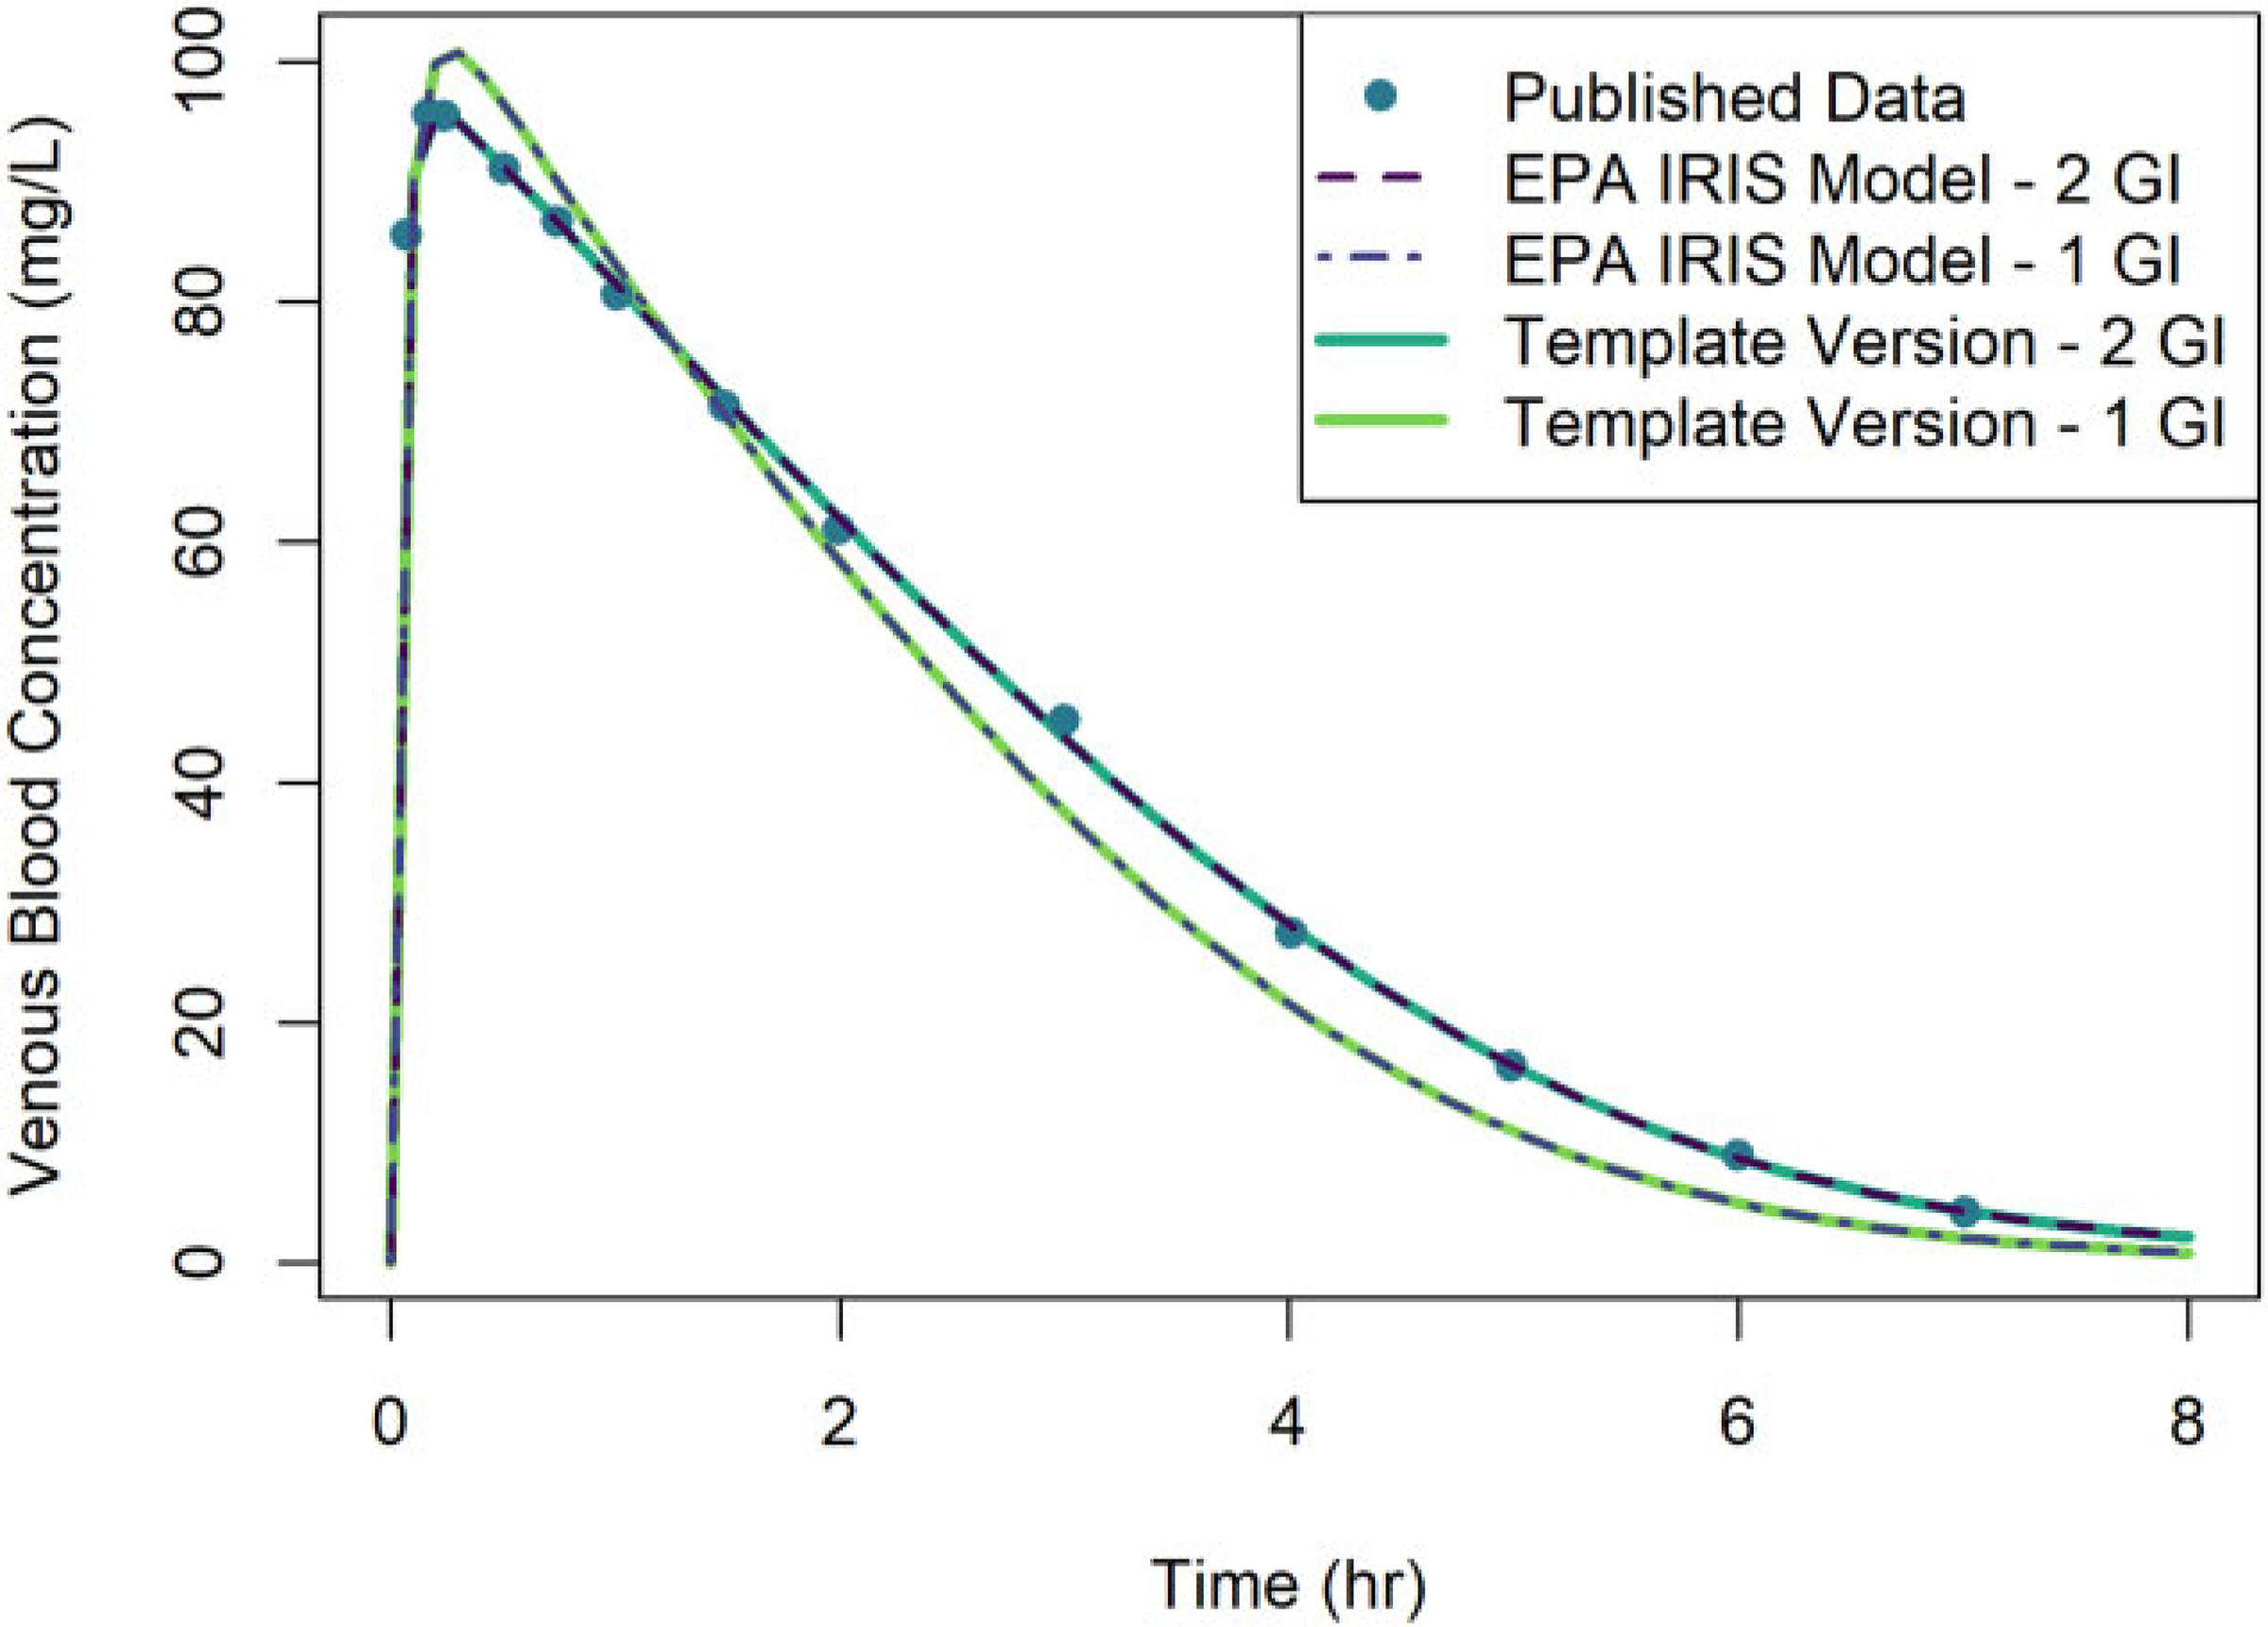
Chemical risk assessors use physiologically based pharmacokinetic (PBPK) models to perform dosimetric calculations, including extrapolations between exposure scenarios, species, and populations of interest. Assessors should complete a thorough quality assurance (QA) review to ensure biological accuracy and correct implementation prior to using these models. This process can be time-consuming, and we developed a PBPK model template that allows for faster, more efficient QA review. The model template consists of a single model "superstructure" with equations and logic commonly found in PBPK models, allowing users to implement a wide variety of chemical-specific PBPK models. QA review can be completed more quickly than for conventional PBPK model implementations because the general model equations have already been reviewed and only parameters describing chemical-specific model and exposure scenarios need review for any given model implementation. We have expanded a previous version of the PBPK model template by adding features commonly included in PBPK models for volatile organic compounds (VOCs). We included multiple options for representing concentrations in blood, describing metabolism, and modeling gas exchange processes to allow for inhalation exposures. We created PBPK model template implementations of published models for seven VOCs: dichloromethane, methanol, chloroform, styrene, vinyl chloride, trichloroethylene, and carbon tetrachloride. Simulations performed using our template implementations matched published simulation results to a high degree of accuracy (maximum observed percent error: 1%). Thus, the model template approach can now be applied to a broader class of chemical-specific PBPK models while continuing to bolster efficiency of QA processes that should be conducted prior to using models for risk assessment applications.

Keywords: PBPK model; VOCs; pharmacokinetics; risk assessment; template model.


Conflict of interest statement

Declaration of conflicting interests

The authors declared no potential conflicts of interest with respect to the research, authorship, and/or publication of this article.

Figures

Figure 1.
Figure 1.
Model template superstructure for PBPK models. Chemical is introduced into the plasma (IV), the GI lumen (oral), or the alveolar air (inhalation).The absorbed fraction of an oral dose enters the GI tissue or the liver by a first-order absorption rate constant kabsgi or kabsli, respectively, and chemical absorbed into the GI tissue is absorbed into the liver by a first-order absorption rate constant kabsli2. Note, by setting the GI blood flow to zero, the “GI Tissue” compartment can be used to represent a second GI compartment. The unabsorbed fraction enters the fecal storage compartment by a first-order rate constant kunabs. Chemical can also pass to the fecal storage compartment from the GI tissue by the first-order rate constant kfst or from the liver by the first-order rate constant kbile. The kidney is separated into the filtrate compartment and the tissue compartment. Chemical enters the filtrate from the plasma by a first-order rate constant kGFR, and, once in the filtrate compartment, chemical can be reabsorbed by a saturable process with maximum transport rate Vmax and affinity constant Km or eliminated to the urinary storage compartment by a first-order rate constant kust. Chemical can also be eliminated to the urinary storage compartment from the venous blood by a first-order rate constant kven.ust. Chemical is eliminated from the fecal and urinary storage compartments by first-order rate constants kfeces and kurine, respectively. Qx is the plasma flow rate between plasma and tissue x. Tissue compartments 1–5 are basic tissue compartments without metabolism, facilitated transport, or saturable binding processes. Saturable and first-order metabolic pathways are included in the liver, lung, and other metabolizing tissue compartments. A zero-order production rate is included in the liver to model endogenous production or background exposures to the chemical. A cardiac depression term is included that is based on the concentration in the rest of body compartment. Venous blood, arterial blood, and gas exchange in the alveolar air can each be modeled with or without a steady state approximation, and the lung compartment can be optionally excluded as an explicit compartment if using the steady state approximation for the gas exchange process. Additional information and a listing of all parameters included in the template are available in the Supplementary Materials.
Figure 2.
Figure 2.
Mapping published PBPK model structures to the model template superstructure. To implement a published model using the PBPK model template, the existing structure must be mapped onto the model template superstructure by setting the appropriate parameters. For each of the published models, we set unused parameters to zero, and for unused compartments we set the blood flow for that compartment to zero. Each mapping is shown here by using lighter colored arrows, boxes, and text for parameters and compartments that are “switched off” or set to zero for (A) the DCM model of U.S. EPA (2011) and (B) the methanol model of U.S. EPA (2013). Mapping diagrams for the chloroform model of Sasso et al. (2013), the styrene model of Ramsey and Andersen (1984), and the general VOC model of Yoon et al. (2007) are shown in Supplementary Figure 2.
Figure 3.
Figure 3.
Comparison of simulation results obtained using two different implementations of the U.S. EPA (2011) PBPK model for DCM: (1) the original U.S. EPA (2011) (or “EPA IRIS Model”) implementation (dashed lines) and (2) the PBPK model template implementation (solid lines). Results are shown for the respiratory uptake by three rats in a closed-chamber exposed to three concentrations of DCM (107, 498, and 1028 ppm). Simulation results from the original U.S. EPA (2011) implementation and published data of Gargas et al. (1986) (points) were obtained from Figure C-3 of U.S. EPA (2011). Note that the respective predictions from each model implementation are nearly indistinguishable visually.
Figure 4.
Figure 4.
Comparison of simulation results obtained using two different implementations of the U.S. EPA (2013) PBPK model for methanol: (1) the original U.S. EPA (2013) (or “EPA IRIS Model”) implementation (dashed lines) and (2) the PBPK model template implementation (solid lines). Results are shown for the venous blood concentration of female rats exposed to five constant concentration levels of methanol (ranging from 1000 to 20 000 ppm) for 8 h. Simulation results from the original U.S. EPA (2013) implementation and published data of Perkins et al. (1996) (points) were obtained from Figure B-4, Panel A, of U.S. EPA (2013). Note that the respective predictions from each model implementation are nearly indistinguishable visually.
Figure 5.
Figure 5.
Comparison of simulation results obtained using two different implementations of the U.S. EPA (2013) PBPK model for methanol: (1) the original U.S. EPA (2013) (or “EPA IRIS Model”) implementation (dashed lines) and (2) the PBPK model template implementation (solid lines). Results are shown for the venous blood concentration of rats given a single oral dose of 100 mg/kg of methanol. Simulations were performed using both a 1-compartment model for the GI tract and a 2-compartment model. Simulation results from the original U.S. EPA (2013) implementation and published data of Ward et al. (1997) (points) were obtained from Figure B-5 of U.S. EPA (2013). Note that the respective predictions from each model implementation are nearly indistinguishable visually.
Figure 6.
Figure 6.
Comparison of simulation results obtained using two different implementations of the U.S. EPA (2013) PBPK model for methanol: (1) the original U.S. EPA (2013) (or “EPA IRIS Model”) implementation (dashed lines) and (2) the PBPK model template implementation (solid lines). Results are shown for simulations of humans exposed to three concentrations of methanol in inhaled air (78, 157, and 231 ppm). Simulations from the original U.S. EPA (2013) implementation and published data of Sedivec et al. (1981) (points) were obtained from Figure B-8 (top panel) of U.S. EPA (2013). Note that the respective predictions from each model implementation are nearly indistinguishable visually.
Figure 7.
Figure 7.
Comparison of simulation results using two different implementations of the U.S. EPA (2013) PBPK model for methanol: (1) the original U.S. EPA (2013) (or “EPA IRIS Model”) implementation (dashed line) and (2) the PBPK model template implementation (solid line). Results are shown for venous blood concentrations of methanol for humans given a bolus oral dose of 10 mg/kg of methanol. Simulations from the original U.S. EPA (2013) implementation and published data of Schmutte et al. (1988) (points) were obtained from Figure B-11 of U.S. EPA (2013). Note that the respective predictions from each model implementation are nearly indistinguishable visually.
Figure 8.
Figure 8.
Comparison of simulation results using two different implementations of the U.S. EPA (2013) PBPK model for methanol: (1) the original U.S. EPA (2013) (or “EPA IRIS Model”) implementation (dashed line) and (2) the PBPK model template implementation (solid line). Results are shown for venous blood concentrations of methanol for humans exposed to an IV dose of 10 mg/kg of methanol given over a period of 10 min. Simulations from the original U.S. EPA (2013) implementation and published data of Haffner et al. (1992) (points) were obtained from Figure B-13 of U.S. EPA (2013). Note that the respective predictions from each model implementation are nearly indistinguishable visually.
Figure 9.
Figure 9.
Comparison of simulation results using two different implementations of the chloroform PBPK model of Sasso et al. (2013): (1) the original Sasso et al. (2013) implementation (dashed line) and (2) the PBPK model template implementation (solid line). Results are shown for venous blood, fat, liver, and kidney chloroform concentrations for rats given an oral bolus dose of 55 mg/kg of chloroform and simultaneously exposed to a constant concentration of 100 ppm of chloroform for 360 min. Simulations from the original Sasso et al. (2013) implementation and published data from Take et al. (2010) (points) were obtained from Figure 3 of Sasso et al. (2013). Note that the respective predictions from each model implementation are nearly indistinguishable visually.
Figure 10.
Figure 10.
Comparison of simulation results using two different implementations of the chloroform PBPK model of Sasso et al. (2013): (1) the original Sasso et al. (2013) (or “Published Model”) implementation (dashed lines) and (2) the PBPK model template implementation (solid lines). Results are shown for the respiratory uptake in mice exposed to three concentrations of chloroform (1000, 2500, and 5000 ppm). Simulations from the original Sasso et al. (2013) implementation and experimental published data from Corley et al. (1990) (points) were obtained from Figure 2 of Sasso et al. (2013). Note that the respective predictions from each model implementation are nearly indistinguishable visually.
Figure 11.
Figure 11.
Comparison of simulation results using two different implementations of the Ramsey and Andersen (1984) PBPK model for styrene: (1) the original Ramsey and Andersen (1984) (or “Published Model”) implementation (dashed lines) and (2) the PBPK model template implementation (solid lines). Results are shown for venous blood concentrations of styrene for rats exposed to a constant inhaled concentration of styrene (ranging from 80 to 1200 ppm) for 6 h. Simulations from the original Ramsey and Andersen (1984) implementation and published data of Young et al. (1979) (points) were digitized from Figure 2 of Ramsey and Andersen (1984). Note that the respective predictions from each model implementation are nearly indistinguishable visually.
Figure 12.
Figure 12.
Comparison of simulation results using two different implementations of the Ramsey and Andersen (1984) PBPK model for styrene: (1) the original Ramsey and Andersen (1984) (or “Published Model”) implementation (dashed lines) and (2) the PBPK model template implementation (solid lines). Results are shown for arterial blood concentrations of styrene for rats exposed to a 9.4 mg/kg IV dose of styrene administered over a period of 1.8 min. Simulations from the original Ramsey and Andersen (1984) implementation and published data of Withey and Collins (1977) (points) were digitized from Figure 3 of Ramsey and Andersen (1984). Note that the respective predictions from each model implementation are nearly indistinguishable visually after 0.1 h.

Similar articles

Cited by

References

    1. Andersen ME, Clewell HJ III, Gargas ML, Macnaughton MG, Reitz RH, Nolan RJ, and Mckenna MJ (1991). Physiologically based pharmacokinetic modeling with dichloromethane, its metabolite, carbon monoxide, and blood carboxyhemoglobin in rats and humans. Toxicol. Appl. Pharmacol. 108, 14–27. - PubMed
    1. Bernstein AS, Kapraun DF, and Schlosser PM (2021). A model template approach for rapid evaluation and application of physiologically based pharmacokinetic models for use in human health risk assessments: A case study on per- and polyfluoroalkyl substances. Toxicol. Sci. 182, 215–228. - PMC - PubMed
    1. Bois FY (2009). GNU MCSim: Bayesian statistical inference for SBML-coded systems biology models. Bioinformatics 25, 1453–1454. - PubMed
    1. Brightman FA, Leahy DE, Searle GE, and Thomas S. (2006). Application of a generic physiologically based pharmacokinetic model to the estimation of xenobiotic levels in rat plasma. Drug Metab. Dispos. 34, 84–93. - PubMed
    1. Campbell JL Jr, Clewell RA, Gentry PR, Andersen ME, and Clewell HJ III. (2012). Physiologically based pharmacokinetic/toxicokinetic modeling. Methods Mol. Biol. 929, 439–499. - PubMed

LinkOut - more resources