. 2023 Jun 5;212(3):262-275.
doi: 10.1093/cei/uxad034.

Downregulation of MALAT1 is a hallmark of tissue and peripheral proliferative T cells in COVID-19

Affiliations

Downregulation of MALAT1 is a hallmark of tissue and peripheral proliferative T cells in COVID-19

Shoumit Dey et al. Clin Exp Immunol. .

Abstract

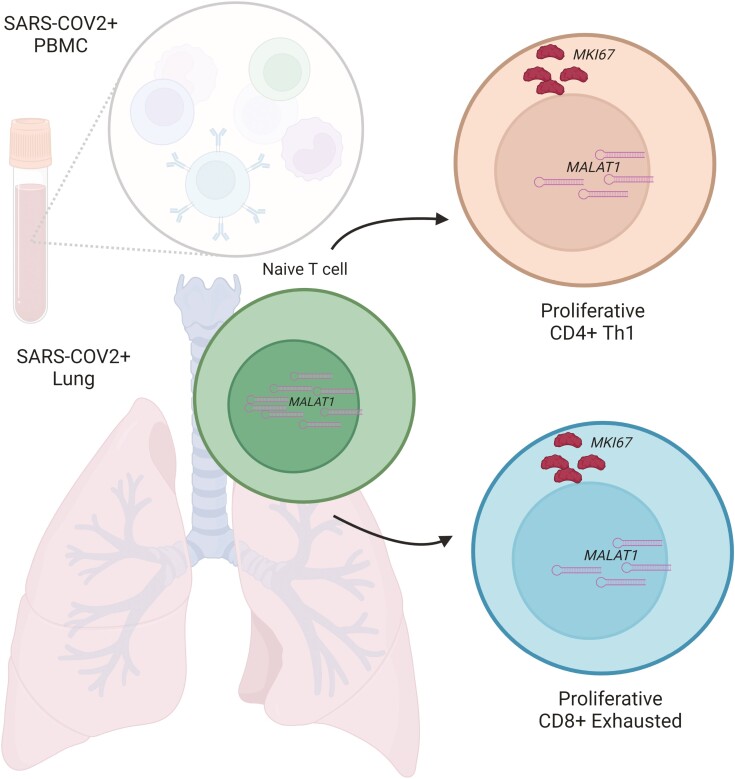
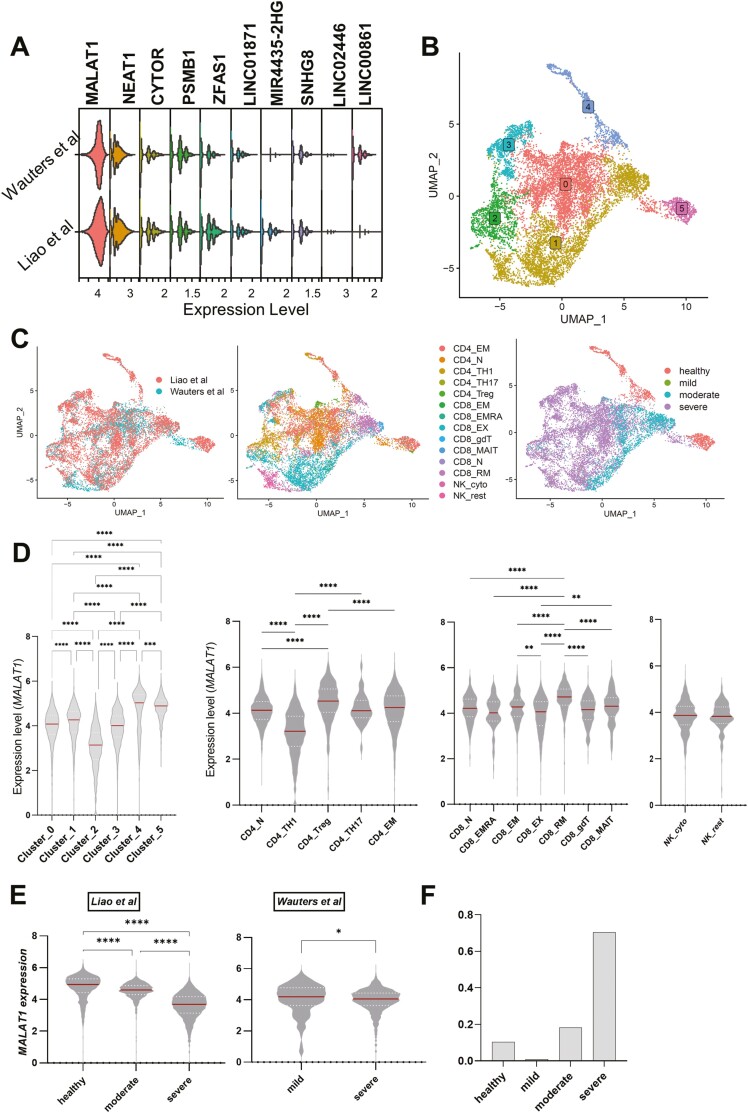
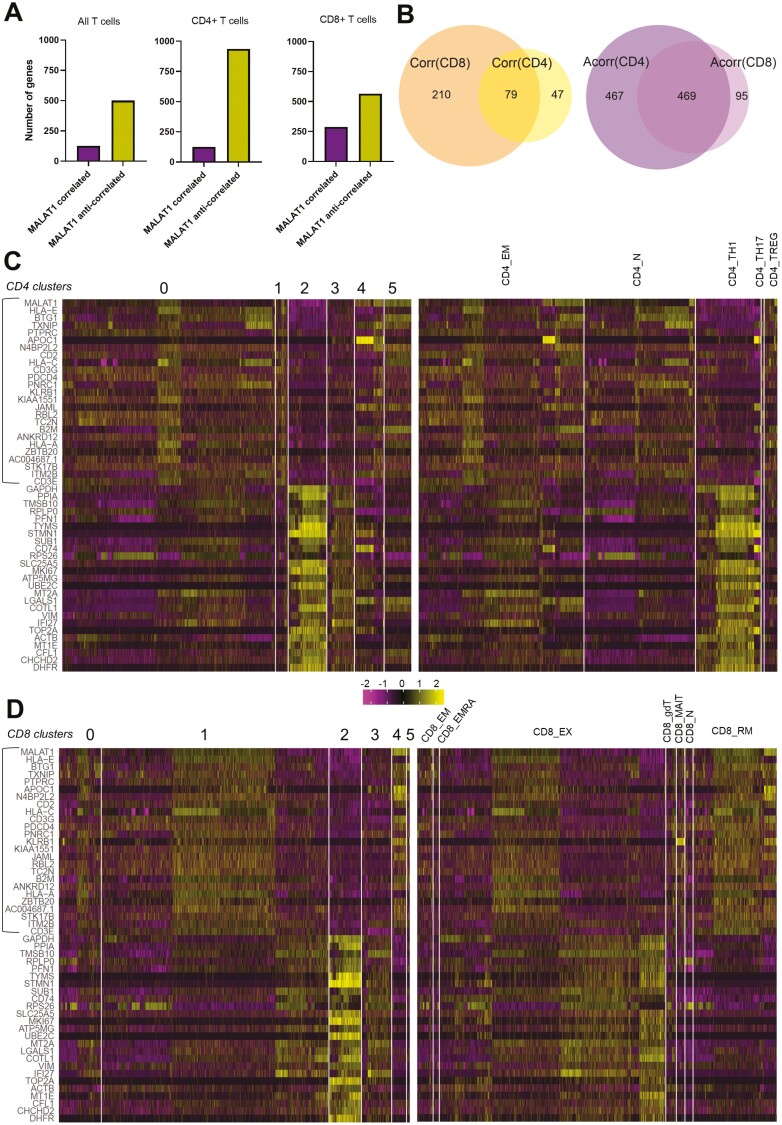
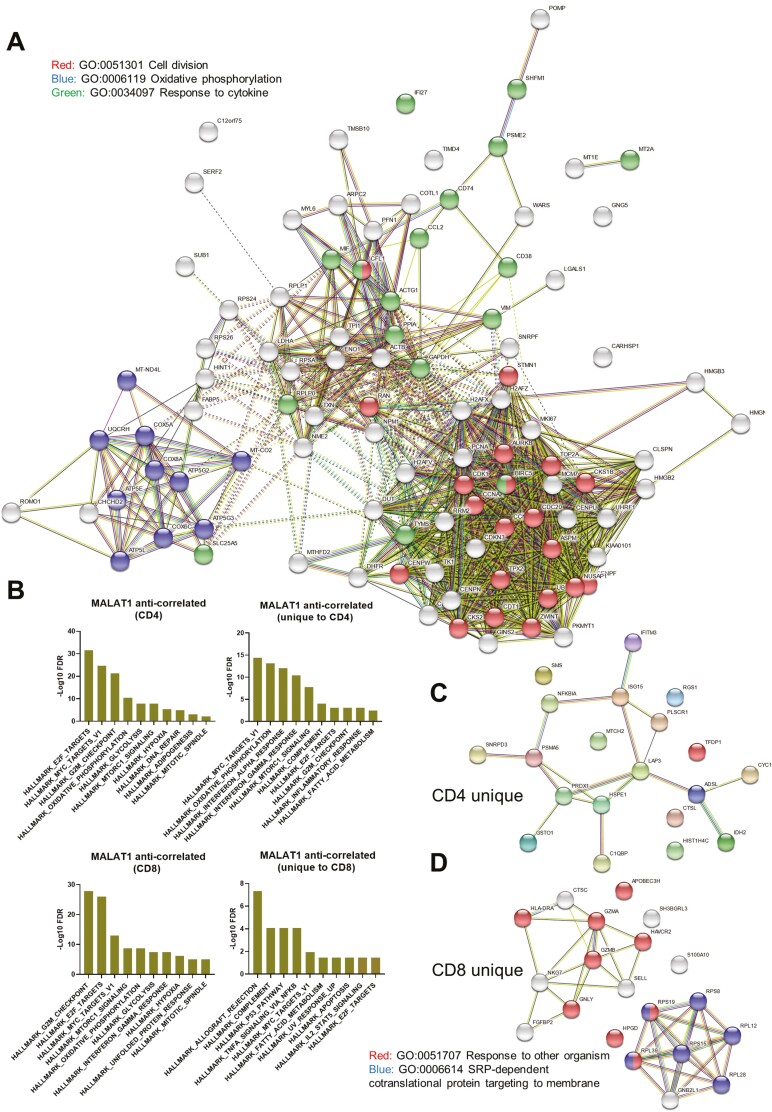
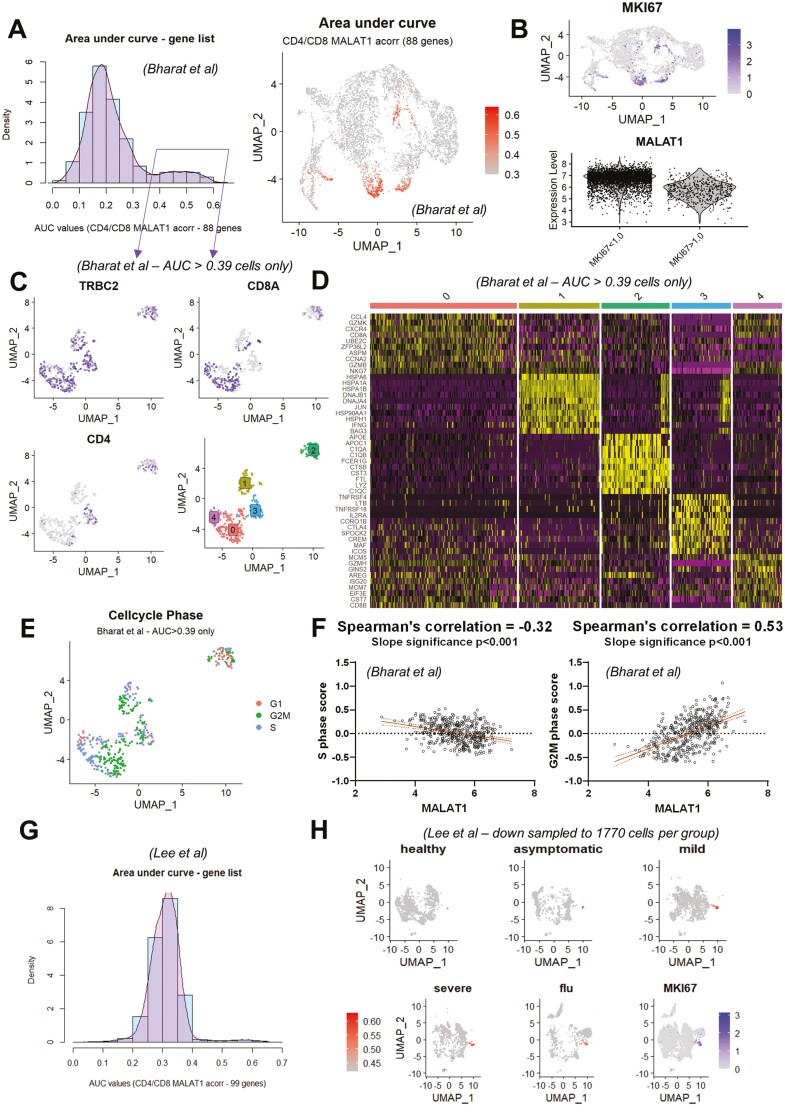
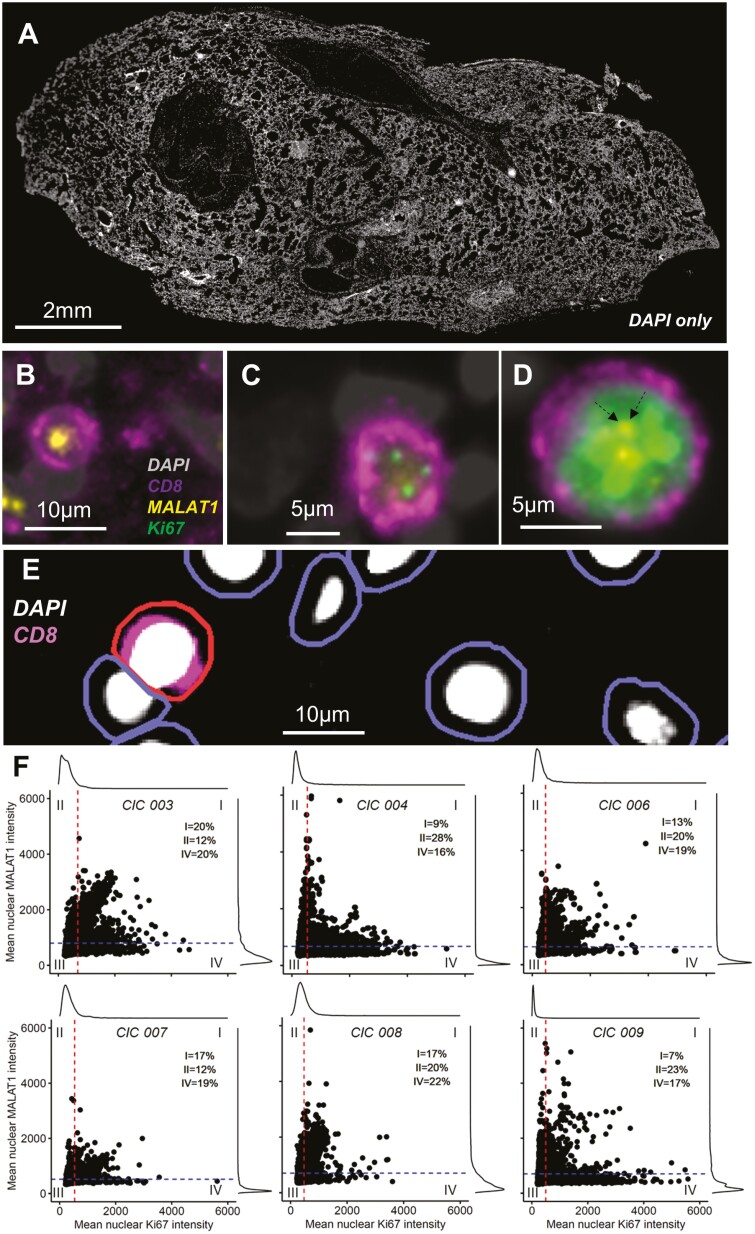
T cells play key protective but also pathogenic roles in COVID-19. We studied the expression of long non-coding RNAs (lncRNAs) in COVID-19 T-cell transcriptomes by integrating previously published single-cell RNA sequencing datasets. The long intergenic non-coding RNA MALAT1 was the most highly transcribed lncRNA in T cells, with Th1 cells demonstrating the lowest and CD8+ resident memory cells the highest MALAT1 expression, amongst CD4+ and CD8+ T-cells populations, respectively. We then identified gene signatures that covaried with MALAT1 in single T cells. A significantly higher number of transcripts correlated negatively with MALAT1 than those that correlated. Enriched functional annotations of the MALAT1- anti-correlating gene signature included processes associated with T-cell activation such as cell division, oxidative phosphorylation, and response to cytokine. The MALAT1 anti-correlating gene signature shared by both CD4+ and CD8+ T-cells marked dividing T cells in both the lung and blood of COVID-19 patients. Focussing on the tissue, we used an independent patient cohort of post-mortem COVID-19 lung samples and demonstrated that MALAT1 suppression was indeed a marker of MKI67+ proliferating CD8+ T cells. Our results reveal MALAT1 suppression and its associated gene signature are a hallmark of human proliferating T cells.

Keywords: COVID-19; MALAT1; T cell; lncRNA; proliferation.


Conflict of interest statement

The authors declare no conflicts of interest.

Figures

None
Graphical abstract
Figure 1.
Figure 1.
MALAT1 is differentially expressed in T cell subsets: (A) Stacked violin plots showing the top 10 highly expressed LncRNA in T cells in bronchoalveolar lavage fluid studies. (B) UMAP plots depicting single cells colored by their cluster identity as indicated by colored boxed labels. (C) UMAP plots depicting single cells colored and labeled by their respective study (Liao et al. (2020) and Wauters Mol et al. (2021)). Same as left but colored by imputed cell sub-population type and disease severity (healthy = 1225 (Liao et al. only), mild = 111, moderate = 2135, severe = 8275 T cells), respectively. (D) Violin plots showing normalized counts of MALAT1 expression across cluster identities of T cells and imputed cell sub-populations. Kruskal–Wallis multiple comparison P-values are indicated by asterisks (****P < 0.0001, ***P = 0.0001–0.005,**P = 0.005–0.001,*P = 0.01–0.05). For cell sub-populations, only a subset of comparisons is shown. (E) Violin plots showing normalized counts of MALAT1 expression across study and disease severity. Kruskal–Wallis multiple comparisons with p-value asterisks as defined in (D). (F) Barplot showing proportion of total CD4+/CD8 + T cells represented by each severity group pooled for both datasets.
Figure 2.
Figure 2.
BAL T-cell sub-populations differentially express MALAT1-correlated genes. (A) Bar plots showing the number of genes that correlate or anti-correlate with MALAT1 for all T cells, CD4+ and CD8+ T cells. (B) Venn diagrams depicting the intersection of gene lists that correlated [Corr(CD8), Corr(CD4)] and that for those that anti-correlated [Acorr(CD8), Acorr(CD4)] with MALAT1 expression in CD4+ cells and CD8+  cells. (C) Heatmap of top 25 MALAT1 correlating genes (highlighted in the rectangle) and top 25 anti-correlating genes in CD4 + T cells grouped by their cluster identities and by sub-population. Heatmap legend indicates expression values scaled to a mean of zero. (D) Same as C but for CD8+ T cells.
Figure 3.
Figure 3.
MALAT1 anti-correlates to genes that are related to cell cycle progression in T cells. (A) Network representation of STRING interactions plotted for top 100 MALAT1 anti-correlated genes and those that are common in CD4+ and CD8+ T cells with lines indicating interconnectedness in terms of co-expression or interaction. (B) Barplots showing negative log FDR values for HALLMARK GSEA enrichment for genes that anti-correlate with MALAT1 and those that are uniquely so in CD4+ and CD8+ T cells. The ‘x’ axis contains HALLMARK gene set names that were found to enriched. (C) Same as A but for top 20 unique genes for CD4+ T cells. (D) Network representation of STRING interactions for top 20 unique CD8+ T cells.
Figure 4.
Figure 4.
MALAT1 expression is reduced in proliferating T cells from lung digests. (A) Histogram showing ‘area under recovery curve’ score for MALAT1 anti-correlated gene list (number of genes = 88) for single cells. UMAP plot highlighting cells with AUC score from B that are greater than 0.39. (B) UMAP plot depicting MKI67 and a violin plot showing MALAT1 expression in groups created based on MKI67 levels of greater or less than 1.0. (C) UMAP plot depicting TRBC2, CD8A, and CD4 gene expression along with cluster identities of proliferative T cells (subset based on AUC score greater than 0.39 from A). (D)Heatmap showing top 10 genes expressed in each imputed cluster in (C). (E) UMAP plot depicting imputed cell cycle phase for each T cell. (F) Scatter plots and linear regression between imputed S-phase score (left) and G2/M score (right) per cell and MALAT1. P-values indicates the significance of the slope of the regression. (G) Histogram showing ‘area under recovery curve’ score for MALAT1 anti-correlated gene list (number of genes = 99) for PBMCs. (H) UMAP plot highlighting cells with AUC score in PBMCs from healthy volunteers and asymptomatic, mild, and severe COVID-19 patients and individuals with flu. The last UMAP shows MKI67 levels per cell.
Figure 5.
Figure 5.
MALAT1 expression is reduced in proliferating CD8+ T cells post-mortem tissue. (A) DAPI stained (grey) whole lung autopsy section. (B–D), Immunofluorescence and RNAScope images showing nucleus in grey (DAPI), MKI67 protein in green, CD8 surface protein in purple and MALAT1 RNA in yellow. Images show representative cells negative for MKI67 and positive for MALAT1 (B), weakly positive for MIK67 and with undetectable MALAT1 (C) and highly expressing MKI67 along with MALAT1 (D). Dotted arrows in (D) highlight MALAT1 positive signal for clarity. (E) Strategy employed to detect cells wherein first nucleus was identified and then cell boundaries using QuPath (see Methods) and a positive cell was detected (shown here in red) based on CD8 fluorescence intensity of the cell. (F) Scatter/histogram plots per autopsy along with horizontal and vertical lines drawn at the mean nuclear MALAT1 (793, 671, 629, 516, and 703) and MKI67 (685, 530, 457, 534, and 476) intensities, respectively. The two straight lines divide the plot into four quadrants, into regions that include cells that highly express MKI67 only (IV), MALAT1 only (II), both (I), or neither (III).

Similar articles

Cited by

References

    1. Noack M, Miossec P.. Th17 and regulatory T cell balance in autoimmune and inflammatory diseases. Autoimmun Rev 2014, 13, 668–77. - PubMed
    1. Pennock ND, White JT, Cross EW, Cheney EE, Tamburini BA, Kedl RM. T cell responses: naïve to memory and everything in between. Adv Physiol Educ 2013, 37, 273. - PMC - PubMed
    1. Chen Z, John Wherry E.. T cell responses in patients with COVID-19. Nat Rev Immunol 2020, 20, 529–36. - PMC - PubMed
    1. Moss P. The T cell immune response against SARS-CoV-2. Nat Immunol 2022, 23, 186–93. - PubMed
    1. Sekine T, Perez-Potti A, Rivera-Ballesteros O, Strålin K, Gorin JB, Olsson A, et al. . Robust T cell immunity in convalescent individuals with asymptomatic or mild COVID-19. Cell 2020, 183, 158–68. - PMC - PubMed

Publication types

Substances