

lncHUB2: aggregated and inferred knowledge about human and mouse lncRNAs
- PMID: 36869839
- PMCID: PMC9985331
- DOI: 10.1093/database/baad009
lncHUB2: aggregated and inferred knowledge about human and mouse lncRNAs
Abstract
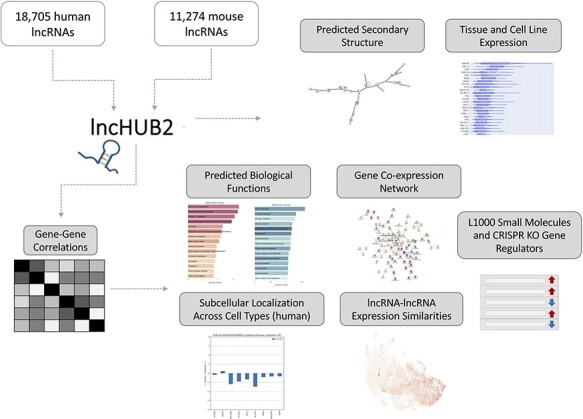
Long non-coding ribonucleic acids (lncRNAs) account for the largest group of non-coding RNAs. However, knowledge about their function and regulation is limited. lncHUB2 is a web server database that provides known and inferred knowledge about the function of 18 705 human and 11 274 mouse lncRNAs. lncHUB2 produces reports that contain the secondary structure fold of the lncRNA, related publications, the most correlated coding genes, the most correlated lncRNAs, a network that visualizes the most correlated genes, predicted mouse phenotypes, predicted membership in biological processes and pathways, predicted upstream transcription factor regulators, and predicted disease associations. In addition, the reports include subcellular localization information; expression across tissues, cell types, and cell lines, and predicted small molecules and CRISPR knockout (CRISPR-KO) genes prioritized based on their likelihood to up- or downregulate the expression of the lncRNA. Overall, lncHUB2 is a database with rich information about human and mouse lncRNAs and as such it can facilitate hypothesis generation for many future studies. The lncHUB2 database is available at https://maayanlab.cloud/lncHUB2. Database URL: https://maayanlab.cloud/lncHUB2.
© The Author(s) 2023. Published by Oxford University Press.
Figures


Similar articles
-
Long Noncoding RNA GMAN, Up-regulated in Gastric Cancer Tissues, Is Associated With Metastasis in Patients and Promotes Translation of Ephrin A1 by Competitively Binding GMAN-AS.Gastroenterology. 2019 Feb;156(3):676-691.e11. doi: 10.1053/j.gastro.2018.10.054. Epub 2018 Nov 13. Gastroenterology. 2019. PMID: 30445010
-
Long non-coding RNAs: From disease code to drug role.Acta Pharm Sin B. 2021 Feb;11(2):340-354. doi: 10.1016/j.apsb.2020.10.001. Epub 2020 Oct 10. Acta Pharm Sin B. 2021. PMID: 33643816 Free PMC article. Review.
-
In vivo CRISPR screening for novel noncoding RNA functional targets in glioblastoma models.J Neurosci Res. 2021 Sep;99(9):2029-2045. doi: 10.1002/jnr.24850. Epub 2021 May 10. J Neurosci Res. 2021. PMID: 33969526
-
Identification of a Xist silencing domain by Tiling CRISPR.Sci Rep. 2019 Feb 20;9(1):2408. doi: 10.1038/s41598-018-36750-0. Sci Rep. 2019. PMID: 30787302 Free PMC article.
-
Long non-coding RNAs in immune regulation and their potential as therapeutic targets.Int Immunopharmacol. 2020 Apr;81:106279. doi: 10.1016/j.intimp.2020.106279. Epub 2020 Feb 12. Int Immunopharmacol. 2020. PMID: 32058929 Free PMC article. Review.
Cited by
-
Brucella abortus triggers the differential expression of immunomodulatory lncRNAs in infected murine macrophages.Front Immunol. 2024 Feb 16;15:1352306. doi: 10.3389/fimmu.2024.1352306. eCollection 2024. Front Immunol. 2024. PMID: 38464511 Free PMC article.
-
Transcriptome wide changes in long noncoding RNAs in diabetic ischemic heart disease.Cardiovasc Diabetol. 2024 Oct 17;23(1):365. doi: 10.1186/s12933-024-02441-6. Cardiovasc Diabetol. 2024. PMID: 39420368 Free PMC article.
-
Macrophage polarization in hepatocellular carcinoma: a lncRNA-centric perspective on tumor progression and metastasis.Clin Exp Med. 2025 May 25;25(1):173. doi: 10.1007/s10238-025-01711-1. Clin Exp Med. 2025. PMID: 40413657 Free PMC article. Review.
-
lncRNAlyzr: Enrichment Analysis for lncRNA Sets.J Mol Biol. 2025 Aug 1;437(15):168938. doi: 10.1016/j.jmb.2025.168938. Epub 2025 Jan 11. J Mol Biol. 2025. PMID: 40133794
-
Sparassis latifolia and exercise training as complementary medicine mitigated the 5-fluorouracil potent side effects in mice with colorectal cancer: bioinformatics approaches, novel monitoring pathological metrics, screening signatures, and innovative management tactic.Cancer Cell Int. 2024 Apr 18;24(1):141. doi: 10.1186/s12935-024-03328-y. Cancer Cell Int. 2024. PMID: 38637796 Free PMC article.
References
Publication types
MeSH terms
Substances
Grants and funding
LinkOut - more resources
Full Text Sources
Research Materials
