. 2023 Apr:90:104504.
doi: 10.1016/j.ebiom.2023.104504. Epub 2023 Mar 2.

Discrepancy between Mtb-specific IFN-γ and IgG responses in HIV-positive people with low CD4 counts

Affiliations

Discrepancy between Mtb-specific IFN-γ and IgG responses in HIV-positive people with low CD4 counts

Maphe Mthembu et al. EBioMedicine. 2023 Apr.

Abstract

Background: Tuberculosis (TB) is a leading infectious cause of death worldwide and treating latent TB infection (LTBI) with TB preventative therapy is a global priority. This study aimed to measure interferon gamma (IFN-γ) release assay (IGRA) positivity (the current reference standard for LTBI diagnosis) and Mtb-specific IgG antibodies in otherwise healthy adults without HIV and those living with HIV (PLWH).

Methods: One-hundred and eighteen adults (65 without HIV and 53 antiretroviral-naïve PLWH), from a peri-urban setting in KwaZulu-Natal, South Africa were enrolled. IFN-γ released following stimulation with ESAT-6/CFP-10 peptides and plasma IgG antibodies specific for multiple Mtb antigens were measured using the QuantiFERON-TB Gold Plus (QFT) and customized Luminex assays, respectively. The relationships between QFT status, relative concentrations of anti-Mtb IgG, HIV-status, sex, age and CD4 count were analysed.

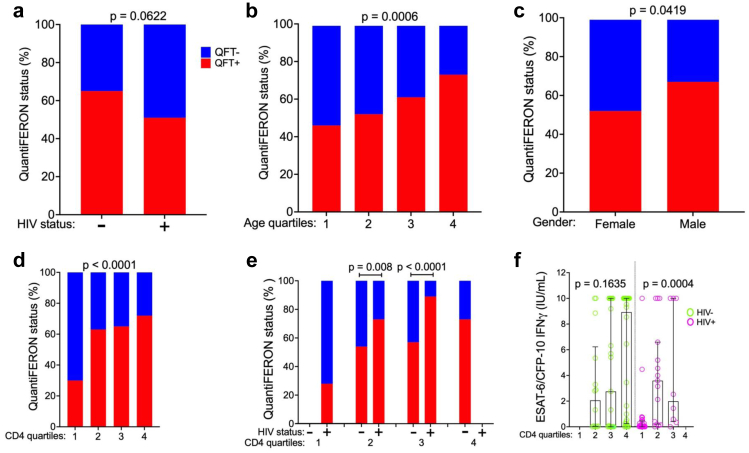
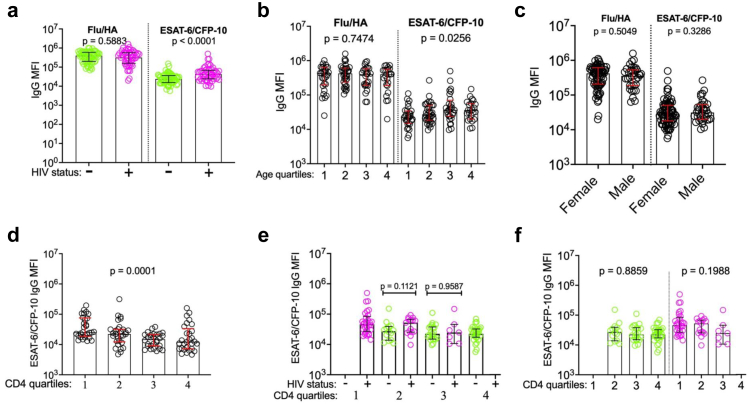
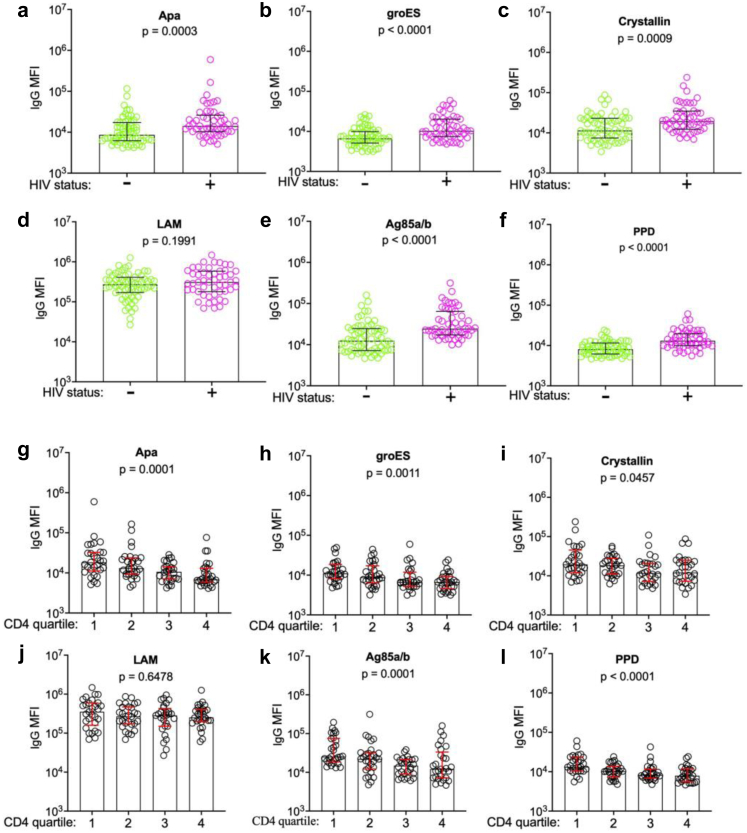
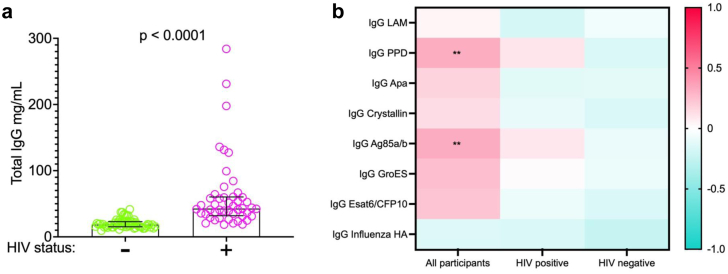
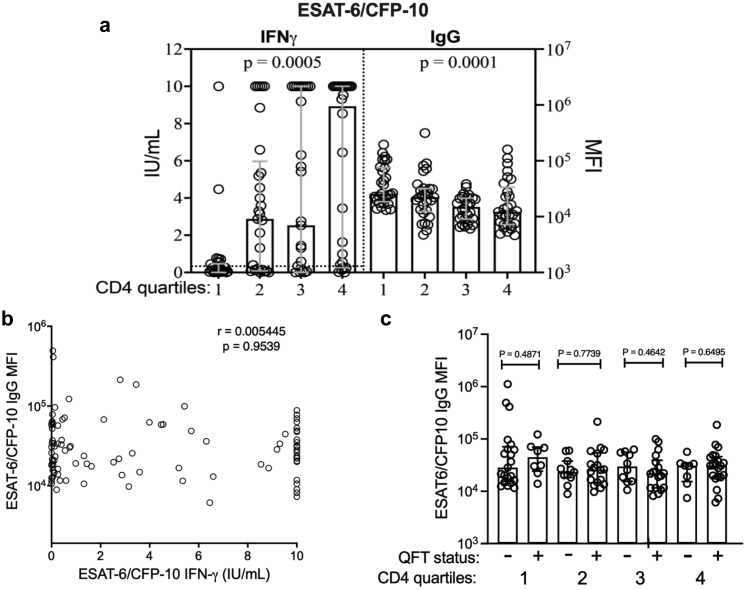
Findings: Older age, male sex and higher CD4 count were independently associated with QFT positivity (p = 0.045, 0.05 and 0.002 respectively). There was no difference in QFT status between people with and without HIV infection (58% and 65% respectively, p = 0.06), but within CD4 count quartiles, people with HIV had higher QFT positivity than people without HIV (p = 0.008 (2nd quartile), <0.0001 (3rd quartile)). Concentrations of Mtb-specific IFN-γ were lowest, and relative concentrations of Mtb-specific IgGs were highest in PLWH in the lowest CD4 quartile.

Interpretation: These results suggest that the QFT assay underestimates LTBI among immunosuppressed people with HIV and Mtb-specific IgG may be a useful alternative biomarker for Mtb infection. Further evaluation of how Mtb-specific antibodies can be leveraged to improve LTBI diagnosis is warranted, particularly in HIV-endemic areas.

Fundings: NIH, AHRI, SHIP: SA-MRC and SANTHE.

Keywords: CD4 count quartiles; HIV; Latent TB infection; QuantiFERON assay.


Conflict of interest statement

Declaration of interests All authors declare that they have no conflict of interest.

Figures

Fig. 1
Fig. 1
Factors associated with QuantiFERON positivity. QuantiFERON test results expressed as percentage (%) positive (red bars) or negative (blue bars) in 118 participants, stratified according to a. HIV status (people without HIV (n = 65), people with HIV (n = 53), Fischer's exact test of difference between groups), b. age quartiles (Chi squared test of difference across quartiles), c. sex (Fisher's exact test), d. CD4 count quartiles (Chi-squared test) and e. by HIV status within CD4 quartiles (Fishers Exact test was used to test for difference between HIV groups within comparable CD4 count quartiles). f. ESAT-6/CFP-10 specific IFN-γ concentration (IU/mL) among people without HIV (green) and people with HIV (pink) by CD4 counts quartile (Fischer's exact test).
Fig. 2
Fig. 2
Factors associated with ESAT-6/CFP-10-specific total IgG relative concentration. a. Relative concentrations (MFI) of influenza hemagglutinin (HA)- and ESAT-6/CFP-10-specific IgG in 115 participants, stratified according to a. HIV status (people without HIV (n = 64, green), people with HIV (n = 51, pink), Mann–Whitney U test of difference between groups), b. age quartiles (Kruskal–Wallis test for difference across quartiles), c. sex (Mann–Whitney U test). d. Relative concentration of ESAT-6/CFP-10 total IgG (MFI) stratified by CD4 count quartiles (Kruskal–Wallis test), e. HIV status within CD4 quartiles (Mann–Whitney U test), f. among people without and with HIV, by CD4 quartile (Fischer's exact test).
Fig. 3
Fig. 3
Higher Mtb-specific total IgG in people with HIV and low CD4 T cell counts. Relative concentrations (MFI) of total IgG specific to a. alanine- and proline-rich secreted protein (Apa), b. groES, c. alpha-crystallin, d. lipoarabinomannan (LAM), e. Antigen 85 complex (Ag85), f. Purified protein derivative (PPD) stratified by HIV status (people without HIV (n = 64, green), people with HIV (n = 51, pink), Mann–Whitney U test of difference between groups) and g–l. by CD4 count quartiles (Kruskal–Wallis test for difference across quartiles).
Fig. 4
Fig. 4
Relationship between total IgG and Mtb-specific IgG. a. Total IgG concentration (mg/mL), by HIV status (n = 115, people without HIV (n = 64, green), people with HIV (n = 51, pink), Mann–Whitney U test of difference between groups). b. Heatmap showing correlations between Mtb-specific IgG relative concentrations (MFI) and total IgG concentrations (mg/mL) (blue indicates negative correlation and pink indicates positive correlation) and level of significance (∗∗ for p < 0.001, Benjamini-Hochberg correction for multiple comparisons).
Fig. 5
Fig. 5
Discordant ESAT-6/CFP-10-specific IFN-γ and IgG. a. Left panel: ESAT-6/CFP-10 specific IFN-γ concentration (IU/mL) stratified by CD4 count quartiles (n = 118, Kruskal–Wallis test for difference between quartiles, dotted line represents the positive test cut off (≤0.35 IU/mL) for the QFT assay). Right panel: Relative concentration of ESAT-6/CFP-10-specific total IgG stratified by CD4 count quartiles (n = 115, Kruskal–Wallis test). b. ESAT-6/CFP-10 specific IFN-γ concentration (IU/uL) vs. ESAT-6/CFP-10-specific total IgG relative concentration (MFI, n = 115, Spearman's test of correlation) c. ESAT-6/CFP-10 IgG relative concentration (MFI) stratified by QFT status within CD4 count quartiles (n = 115, Mann–Whitney U test of difference between groups).

References

    1. World Health Organisation . 2020. Global tuberculosis report.
    1. Pai M., Behr M., Jr. Latent Mycobacterium tuberculosis infection and interferon-gamma release assays. Microbiol Spectr. 2016;4(5) doi: 10.1128/microbiolspec.TBTB2-0023-2016. - DOI - PubMed
    1. Pai M., Behr M.A., Dowdy D., et al. Tuberculosis. Nat Rev Dis Prim. 2016;2(1):16076. - PubMed
    1. Esmail H., Barry C.E., 3rd, Wilkinson R.J. Understanding latent tuberculosis: the key to improved diagnostic and novel treatment strategies. Drug Discov Today. 2012;17(9–10):514–521. - PMC - PubMed
    1. Pai M., Riley L.W., Colford J.M., Jr. Interferon-gamma assays in the immunodiagnosis of tuberculosis: a systematic review. Lancet Infect Dis. 2004;4(12):761–776. - PubMed