. 2023 Mar 30;186(7):1478-1492.e15.
doi: 10.1016/j.cell.2023.02.010. Epub 2023 Mar 3.

Biophysical forces mediated by respiration maintain lung alveolar epithelial cell fate

Affiliations

Biophysical forces mediated by respiration maintain lung alveolar epithelial cell fate

Kazushige Shiraishi et al. Cell. .

Abstract

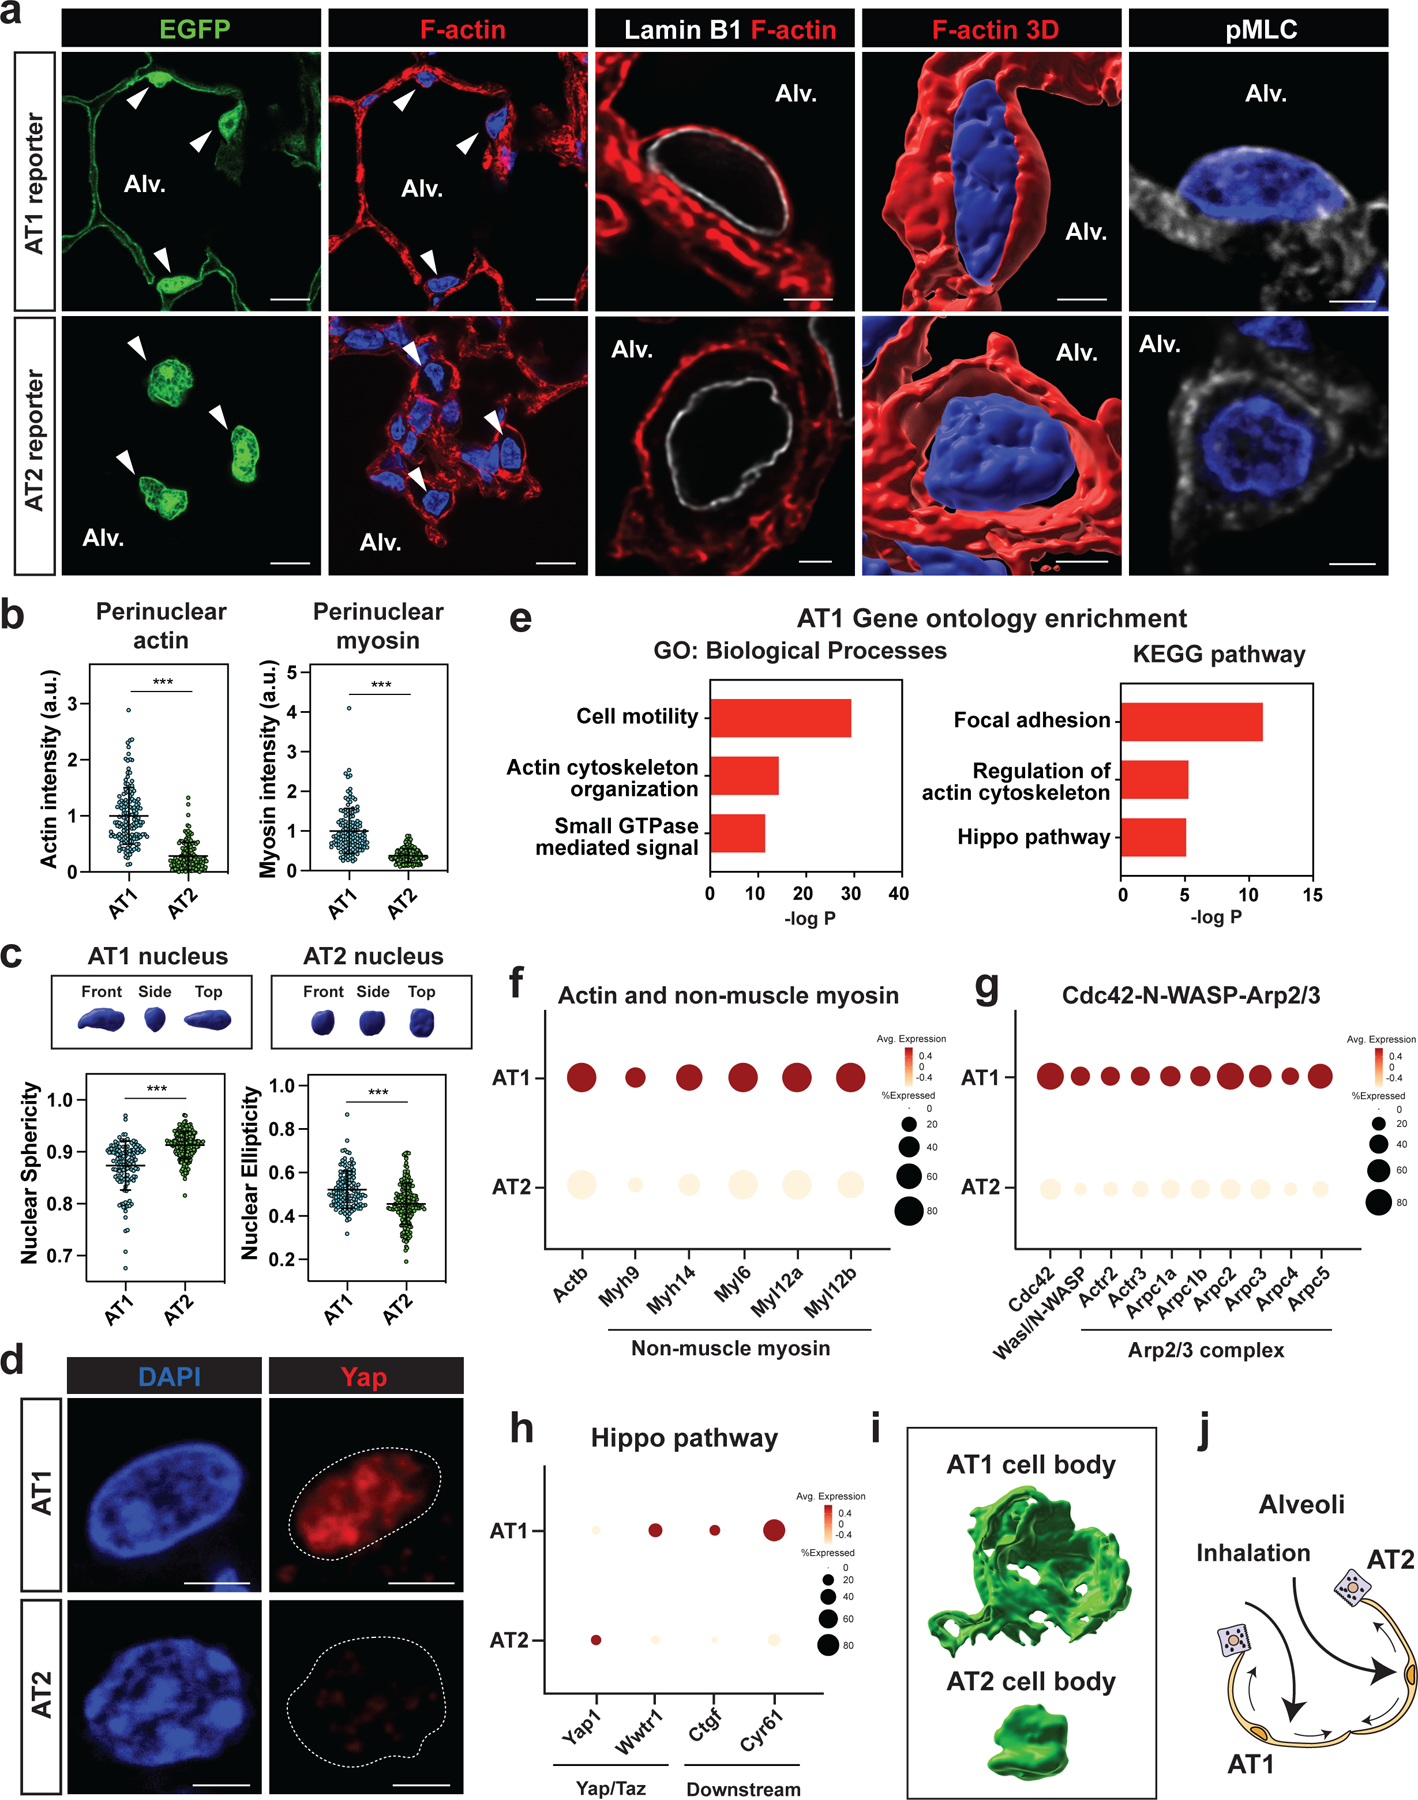
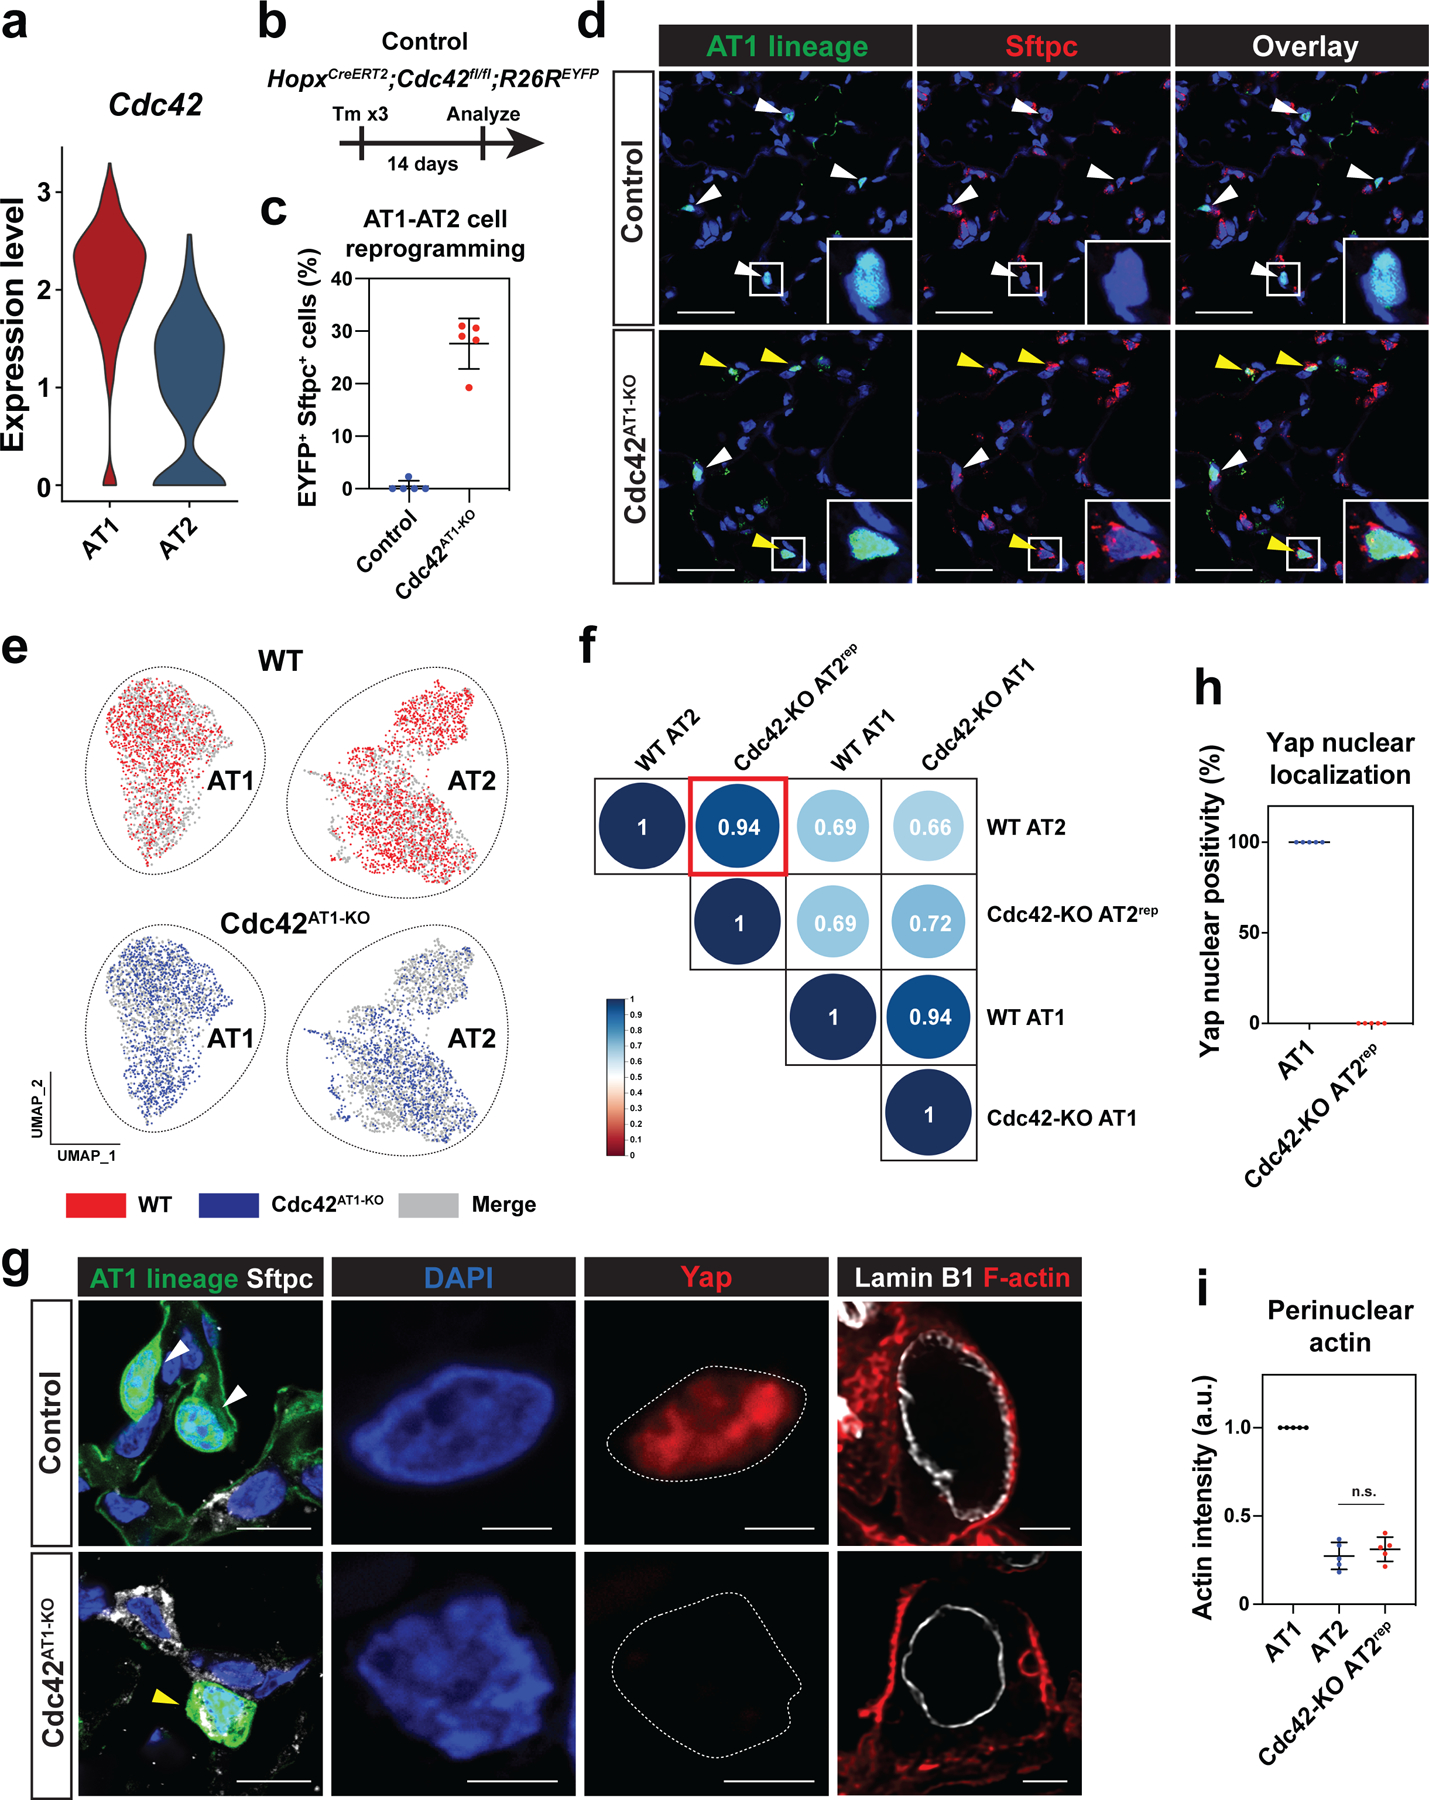
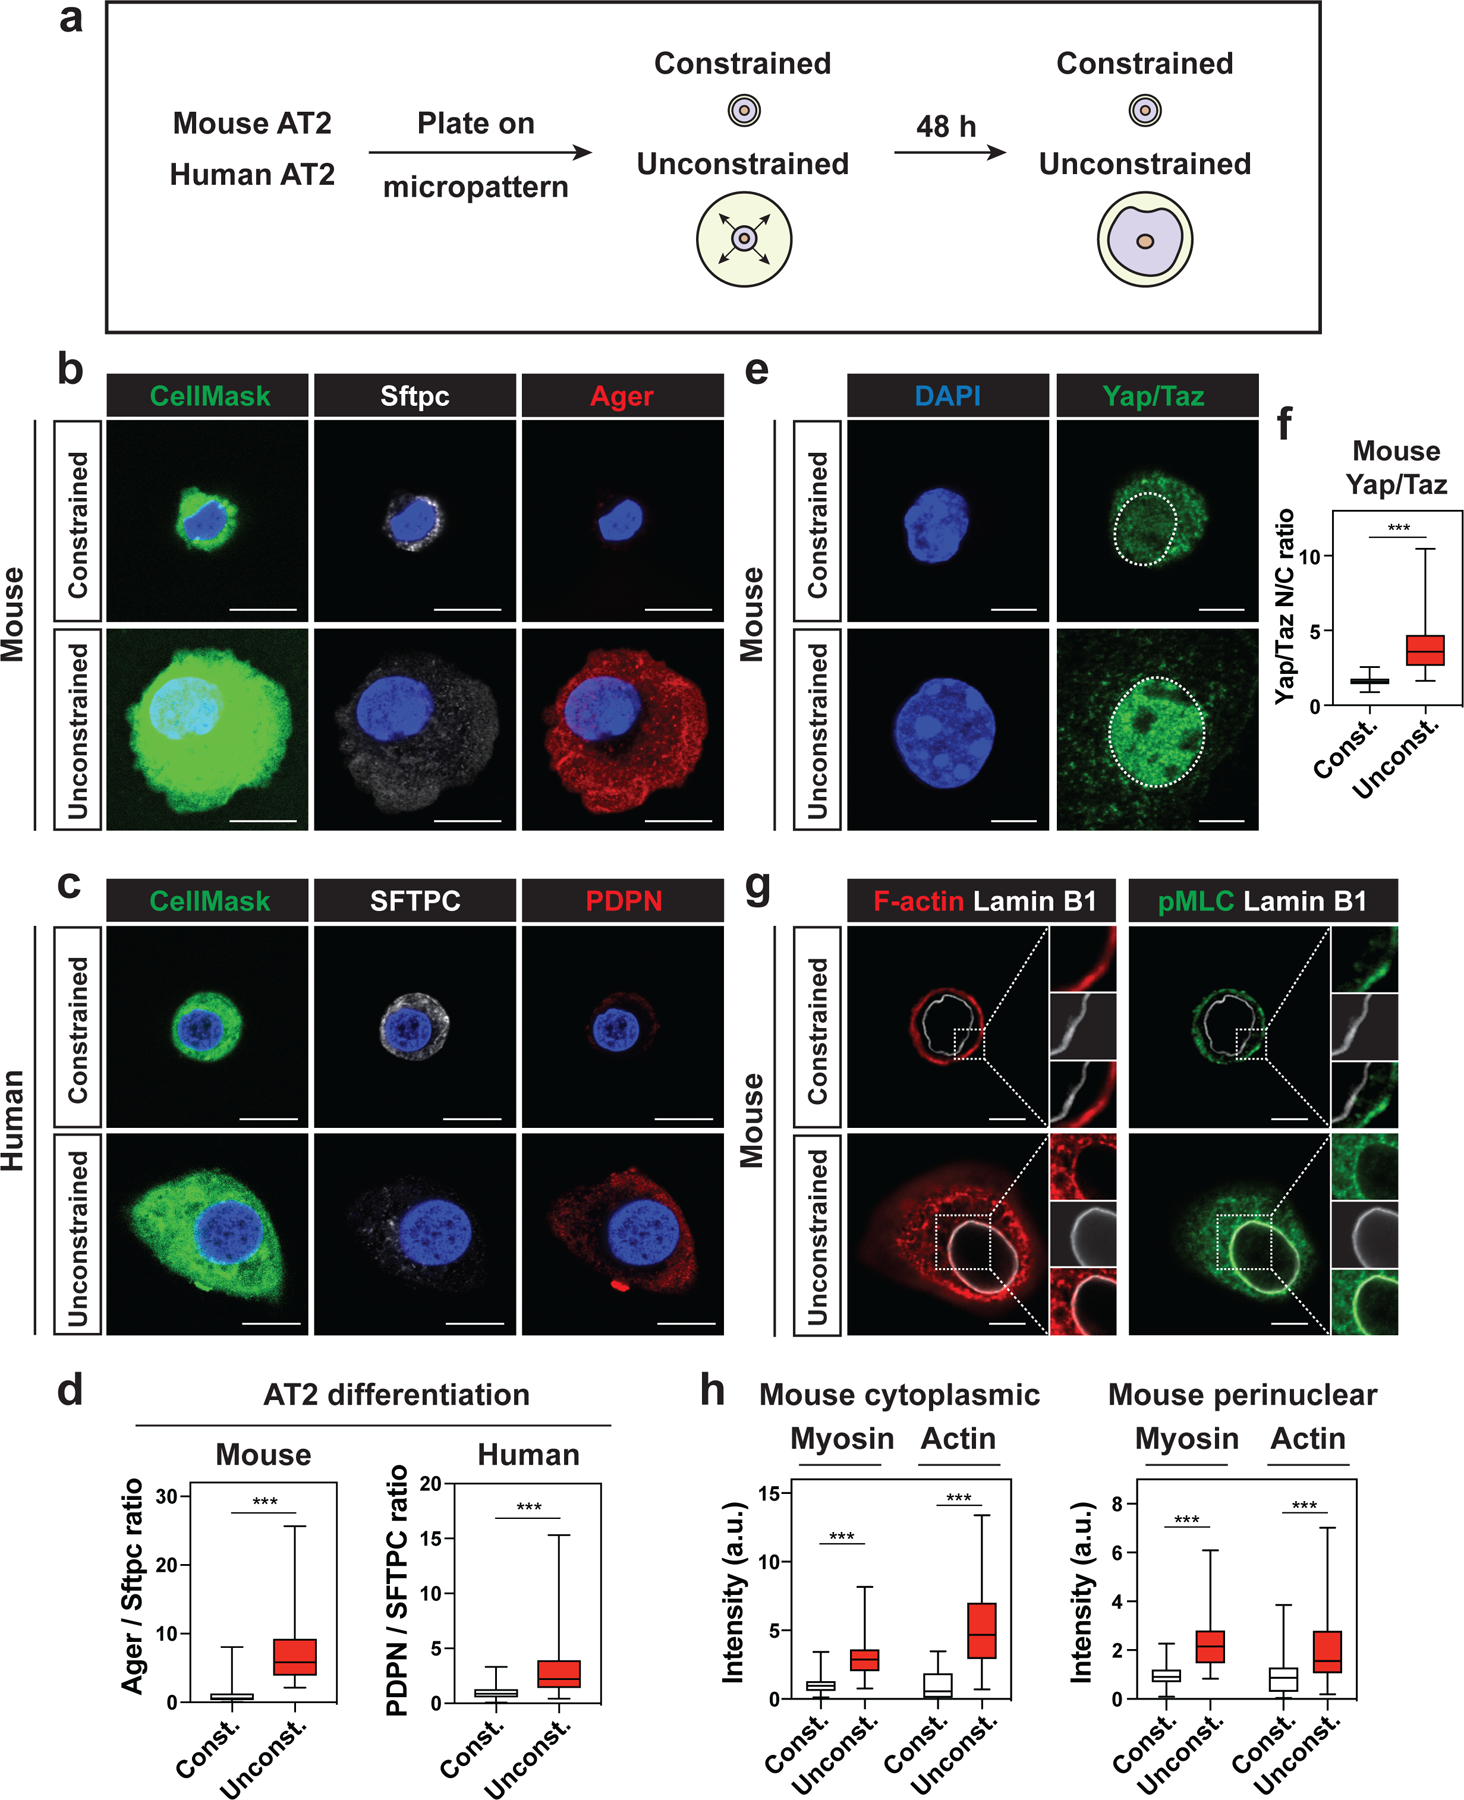
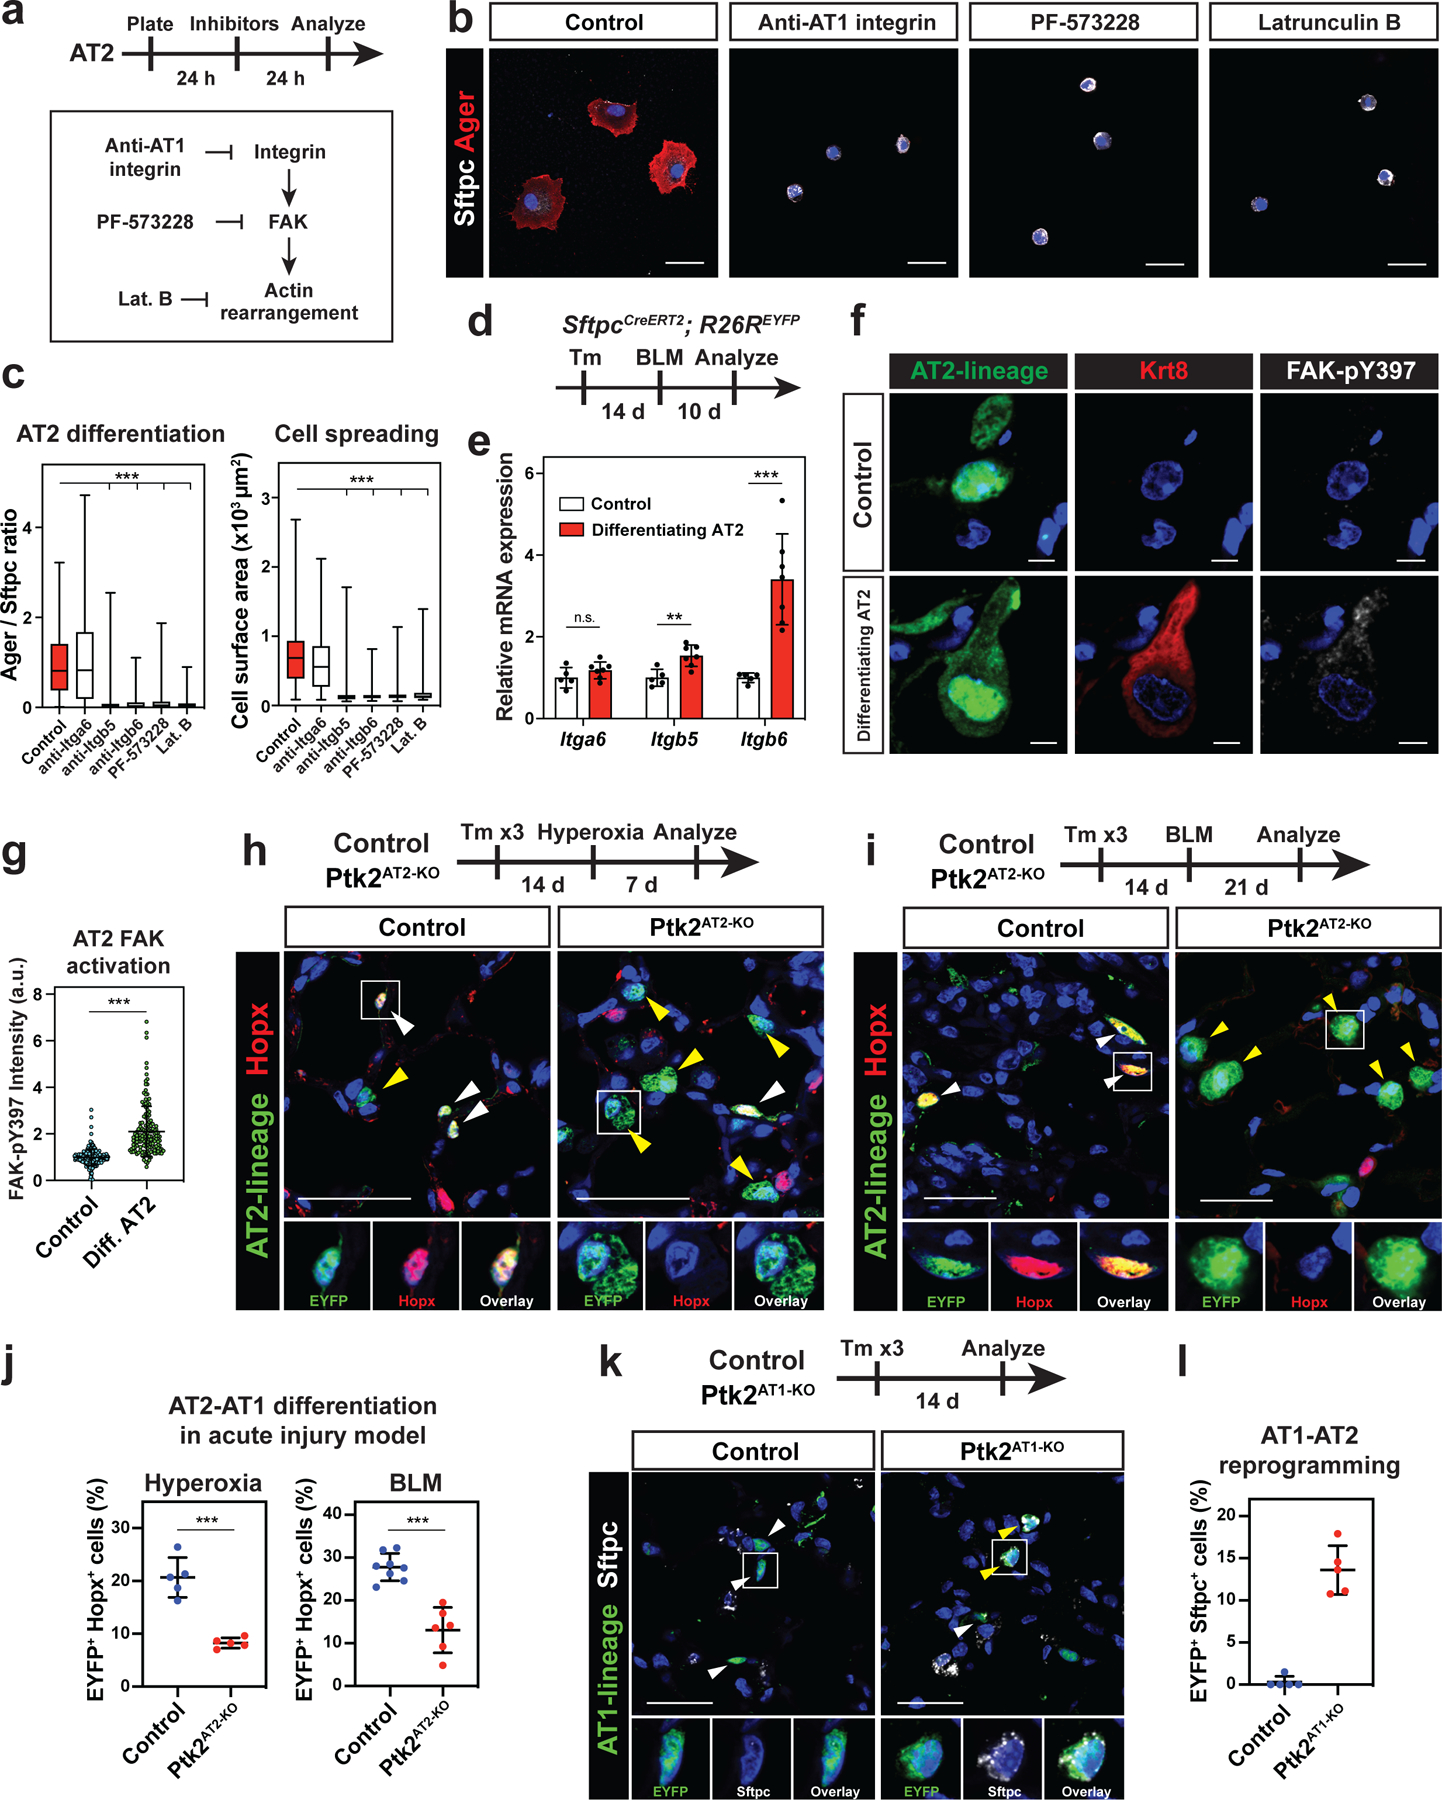
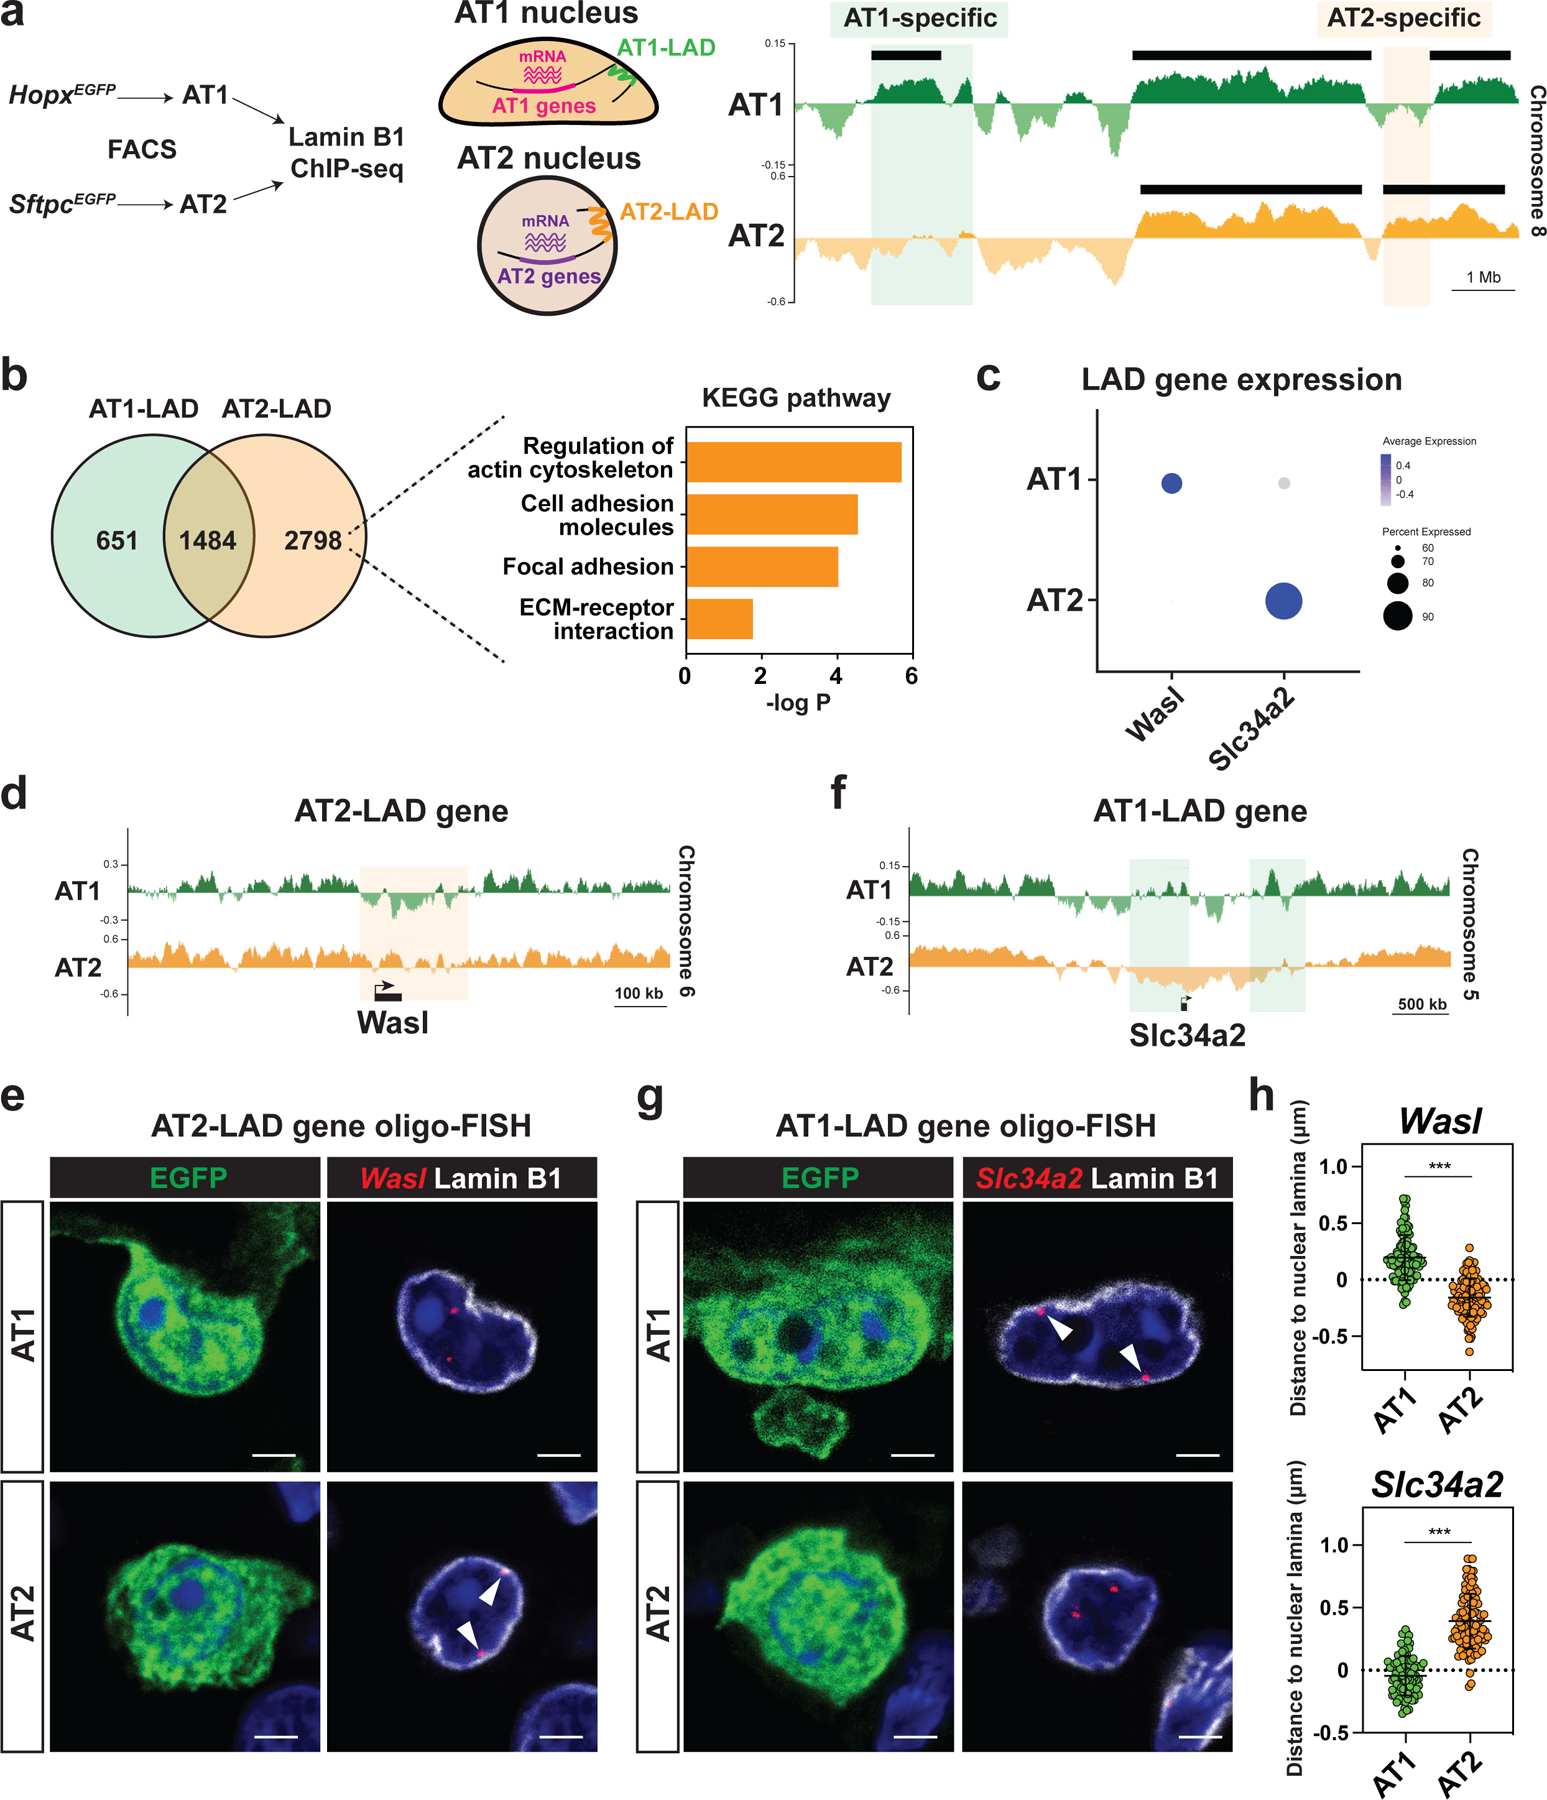
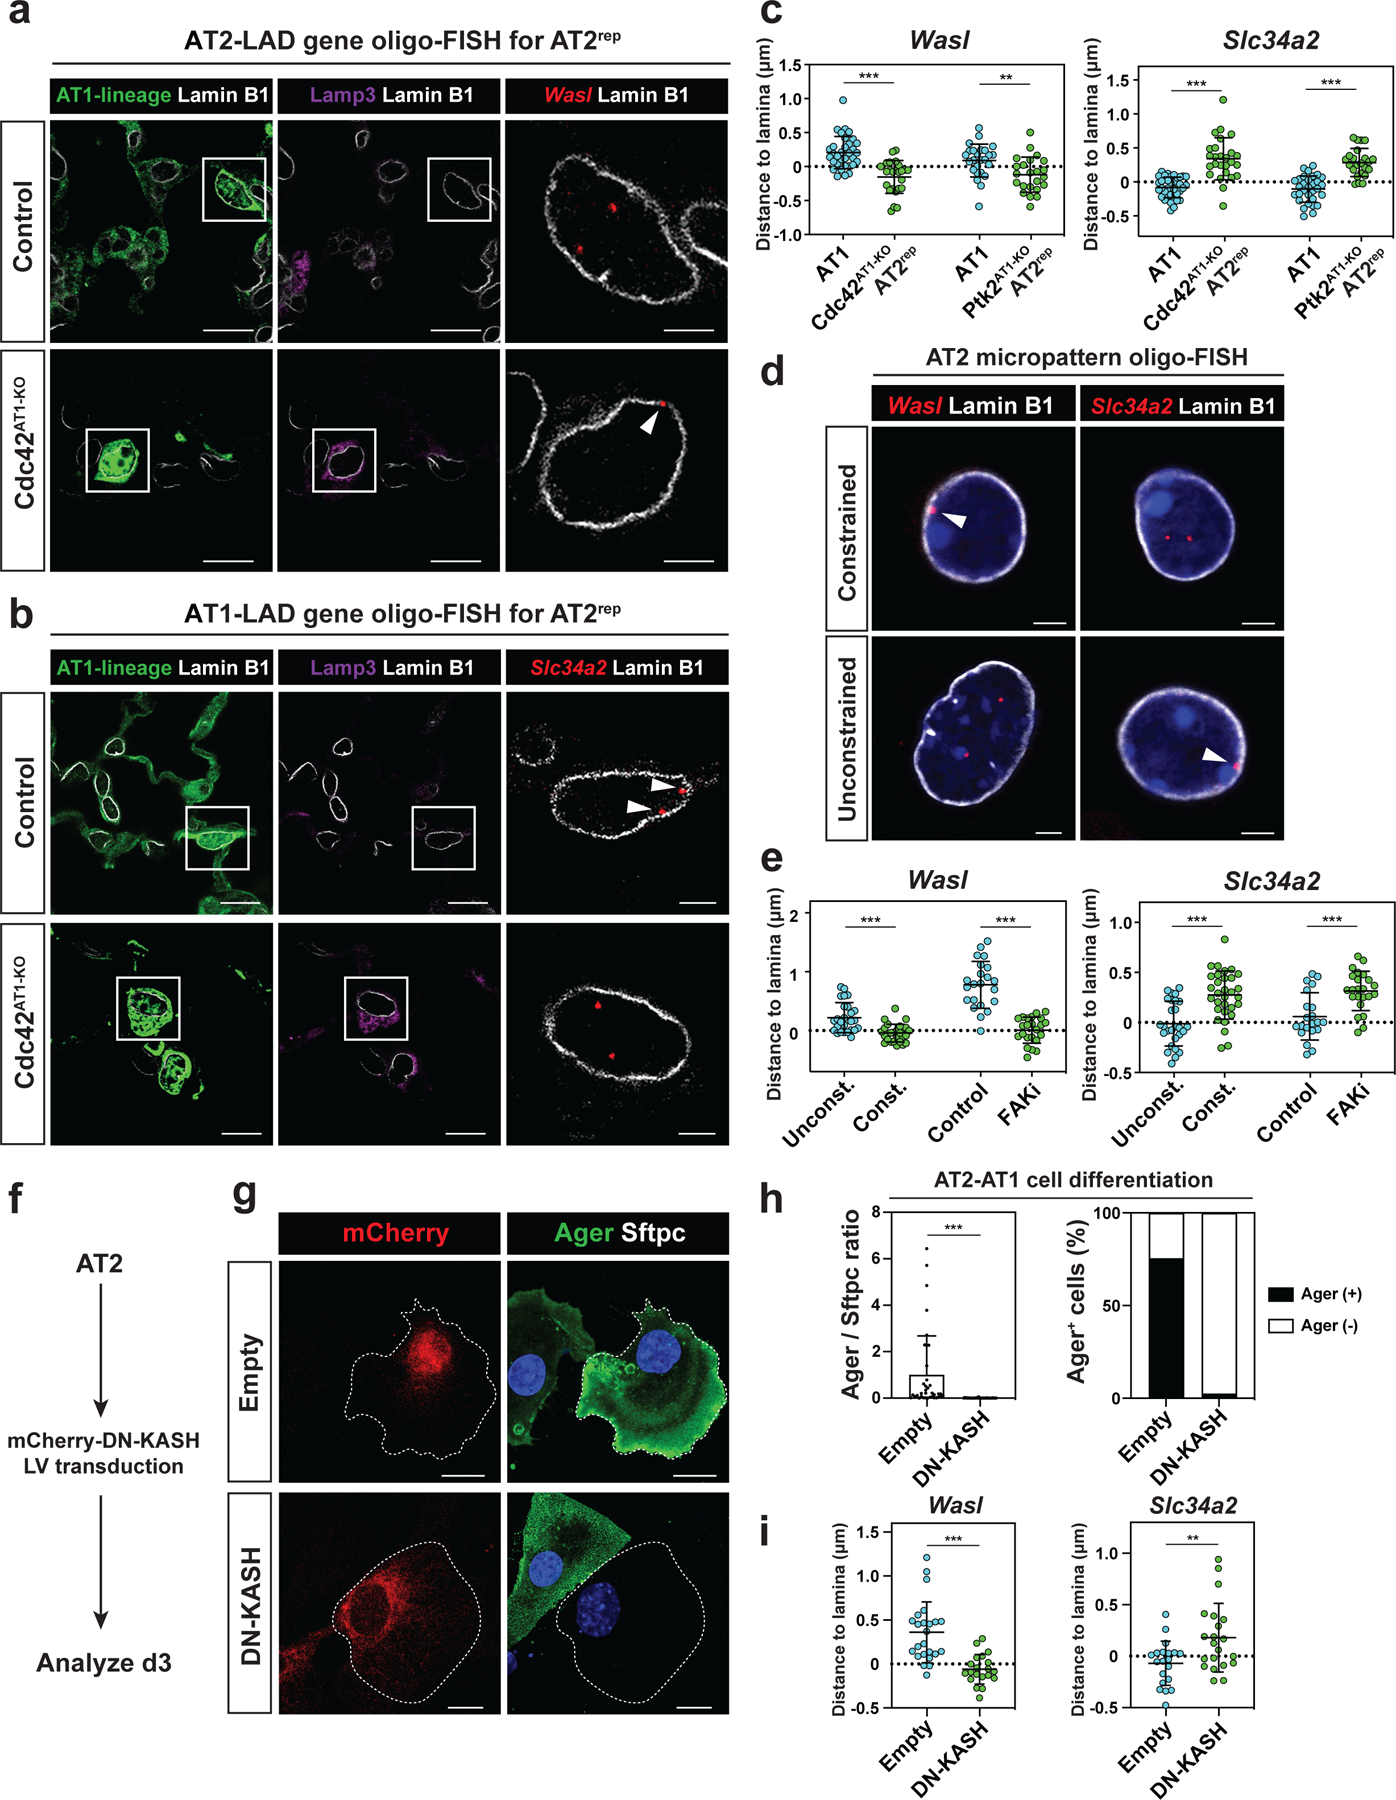
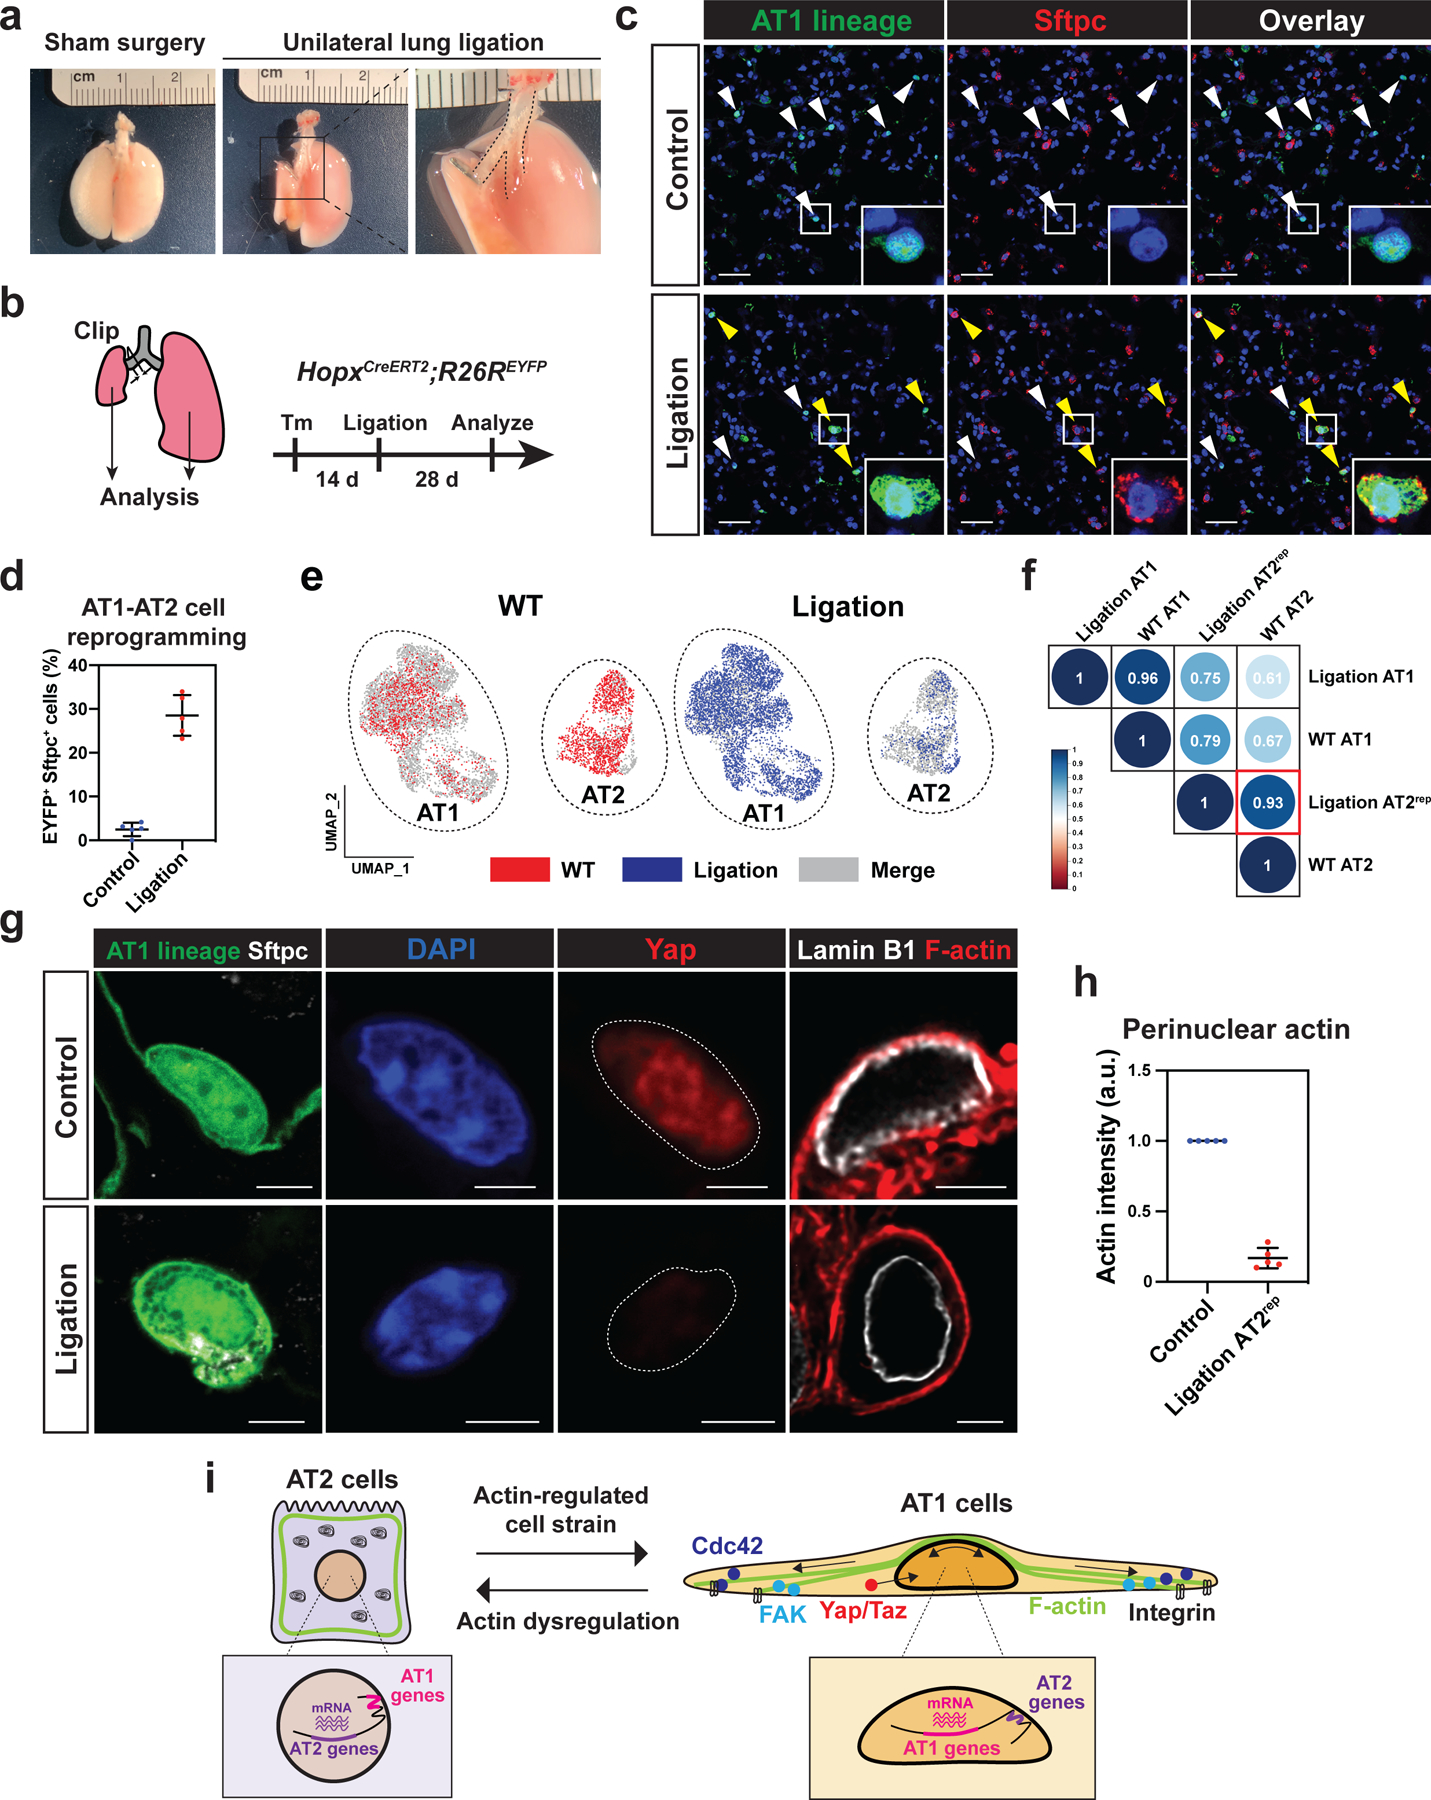
Lungs undergo mechanical strain during breathing, but how these biophysical forces affect cell fate and tissue homeostasis are unclear. We show that biophysical forces through normal respiratory motion actively maintain alveolar type 1 (AT1) cell identity and restrict these cells from reprogramming into AT2 cells in the adult lung. AT1 cell fate is maintained at homeostasis by Cdc42- and Ptk2-mediated actin remodeling and cytoskeletal strain, and inactivation of these pathways causes a rapid reprogramming into the AT2 cell fate. This plasticity induces chromatin reorganization and changes in nuclear lamina-chromatin interactions, which can discriminate AT1 and AT2 cell identity. Unloading the biophysical forces of breathing movements leads to AT1-AT2 cell reprogramming, revealing that normal respiration is essential to maintain alveolar epithelial cell fate. These data demonstrate the integral function of mechanotransduction in maintaining lung cell fate and identifies the AT1 cell as an important mechanosensor in the alveolar niche.

Keywords: alveolar epithelial cell; biophysical forces; lamina-associated domain; lung; mechanotransduction.


Conflict of interest statement

Declaration of interests The authors declare no competing interests.

Figures

Figure 1.
Figure 1.. Actin-regulated biophysical forces define AT1 cells in vivo
a. Phalloidin and activated myosin (phosphorylated myosin light chain; pMLC) staining of alveolar epithelial cells. F-actin and activated myosin contact luminal side of Hopx-EGFP+ AT1 nucleus, but not Sftpc-EGFP+ AT2 nucleus. Arrowheads indicate AT1 cells (top) and AT2 cells (bottom). b. Quantification of perinuclear actin (n = 144 AT1 and n = 138 AT2 cells pooled from n = 5 mice) and perinuclear myosin (n = 130 AT1 and n = 153 AT2 cells pooled from n = 6 mice). c. Representative 3D image of AT1 and AT2 nucleus (top). Quantification of nuclear sphericity and ellipticity for AT1 (n = 126) and AT2 (n = 185) cells pooled from n = 6 mice (bottom). d. Yap localizes to AT1 nucleus, but not to AT2 cells. e. Mechanotransduction-related GO terms and pathways are enriched in AT1 cells. RNA-seq data were obtained from Penkala et al. f-h. Actin, non-muscle myosin (f), Cdc42-N-WASP-Arp2/3 complex genes (g), and Hippo pathway downstream genes (h) are upregulated in AT1 cells. scRNA-seq data were obtained from Zepp et al. i. 3D images of AT1 and AT2 cell body. Imaged with lung strips from HopxCreERT2; R26RmTmG and SftpcCreERT2; R26RmTmG mice. j. AT1 cells are subject to biophysical forces derived from tissue strain. *** P < 0.001 by two-tailed t-test. Each dot represents an individual cell, and error bars indicate mean with s.d. Scale bars: a (left two panels), 10 μm; a (right three panels), d, 2.5 μm. See also Figure S1.
Figure 2.
Figure 2.. Cdc42 deletion reprograms AT1 cells into AT2 cells
a. AT1 cells express a higher level of Cdc42 than AT2 cells. b-d. AT1 cell-specific Cdc42 deletion reprograms AT1 cells into AT2 cells. Cdc42 deletion and lineage-tracing were performed on HopxCreERT2; Cdc42flox/+; R26REYFP (control) and HopxCreERT2; Cdc42flox/flox; R26REYFP (Cdc42AT1-KO) mice and analyzed 14 days later (b). AT1 lineage cells express AT2 cell marker Sftpc in Cdc42AT1-KO mice (d). White arrowheads indicate AT1 cells and yellow arrowheads indicate AT2rep cells. Quantification of EYFP+ Sftpc+ AT2rep cells from n = 5 mice, 3 independent experiments (c). e-f. scRNA-seq analysis of wildtype alveolar epithelial cells and lineage-traced cells from Cdc42AT1-KO mice. AT2rep cells co-cluster with wildtype AT2 cells (e). Correlation analysis shows high similarity between AT2rep and wildtype AT2 cells (f). g. YAP does not localize to the EYFP+ Lamp3+ AT2rep nucleus in Cdc42AT1-KO mice, and F-actin does not contact AT2rep nucleus. h. Quantification of Yap positivity for control AT1 cells and AT2rep cells (n = 5 mice). i. Quantification of perinuclear actin for control AT1 cells, AT2 cells, and AT2rep cells (n = 5 mice). Control lung and Cdc42AT1-KO mouse lung were adhered to the same glass slide. Actin intensity for AT2 and AT2rep cells was standardized to that of control AT1 cells on the same glass slide. N.S., not significant by two-tailed t-test. Each dot represents an individual mouse, and error bars indicate mean with s.d. Scale bars: d, g (left), 25 μm; g (right 3 panels), 2.5 μm. See also Figures S2 and S3.
Figure 3.
Figure 3.. Cell spreading determines AT2-AT1 cell differentiation
a. Mouse and human AT2 cells were cultured 48 h on micropatterned dishes with printed circles of different sizes. b-c. Constrained AT2 cells do not differentiate into AT1 cells. Constrained mouse AT2 cells (10 μm circle) maintain Sftpc expression, while unconstrained mouse AT2 cells (> 20 μm circle) downregulate Sftpc and express AT1 cell marker Ager (b). CellMask is used to visualize the cell body. Constrained human AT2 cells maintain SFTPC expression, while unconstrained human AT2 cells downregulate SFTPC and express AT1 cell marker PDPN (c). d. Ager/Sftpc ratio representing mouse AT2-AT1 cell differentiation was quantified with n = 145 constrained and n = 164 unconstrained AT2 cells pooled from 4 independent experiments (left). PDPN/SFTPC ratio representing human AT2-AT1 cell differentiation was quantified with n = 122 constrained, n = 106 unconstrained AT2 cells pooled from 3 independent experiments (right). e-f. Yap/Taz localize to unconstrained mouse AT2 nucleus, but not to constrained AT2 nucleus (e). Yap/Taz nuclear to cytoplasm ratio was quantified with n = 131 constrained and n = 166 unconstrained mouse AT2 cells pooled from 4 independent experiments (f). g-h. Actin fibers and activated myosin are abundant in cytoplasm and perinuclear regions of unconstrained AT2 cells (g). Actin and myosin intensity in cytoplasmic and perinuclear regions were quantified with n = 33 constrained and n = 36 unconstrained mouse AT2 cells (h). *** P < 0.001 by two-tailed t-test. For Box and whisker plots, bars represent min and max values. Scale bars: b, c, 10 μm; e, g, 2.5 μm. See also Figures S4 and S5.
Figure 4.
Figure 4.. AT2-AT1 cell differentiation and AT1 cell fate maintenance require integrin signaling
a-c. Integrin-FAK signaling is required for AT2 cell spreading and differentiation in vitro. Inhibitors were added 24 h after AT2 cell plating, and the cells were analyzed 24 h after the treatment (a). Anti-AT1 Integrin (Itgb6) antibody, FAK inhibitor PF 573228, or actin polymerization inhibitor Latrunculin B attenuated AT2 cell spreading and differentiation (b). The inhibitor-treated AT2 cells retained Sftpc+ Ager AT2 cell state. Ager/Sftpc ratio and cell surface area were quantified for control (n = 135), anti-Itga6-treated (n = 69), anti-Itgb5-treated (n = 100), anti-Itgb6-treated (n = 126), PF 573228-treated (n = 123), or Latrunculin B-treated (n = 117) AT2 cells pooled from 3–6 independent experiments (c). d-g. Integrin-FAK signaling is activated during AT2-AT1 cell differentiation in vivo. Bleomycin (BLM) was intratracheally given to SftpcCreERT2; R26REYFP mice, and the mice were analyzed 10 days later (d). qPCR shows Itgb5, and Itgb6 are upregulated after acute lung injury, using sorted AT2 cells from PBS-treated control (n = 5 mice) and BLM-treated SftpcCreERT2; R26REYFP mice (n = 7 mice) from 3 independent experiments (e). FAK is activated (FAK-pY397+) in EYFP+ Krt8+ differentiating AT2 cells (f). FAK-pY397 intensity was quantified for n = 236 AT2 and n = 147 Krt8+ AT2 cells from n = 6 mice (g). h-j. AT2-specific FAK knockout attenuates AT2-AT1 cell differentiation in vivo. FAK (Ptk2) deletion and lineage-tracing was performed on SftpcCreERT2; Ptk2flox/+; R26REYFP (control) and SftpcCreERT2; Ptk2flox/flox; R26REYFP (Ptk2AT2-KO) mice. The mice were analyzed 7 days after hyperoxia lung injury (h) or 21 days after BLM injury (i). AT2 cells differentiate into Hopx+ AT1 cells in control (h, i left), but less so in the Ptk2AT2-KO mice (h, i right) after injury. Quantification of AT2-AT1 cell differentiation for hyperoxia (n = 5 control and n = 5 Ptk2AT2-KO mice from 2 independent experiments) and BLM (n = 8 control and n = 6 Ptk2AT2-KO mice from 3 independent experiments) acute lung injury model (j). k-l. AT1 cell-specific FAK deletion reprograms AT1 cells into AT2 cells. FAK deletion and lineage-tracing were performed on HopxCreERT2; R26REYFP (control) and HopxCreERT2; Ptk2flox/flox; R26REYFP (AT1Ptk2-KO) mice and analyzed 14 days later. AT1 lineage cells in AT1Ptk2-KO mice express AT2 cell marker Sftpc (k). Quantification of EYFP+ Sftpc+ reprogrammed AT2 cells from n = 5 mice (l). *** P < 0.001 and ** P < 0.01 by one-way ANOVA (c) and two-tailed t-test (e, g, j). Each dot represents an individual mouse or cell, and error bars indicate mean with s.d. For Box and whisker plots, bars represent min and max values. Scale bars: b, h, i, k, 25 μm; f, 10 μm. See also Figure S5.
Figure 5.
Figure 5.. Nuclear lamina-chromatin interactions discriminate alveolar epithelial cellular fate
a. AT1 and AT2 cells were isolated from HopxEGFP (AT1) or SftpcEGFP (AT2) mice by fluorescence-activated cell sorting (FACS) and used for Lamin B1 ChIP-seq. Representative Lamin B1 ChIP-seq tracks (right) for AT1 and AT2 cells, showing AT1 and AT2-specific LADs. Black bars represent EDD-defined LADs. b. Comparison of AT1 and AT2 LAD genes. Pathway enrichment analysis of AT2-LAD genes reveals an enrichment of genes associated with actin cytoskeleton and focal adhesion. c. DotPlot showing LAD gene expression in AT1 and AT2 cells. scRNA-seq data obtained from this study were used. d. Lamin B1 ChIP-seq tracks for AT1 and AT2 cells, showing that Wasl loses residence in AT1 cells. e. Oligo-FISH of Wasl loci in lung sections from HopxEGFP AT1 and SftpcEGFP AT2 reporter mice. Arrowheads indicate Wasl locus. f. Lamin B1 ChIP-seq tracks for AT1 and AT2 cells, showing that Slc34a2 loses residence in AT2 cells. g. Oligo-FISH of Slc34a2 loci in lung sections from HopxEGFP AT1 and SftpcEGFP AT2 reporter mice. Arrowheads indicate Slc34a2 locus. h. 3D Quantification of the distance between Wasl (n = 113 AT1 and n = 112 AT2 cells) or Slc34a2 (n = 101 AT1 and n = 112 AT2 cells) loci and Lamin B1. Imaris returned negative values when a FISH signal was embedded in the nuclear lamina. *** P < 0.001 by two-tailed t-test. Each dot represents an individual cell, and error bars indicate mean with s.d. Scale bars: e, g, 2.5 μm. See also Figure S6.
Figure 6.
Figure 6.. Alveolar epithelial fate changes involve LAD reorganization
a-b. Oligo-FISH of Wasl (a) and Slc34a2 (b) loci in lung sections from control and Cdc42AT1-KO mice. Arrowheads indicate Wasl (a) or Slc34a2 (b). c. Quantification of the distance between Wasl (n = 33 AT1 and n = 25 AT2rep cells for Cdc42AT1-KO, and n = 25 AT1 and n = 23 AT2rep cells for Ptk2AT1-KO) or Slc34a2 (n = 36 AT1 and n = 26 AT2rep cells for Cdc42AT1-KO, and n = 31 AT1 and n = 23 AT2rep cells for Ptk2AT1-KO) loci and Lamin B1 for control AT1 and AT2rep cells. d. Oligo-FISH of Wasl and Slc34a2 loci for AT2 cells from micropattern experiments. Arrowheads indicate Wasl (left) or Slc34a2 (right). e. Quantification of the distance between Wasl (n = 26 constrained, n = 26 unconstrained, n = 22 untreated, and n = 23 FAK inhibitor-treated cells) or Slc34a2 (n = 31 constrained, n = 27 unconstrained, n = 21 untreated, and n = 23 FAK inhibitor-treated cells) loci and Lamin B1. f. Primary AT2 cells were transfected with lentivirus containing dominant-negative KASH and analyzed on day 3. g-h. Dominant-negative KASH inhibits AT2 cell differentiation (g). Quantification of Ager/Sftpc ratio and Ager+ cell ratio from n = 37 control vector-transfected and n = 40 dominant-negative KASH-transfected cells from n = 3 experiments (h). i. Quantification of the distance between Wasl (n = 24 control and n = 20 dominant-negative KASH-transfected cells) or Slc34a2 (n = 20 control and n = 21 dominant-negative KASH-transfected cells) loci and Lamin B1 from n = 3 experiments. *** P < 0.001 and ** P < 0.01 by two-tailed t-test. Each dot represents an individual cell, and error bars indicate mean with s.d. Scale bars: a (left and middle), b (left and middle), g, 10 μm; a (right), b (right), d, 2.5 μm.
Figure 7.
Figure 7.. Alveolar cell fate is maintained by active breathing movements
a-d. Unilateral lung ligation reprograms AT1 cells into AT2 cells. A gross morphological image of a mouse lung 28 days after sham surgery or unilateral lung ligation (a). The left main bronchus was ligated without affecting the left pulmonary artery or vein. Unilateral lung ligation and lineage-tracing were performed on HopxCreERT2; R26REYFP mice, and the mice were analyzed at 28 days later (b). Both the right (control) and left (ligated) lungs were analyzed. AT1 lineage cells express AT2 marker Sftpc in the ligated lung (c). White arrowheads indicate AT1 cells and yellow arrowheads indicate AT2rep cells. Quantification of EYFP+ Sftpc+ AT2rep cells from n = 5 mice from 3 independent experiments (d). e-f. scRNA-seq analysis of wildtype alveolar epithelial cells and lineage-traced cells from HopxCreERT2; R26REYFP mice after unilateral lung ligation. AT2rep cells co-cluster with wildtype AT2 cells (e). Correlation analysis shows high similarity between AT2rep and wildtype AT2 cells (f). g-h. YAP does not localize to the AT2rep nucleus and F-actin does not contact AT2rep nucleus. Representative images (g) and quantification (h) of perinuclear actin for control AT1 and AT2rep cells (n = 5 mice). Control lung and ligated left lung were adhered to the same glass slide. Actin intensity for AT2rep cells was standardized to that of control AT1 cells on the same glass slide. i. Model of AT1 and AT2 cell regulation by biophysical forces. Each dot represents an individual mouse, and error bars indicate mean with s.d. Scale bars: c, 25 μm; g, 2.5 μm. See also Figure S7.

Comment in

References

    1. Tschumperlin DJ, Ligresti G, Hilscher MB, and Shah VH (2018). Mechanosensing and fibrosis. J Clin Invest 128, 74–84. 10.1172/JCI93561. - DOI - PMC - PubMed
    1. Haak AJ, Kostallari E, Sicard D, Ligresti G, Choi KM, Caporarello N, Jones DL, Tan Q, Meridew J, Diaz Espinosa AM, et al. (2019). Selective YAP/TAZ inhibition in fibroblasts via dopamine receptor D1 agonism reverses fibrosis. Sci Transl Med 11. 10.1126/scitranslmed.aau6296. - DOI - PMC - PubMed
    1. Liu F, Lagares D, Choi KM, Stopfer L, Marinkovic A, Vrbanac V, Probst CK, Hiemer SE, Sisson TH, Horowitz JC, et al. (2015). Mechanosignaling through YAP and TAZ drives fibroblast activation and fibrosis. Am J Physiol Lung Cell Mol Physiol 308, L344–357. 10.1152/ajplung.00300.2014. - DOI - PMC - PubMed
    1. Barkauskas CE, Cronce MJ, Rackley CR, Bowie EJ, Keene DR, Stripp BR, Randell SH, Noble PW, and Hogan BL (2013). Type 2 alveolar cells are stem cells in adult lung. J Clin Invest 123, 3025–3036. 10.1172/JCI68782. - DOI - PMC - PubMed
    1. Zacharias WJ, Frank DB, Zepp JA, Morley MP, Alkhaleel FA, Kong J, Zhou S, Cantu E, and Morrisey EE (2018). Regeneration of the lung alveolus by an evolutionarily conserved epithelial progenitor. Nature 555, 251–255. 10.1038/nature25786. - DOI - PMC - PubMed

Publication types