. 2023 Jun;193(6):829-842.
doi: 10.1016/j.ajpath.2023.02.010. Epub 2023 Mar 3.

Excess Growth Hormone Triggers Inflammation-Associated Arthropathy, Subchondral Bone Loss, and Arthralgia

Affiliations

Excess Growth Hormone Triggers Inflammation-Associated Arthropathy, Subchondral Bone Loss, and Arthralgia

Sher B Poudel et al. Am J Pathol. 2023 Jun.

Abstract

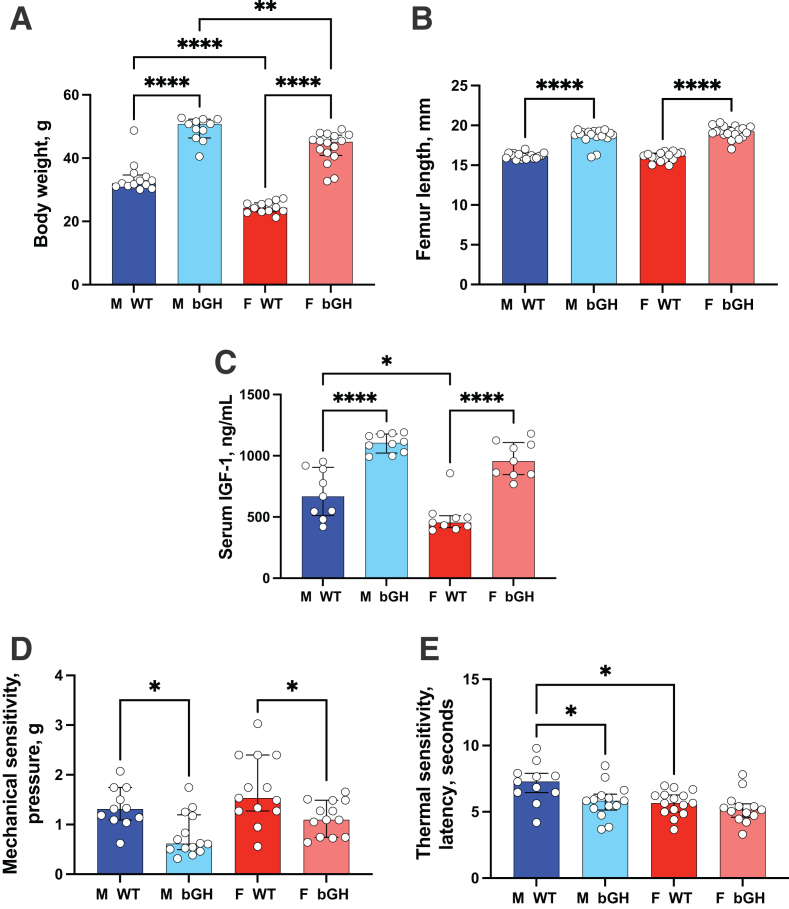
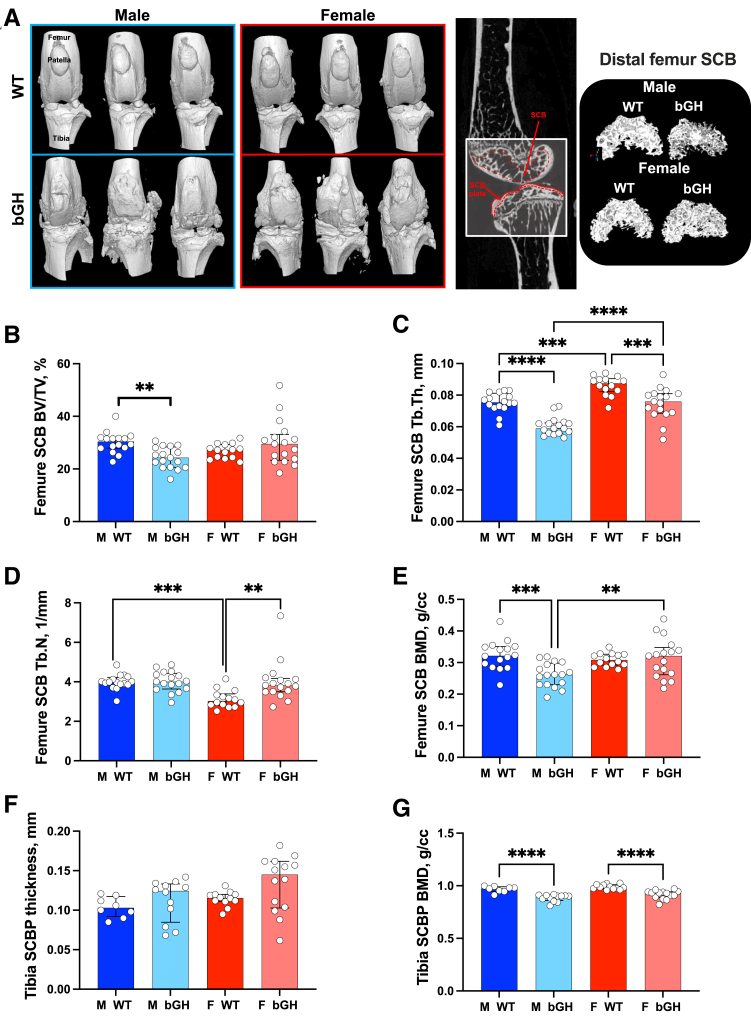
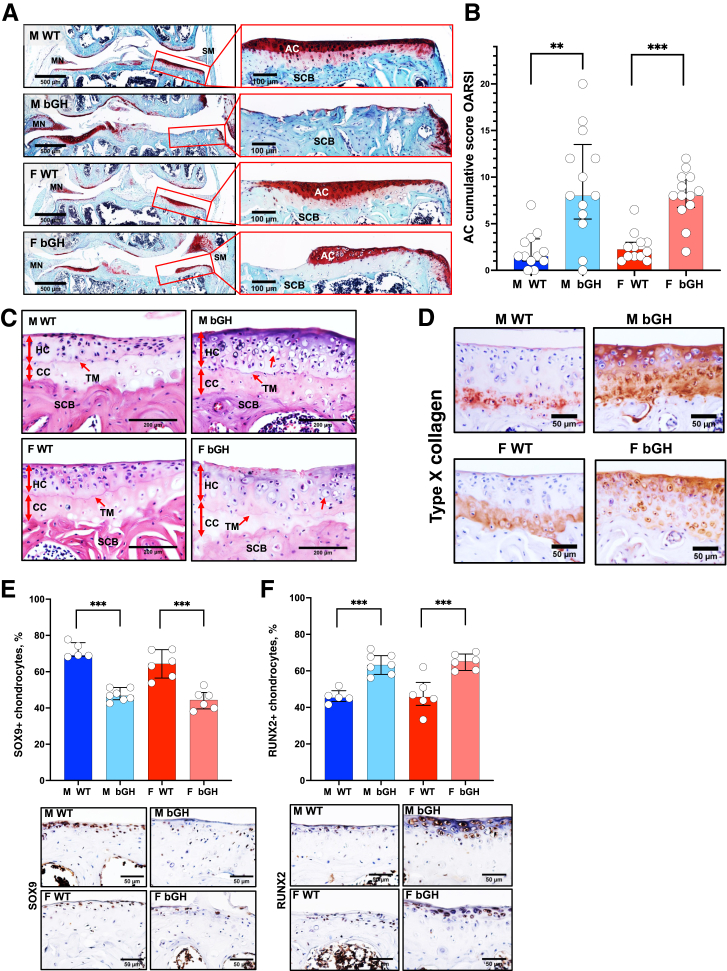
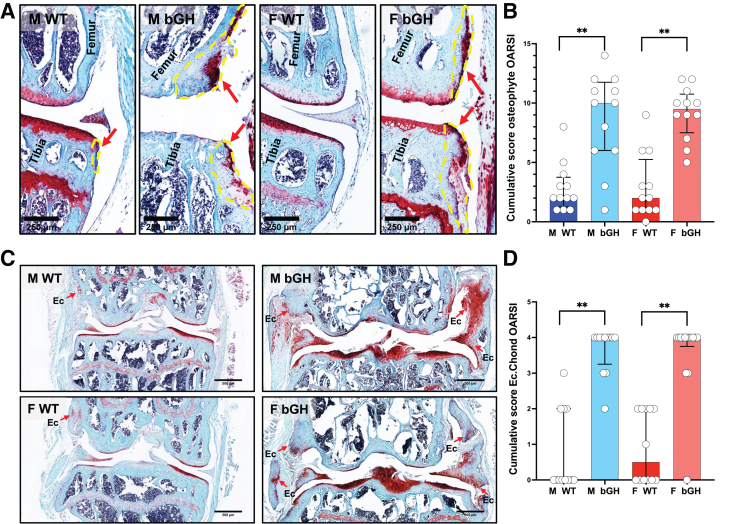
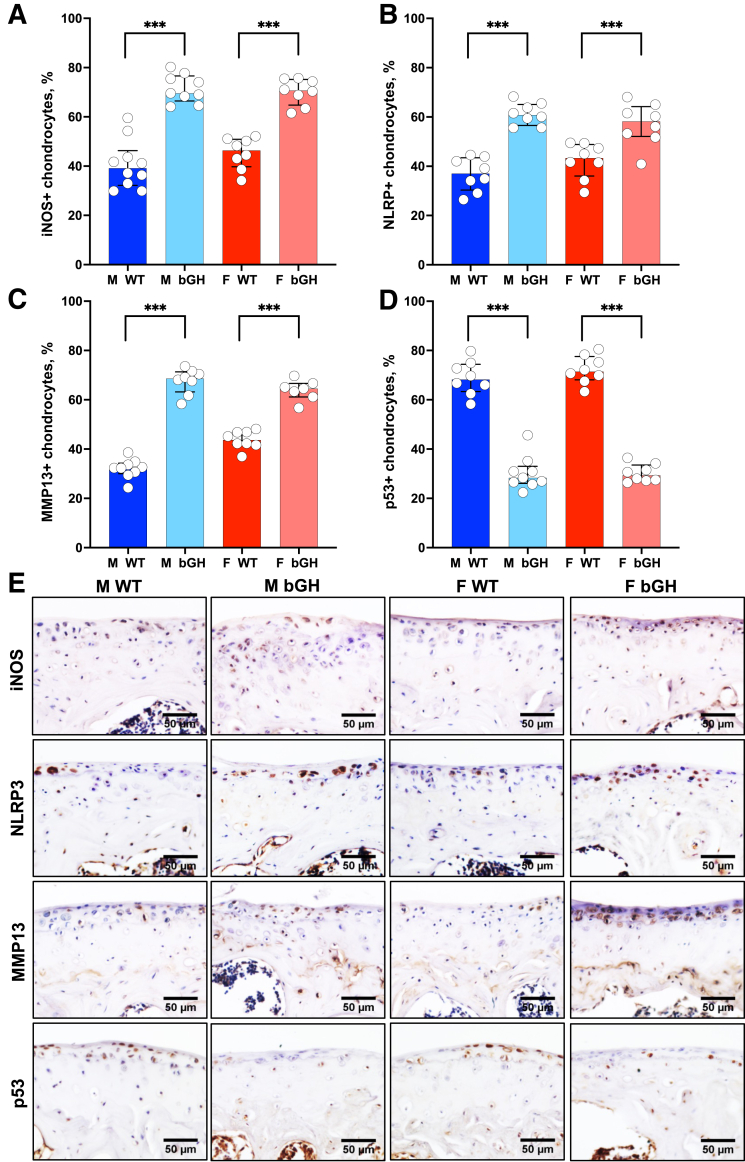
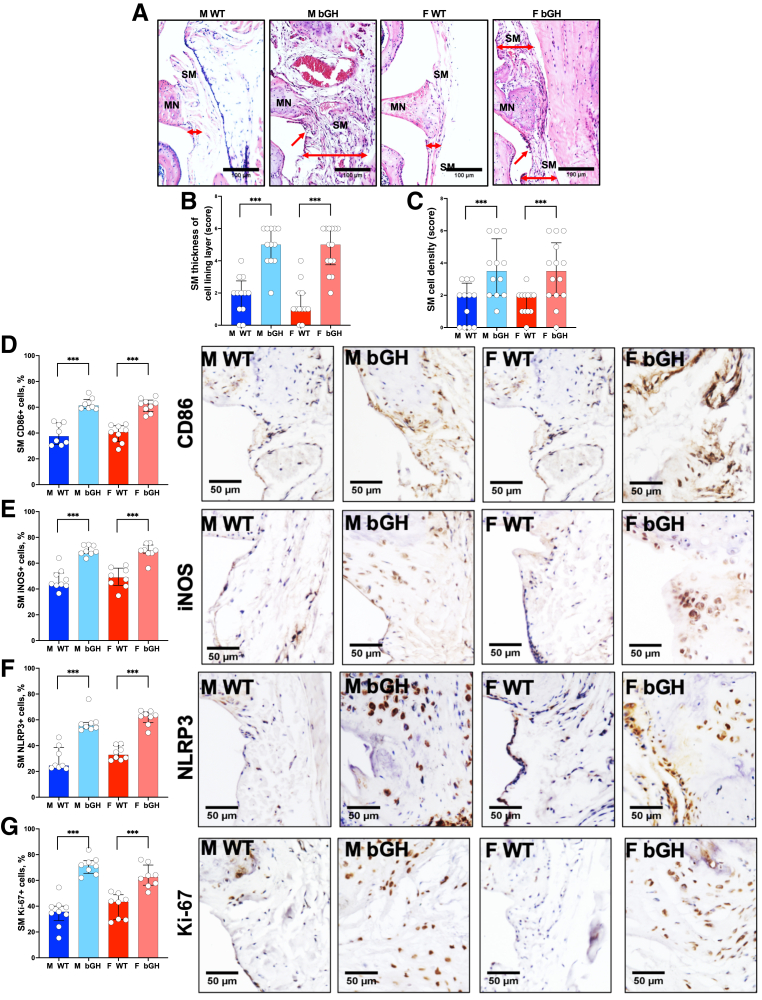
Growth hormone (GH) is a key mediator of skeletal growth. In humans, excess GH secretion due to pituitary adenoma, seen in patients with acromegaly, results in severe arthropathies. This study investigated the effects of long-term excess GH on the knee joint tissues. One year-old wild-type (WT) and bovine GH (bGH) transgenic mice were used as a model for excess GH. bGH mice showed increased sensitivity to mechanical and thermal stimuli, compared with WT mice. Micro-computed tomography analyses of the distal femur subchondral bone revealed significant reductions in trabecular thickness and significantly reduced bone mineral density of the tibial subchondral bone-plate associated with increased osteoclast activity in both male and female bGH compared with WT mice. bGH mice showed severe loss of matrix from the articular cartilage, osteophytosis, synovitis, and ectopic chondrogenesis. Articular cartilage loss in the bGH mice was associated with elevated markers of inflammation and chondrocyte hypertrophy. Finally, hyperplasia of synovial cells was associated with increased expression of Ki-67 and diminished p53 levels in the synovium of bGH mice. Unlike the low-grade inflammation seen in primary osteoarthritis, arthropathy caused by excess GH affects all joint tissues and triggers severe inflammatory response. Data from this study suggest that treatment of acromegalic arthropathy should involve inhibition of ectopic chondrogenesis and chondrocyte hypertrophy.


Figures

Figure 1
Figure 1
Osteoarthritis-associated arthralgia in bovine growth hormone (bGH) mice. AC: One-year–old bGH mice exhibit increased body weight (A) and increased femur length (B), associated with significant increases in serum insulin-like growth factor-1 (IGF-1) levels (C), compared with age-matched wild-type (WT) mice [body weight: male (M) WT, n = 13; M bGH, n = 11; female (F) WT, n = 12; and F bGH, n = 16; femur length: M WT, n = 17; M bGH, n = 17; F WT, n = 15; and F bGH, n = 19; and serum IGF levels: M WT, n = 9; M bGH, n = 10; F WT, n = 9; and F bGH, n = 9]. D: von Frey test: mice were placed individually in a small cage on an elevated wire mesh. A monofilament was applied perpendicularly to the plantar surface of the hind paw until it buckles, delivered at a constant predetermined force (0.04 to 2.0 g) for 2 to 5 seconds. Both male and female bGH mice responded to a lower pressure, indicating increased sensitivity (M WT, n = 11; M bGH, n = 14; F WT, n = 13; and F bGH, n = 13). E: Hargreaves' test: the latency to respond to a thermal stimulus applied to the paw was determined by the time it takes for the mouse to withdraw the hind paw from the heat source and/or lick the hind paw. bGH male mice showed a significant reduction in the latency of a nociceptive behavior (M WT, n = 11; M bGH, n = 14; F WT, n = 15; and F bGH, n = 13). Data presented as median ± IQR (AE). ∗P < 0.05, ∗∗P < 0.01, and ∗∗∗∗P < 0.0001.
Figure 2
Figure 2
Excess growth hormone (GH) impairs the morphology of the femur subchondral bone (SCB) and significantly reduces the tibia SCB plate bone mineral density (BMD). A: Micro–computed tomography (micro-CT) three-dimensional (3D) images of the knee joint from 1-year–old male and female wild-type (WT) and bovine GH (bGH) mice, along with 3D reconstruction of the distal femur SCB, and two-dimensional images indicating the region of interest. BE: Parameters assessed by micro-CT at the distal femur SCB included bone volume/total volume (BV/TV; B), trabecular thickness (Tb.Th; C), trabecular number (Tb.N; D), and SCB bone mineral density (E). F and G: SCB plate (SCBP) thickness (F) and SCBP bone mineral density (G) were determined at the proximal tibia. Data presented as median ± IQR (BG). n = 16 male (M) WT (BG); n = 17 M bGH and female (F) bGH (BG); n = 14 F WT (BG). ∗∗P < 0.01, ∗∗∗P < 0.001, and ∗∗∗∗P < 0.0001. cc, cubic centimeter.
Figure 3
Figure 3
Excess growth hormone (GH) leads to the development of osteoarthritis. A: Representative safranin-o-red–stained sections of the knee joint. Cartilage loss was scored according to the Osteoarthritis Research Society International (OARSI) system. B: Presented are cumulative OARSI scores of the femur and tibia [male (M) wild type (WT), n = 12; M bovine GH (bGH), n = 13; female (F) WT, n = 11; and F bGH, n = 13]. C: Representative images of coronal sections of the tibial plateau stained with hematoxylin and eosin. Red arrows indicate calcified cartilage (CC), hyaline cartilage (noncalcified; HC), tide mark (TM), subchondral bone (SCB), and hypertrophic chondrocytes. D: Presented are immunohistochemistry-stained images of type X collagen in articular cartilage (AC). E and F: Expression levels of sex-determining region Y (SRY) box transcription factor 9 (SOX9; E) and Runt-related transcription factor 2 (RUNX2; F) were assessed by immunohistochemistry. Presented are percentages of positive AC chondrocytes (at the distal femur and tibia) alongside representative immunostained images of coronal sections of the tibial plateau (M WT, n = 5; M bGH, n = 7; F WT, n = 6; and F bGH, n = 6). Data presented as median ± IQR (B, E, and F). ∗∗P < 0.01, ∗∗∗P < 0.001. Scale bars: 500 μm (A, left panels); 100 μm (A, right panels); 200 μm (C); 50 μm (DF). MN, meniscus; SM, synovial membrane.
Figure 4
Figure 4
Excess growth hormone (GH) associates with increased osteophytosis and ectopic chondrogenesis (Ec. Chond). A: Osteophytosis was quantified according to the Osteoarthritis Research Society International (OARSI) scoring system from safranin-o-red–stained sections. Yellow lines and red arrows define osteophytes. B: Presented are cumulative scores of osteophyte formation in the distal femur and proximal tibia. C: Ectopic chondrogenesis was scored from safranin-o-red–stained sections. Red arrows point to areas of ectopic chondrogenesis. D: Presented are cumulative scores of ectopic chondrogenesis of the knee joint. Bovine growth hormone (bGH) mice showed increases in ectopic chondrogenesis at all the knee joint tissues. Data presented as median ± IQR (B and D). n = 12 male (M) wild type (WT), M bGH, and female (F) WT (B and D); n = 13 F bGH (B and D). ∗∗P < 0.01. Scale bars: 250 μm (A); 500 μm (C).
Figure 5
Figure 5
Excess growth hormone (GH) is associated with increased chondrocyte expression of inflammatory markers (medial side of the knee joint) and inhibited tumor suppressor p53 expression. Expression of inflammatory markers was assessed by immunohistochemistry. AD: Presented are percentages of positive articular cartilage (AC) chondrocytes (at the distal femur and tibia) to the following markers: inducible nitric oxide synthase [iNOS; male (M) wild type (WT), n = 10; M bovine GH (bGH), n = 9; female (F) WT, n = 8; and F bGH, n = 8; A], nucleotide oligomerization domain (NOD)–like receptor–pyrin domain-containing 3 (NLRP3; n = 8 in each group; B), matrix metalloproteinase 13 (MMP13; M WT, n = 9; M bGH, n = 8; F WT, n = 8; and F bGH, n = 7; C), and p53 (M WT, n = 8; M bGH, n = 9; F WT, n = 8; and F bGH, n = 8; D). E: Representative immunohistochemistry images of the AC. Data presented as median ± IQR (AD). ∗∗∗P < 0.001. Scale bars = 50 μm (E).
Figure 6
Figure 6
Excess growth hormone (GH) promotes synovitis. A: Synovitis was scored from hematoxylin and eosin–stained sections. Red arrows point to the synovial membrane (SM), and double-headed red arrows define the thickness of the SM. B and C: Thickness of the synovial membrane lining cell layer (B) and synovial membrane cell density (C) was scored according to Osteoarthritis Research Society International scoring system [male (M) wild type (WT), n = 12; M bovine GH (bGH), n = 12; female (F) WT, n = 12; and F bGH, n = 14]. Expression of inflammatory markers was assessed by immunohistochemistry. DG: Presented are percentages of positive cells in the medial synovial membrane alongside representative immunohistochemistry images to the following markers: CD86 (n = 5 in each group; D), inducible nitric oxide synthase (iNOS; n = 5 in each group; E), nucleotide oligomerization domain (NOD)–like receptor–pyrin domain-containing 3 (NLRP3; M WT, n = 8; M bGH, n = 8; F WT, n = 8; and F bGH, n = 8; F), and Ki-67 (M WT, n = 9; M bGH, n = 8; F WT, n = 8; and F bGH, n = 8; G). Data presented as median ± IQR (BG). ∗∗∗P < 0.001. Scale bars: 100 μm (A); 50 μm (DG). MN, meniscus.

Similar articles

Cited by

References

    1. Claessen K.M., Mazziotti G., Biermasz N.R., Giustina A. Bone and joint disorders in acromegaly. Neuroendocrinology. 2016;103:86–95. - PubMed
    1. Wassenaar M.J., Biermasz N.R., Bijsterbosch J., Pereira A.M., Meulenbelt I., Smit J.W., Roelfsema F., Kroon H.M., Romijn J.A., Kloppenburg M. Arthropathy in long-term cured acromegaly is characterised by osteophytes without joint space narrowing: a comparison with generalised osteoarthritis. Ann Rheum Dis. 2011;70:320–325. - PubMed
    1. Colao A., Marzullo P., Vallone G., Marino V., Annecchino M., Ferone D., De Brasi D., Scarpa R., Oriente P., Lombardi G. Reversibility of joint thickening in acromegalic patients: an ultrasonography study. J Clin Endocrinol Metab. 1998;83:2121–2125. - PubMed
    1. Man G.S., Mologhianu G. Osteoarthritis pathogenesis - a complex process that involves the entire joint. J Med Life. 2014;7:37–41. - PMC - PubMed
    1. Akkiraju H., Nohe A. Role of chondrocytes in cartilage formation, progression of osteoarthritis and cartilage regeneration. J Dev Biol. 2015;3:177–192. - PMC - PubMed

Publication types

Supplementary concepts