

doi: 10.1016/j.jid.2023.02.010.
Epub 2023 Mar 3.
Genetic Validation of Psoriasis Phenotyping in UK Biobank Supports the Utility of Self-Reported Data and Composite Definitions for Large Genetic and Epidemiological Studies
Affiliations
- PMID: 36870556
- PMCID: PMC10689249
- DOI: 10.1016/j.jid.2023.02.010
Item in Clipboard
Genetic Validation of Psoriasis Phenotyping in UK Biobank Supports the Utility of Self-Reported Data and Composite Definitions for Large Genetic and Epidemiological Studies
J Invest Dermatol.
2023 Aug.
No abstract available
Figures
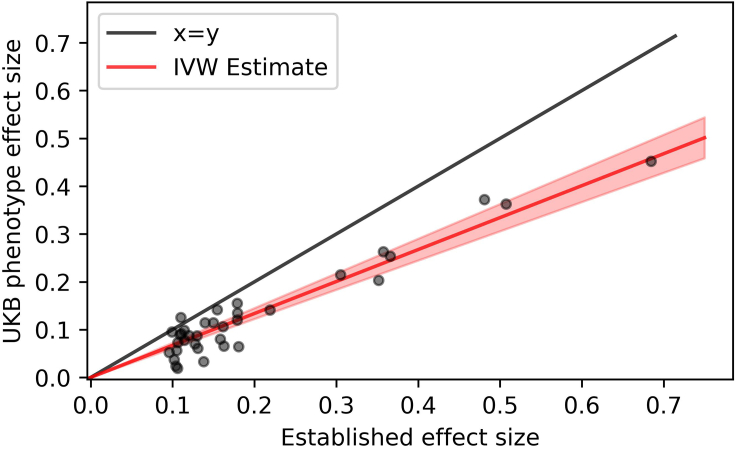
Illustration of regression approach used to assess candidate phenotype diagnostic minPPV (IVW estimate). UK Biobank self-reported psoriasis effect size (y-axis) plot against Tsoi et al. specialist-diagnosed cohort effect size (x-axis) for 35 independent psoriasis risk SNVs. Red line is IVW estimated slope, with the shaded area indicating a 95% CI. CI, confidence interval; IVW, inverse variance–weighted; minPPV, lower bound of positive predictive value for psoriasis phenotype (i.e., IVW regression slope).

Simulations to characterize the impact of psoriasis case dilution on observed effect sizes. IVW estimates for each simulated PPV (1,000 simulations at each case dilution). Boxplots indicate the median and lower and upper quartiles of the simulations, with whiskers indicating 5th and 95th percentile and outliers shown as blue circles. Red line indicates theoretical linear dilution where IVW estimate corresponds to PPV. IVW, inverse variance–weighted; PPV, positive predictive value.

IVW slope estimate by number of cases across all candidate UK Biobank phenotypes. IVW slope estimate plot against the number of cases for each of the UK Biobank psoriasis definitions in Supplementary Table S2. IVW, inverse variance–weighted.

Power to detect novel psoriasis-associated risk factors for top-performing candidate psoriasis definitions. Comparison of phenotype IVW estimate (minPPV) and statistical power to detect novel psoriasis-associated risk factors under various scenarios for selected candidate psoriasis definitions that score highly on both measures. Y-axis: estimated statistical power; x-axis: IVW estimate of candidate psoriasis definition; left column: common risk factor (frequency 0.3); right column: rare risk factor (frequency 0.05); top row: weak risk factor (odds ratio 1.1); bottom row: strong risk factor (odds ratio 1.25). Candidate phenotype abbreviations are described in Table 1. IVW, inverse variance–weighted; minPPV, lower bound for the positive predictive value.

Comparison of candidate psoriasis definition IVW using selected and unselected controls. IVW slope estimates for UK Biobank psoriasis definitions with selected controls (Supplementary Table S2) plot against IVW slope estimate for equivalent UK Biobank psoriasis definitions with unselected controls (Supplementary Table S3). Red line (x = y) represents equality. IVW, inverse variance–weighted.

Comparison of risk allele frequencies between UK Biobank psoriasis controls (N = 141,279) and Tsoi et al. (2017) meta-analysis controls (N = 20,154). Risk allele frequency in UK Biobank psoriasis controls (y-axis) plotted against risk allele frequency in Tsoi et al. (2017) psoriasis controls, for SNVs in Supplementary Table S5 and HLA locus lead SNV (rs12189871).
References
Supplementary References
Publication types
MeSH terms
Grants and funding
LinkOut - more resources
Full Text Sources
Medical
