. 2023 Mar 4;14(1):1240.
doi: 10.1038/s41467-023-36758-9.

Single molecule analyses reveal dynamics of Salmonella translocated effector proteins in host cell endomembranes

Affiliations

Single molecule analyses reveal dynamics of Salmonella translocated effector proteins in host cell endomembranes

Vera Göser et al. Nat Commun. .

Abstract

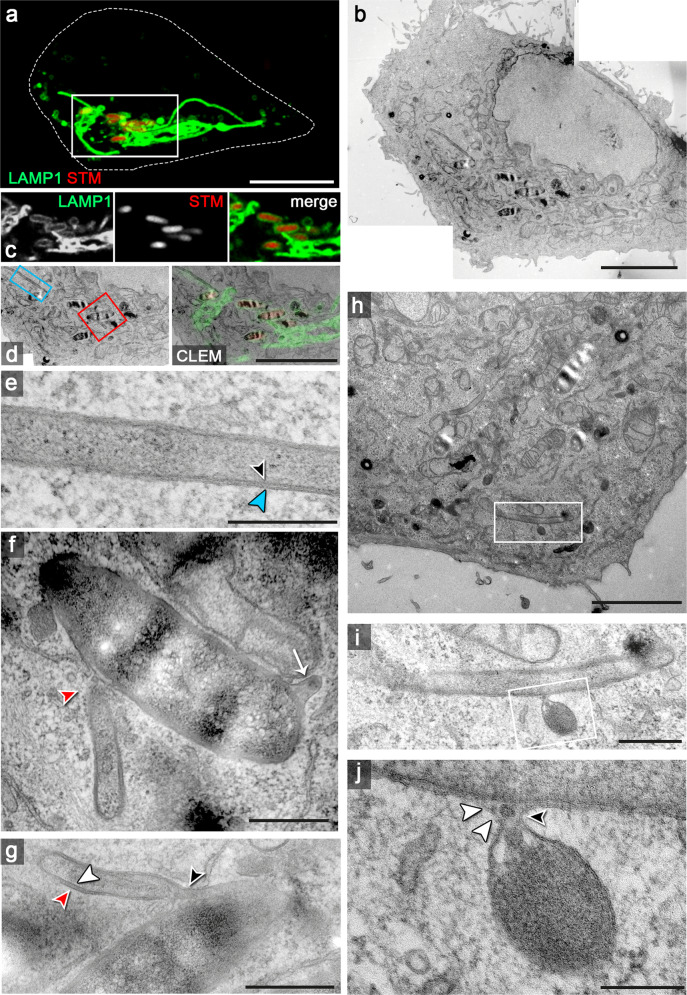
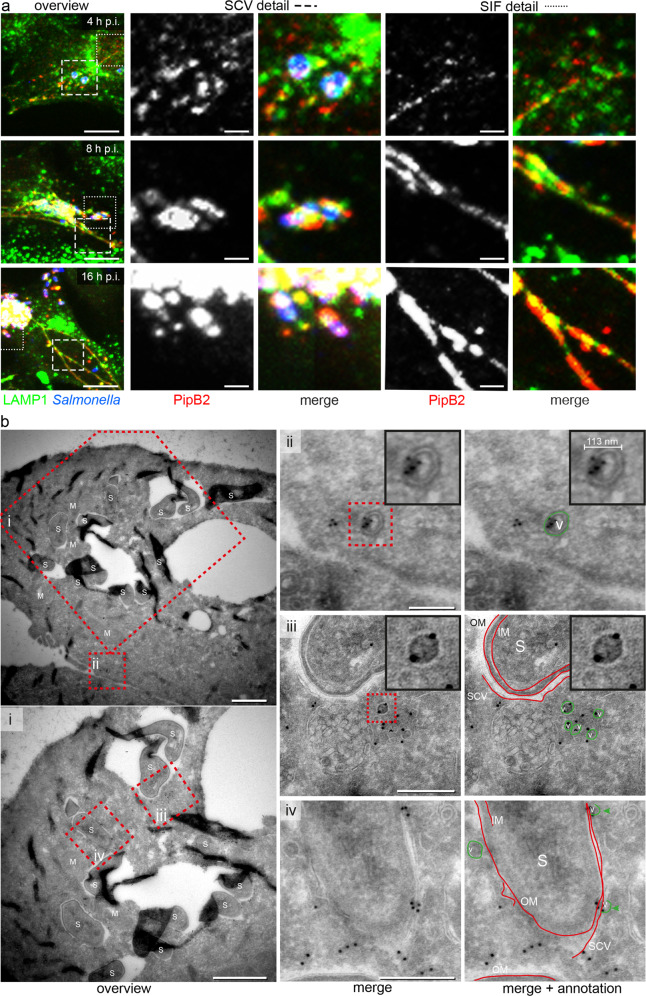
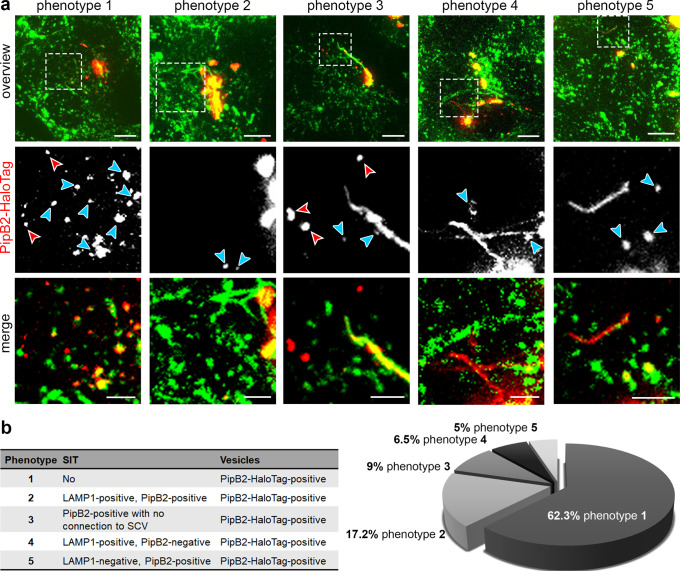
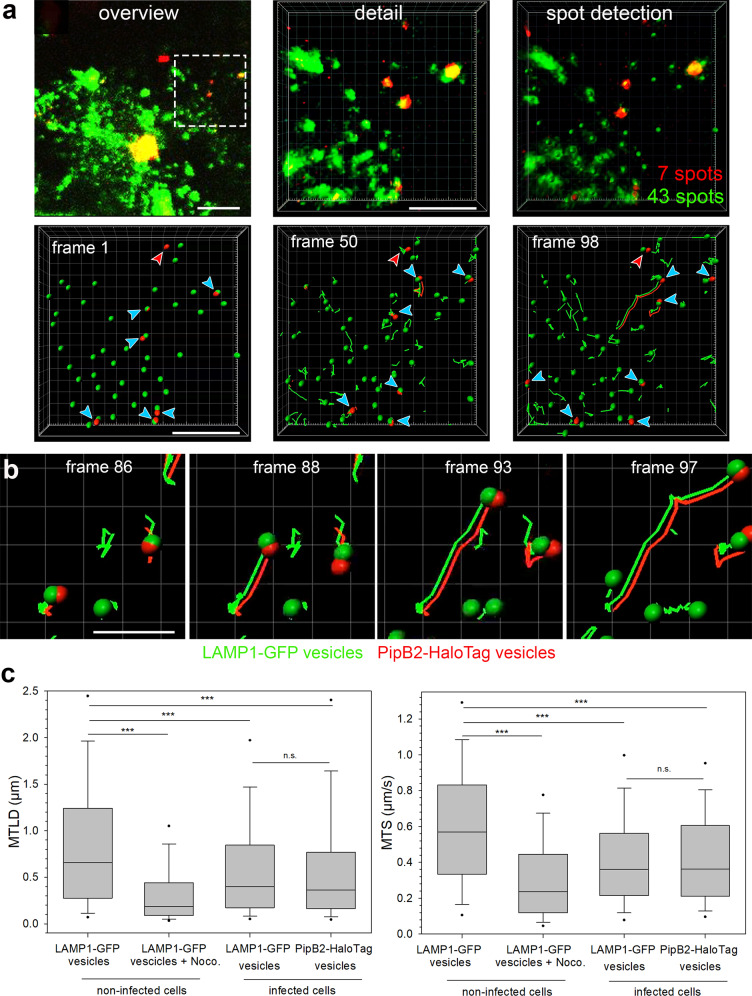
The facultative intracellular pathogen Salmonella enterica remodels the host endosomal system for survival and proliferation inside host cells. Salmonella resides within the Salmonella-containing vacuole (SCV) and by Salmonella-induced fusions of host endomembranes, the SCV is connected with extensive tubular structures termed Salmonella-induced filaments (SIF). The intracellular lifestyle of Salmonella critically depends on effector proteins translocated into host cells. A subset of effectors is associated with, or integral in SCV and SIF membranes. How effectors reach their subcellular destination, and how they interact with endomembranes remodeled by Salmonella remains to be determined. We deployed self-labeling enzyme tags to label translocated effectors in living host cells, and analyzed their single molecule dynamics. Translocated effectors diffuse in membranes of SIF with mobility comparable to membrane-integral host proteins in endomembranes. Dynamics differ between various effectors investigated and is dependent on membrane architecture of SIF. In the early infection, host endosomal vesicles are associated with Salmonella effectors. Effector-positive vesicles continuously fuse with SCV and SIF membranes, providing a route of effector delivery by translocation, interaction with endosomal vesicles, and ultimately fusion with the continuum of SCV/SIF membranes. This mechanism controls membrane deformation and vesicular fusion to generate the specific intracellular niche for bacterial survival and proliferation.


Conflict of interest statement

The authors declare no competing interests.

Figures

Fig. 1
Fig. 1. Interactions of host cell endosomal membranes in STM-infected cells.
HeLa cells stably expressing LAMP1-GFP (green) were infected with STM WT expressing mCherry (red) and CLSM was performed (a, c) to identify SIF-positive cells showing dynamic extension of SIF networks. Cells were fixed 7 h p.i., coordinates registered and samples were processed for TEM (b). Correlation of CLSM and TEM modalities allowed identification of STM in SCV and extending SIF tubules (d). Regions of interest are indicated by boxes and details show a double-membrane (dm) SIF tubule distal to SCV (blue, e), and in connection with the SCV (f, g). The white box in h indicates an event of vesicle interaction with a dm SIF, and details are shown in higher magnification (i, j). Micrographs show events representative from four independent experiments, and further events are shown in Supplementary Fig. 1 and Supplementary Fig. 2. Arrowheads indicate interactions with double-membrane compartments, while single-membrane tubules are indicated by arrows. Scale bars: 10 µm, 5 µm (b, c), 3 µm (h), 500 nm (e, f, i), 300 nm (g), 200 nm (j).
Fig. 2
Fig. 2. Kinetics of distribution of SPI2-T3SS effector proteins and vesicular localization of translocated SseF.
a Distribution of translocated effector proteins over the course of infection. HeLa cells stably expressing LAMP1-GFP (HeLa LAMP1-GFP) were infected with STM WT expressing pipB2::M45. At various time points after infection, cells were fixed and immunolabeled for STM (blue) and effector proteins (red). Details of SCV and SIF are shown. Micrographs show events representative from three independent experiments, and further events and time points are shown in Supplementary Fig. 3. Scale bars: 10 and 2 µm in overview and details, respectively. b Vesicular localization of translocated SseF revealed by immunogold EM. HeLa LAMP1-GFP cells were infected with STM WT expressing sseF::3xHA and fixed 8 h p.i. The samples were processed for immunogold labeling for HA-tagged SseF. Details of overviews (b, i) of SseF immunogold-labeled sections are shown in iiiv. (ii) A subset of triple HA-tagged SseF immunogold labeling is associated with the outer and inner side of spherical vesicular membranes. See also color highlighted vesicle structure in green on the left. Inserts strongly clarify localization of immunogold label inside the vesicle and on the vesicular membrane. (iii) Triple HA-tagged SseF immunogold labeling is also found on endomembranes mostly in close proximity to vesicles. Color marking in green for vesicles and red for SCV, inner (IM) and outer (OM) bacterial membrane is highlighting the distribution of gold labeling on membrane structures. Inserts strongly clarify localization of immunogold label on the vesicular membrane. iv) The majority of triple HA-tagged SseF immunogold labeling is distributed on endomembranes, specifically on membranes closely associated with the SCV and directly on the SCV. See also color marking in red indicating for SCV membrane, IM and OM. Micrographs show events representative from three independent experiments, and further sections are shown in Supplementary Fig. 4. Scale bars: 1 µm in overviews (b, i); 250 nm in iiiv.
Fig. 3
Fig. 3. Models for targeting of SPI2-T3SS effector proteins to host cell endosomal membranes.
Model a: Effector proteins are directly inserted into the SCV membrane after translocation and diffuse from the SCV to the periphery of SIF. Model b: Effector proteins are translocated into the cytosol, chaperoned, and inserted into endomembranes by unknown host factors. Effector proteins are delivered by fusion of host endosomal vesicles with SIF and SCV. Model c: Endomembranes are recruited to SCV and T3SS where effector proteins are directly delivered and inserted into endomembranes. After fusion of endosomal vesicles effector proteins are delivered. In addition to fusion of endosomal vesicles to SCV and SIF, budding of effector-positive vesicles from the SCV/SIF continuum may be considered. Combinations of models ac may be considered.
Fig. 4
Fig. 4. Single molecule localization and tracking of STM SPI2-T3SS effector proteins on double-membrane SIF.
HeLa cells stably expressing LAMP1-GFP were infected with STM sifA mutant strain expressing SifA-HaloTag with a multiplicity of infection (MOI) of 75. Following incubation for 7 h under standard cell culture conditions, LCI was performed. Labeling reactions were performed directly before imaging, using HTL-TMR with a final concentration of 20 nM for 15 min at 37 °C. a Shown are representative SRM images acquired using 15% laser power at the focal plane, rendered from single molecule localizations (SML) and tracking (SMT) within 200 consecutive frames. Selected frames (frame rate: 32 frames per s) of the TMR signal, localization, and tracking are presented (also showing elapsed trajectories). b Selected frames of trajectories from a single molecule of indicated effector-HaloTag fusions. Using at least 2800 pooled trajectories for proteins in at least 20 infected cells in three biological replicates recorded under the same conditions, the diffusion coefficient D was calculated using the Jaqaman algorithm. The indicated error represents the calculated error of the resulting slope (with 95% confidence bounds). A sequence of 200 frames for SifA-HaloTag is shown in Supplementary Movie 2. c SML and SMT analyses of mutant SifA-HaloTag. STM translocating a SifA allele with deletion of aa 331-336 (SifAΔ6) were used to infect host cells as in a) and analyses were performed as for WT SifA. d Murine macrophage-like RAW264.7 cells stably expressing LAMP1-GFP were activated by γ-Interferon and infected with STM strains grown to stationary phase at MOI 50, and SML and SMT analyses were performed as for a). Selected frames of trajectories from a single molecule of indicated effector-HaloTag fusions in RAW264.7 cells. Scale bars: 10 and 1 µm in overviews and details, respectively.
Fig. 5
Fig. 5. Single molecule localization and tracking of STM SPI2-T3SS effector proteins on single-membrane SIF.
HeLa cells stably expressing LAMP1-GFP were infected with STM sseF, sifA mutant strains expressing sifA::HaloTag::HA and labeled with HTL-TMR as described above. For visualization of LAMP1-HaloTag, the cells were transfected with LAMP1::HaloTag::HA one day before infection, and infected with STM sseF mutant strain. a, b Representative SRM images acquired using 15% laser power at the focal plane, rendered from single-molecule localization and tracking within 200 consecutive frames. Selected frames (frame rate: 32 frames per second) of the TMR signal, localization and tracking are presented, (also showing elapsed trajectories). The sequences of 200 frames of SifA-HaloTag and LAMP1-HaloTag are shown in Supplementary Movie 7 and Supplementary Movie 8. c Selected frames of trajectories from a single molecule. Using at least 2,800 pooled trajectories for proteins in at least 20 infected cells in three biological replicates recorded under the same conditions, the diffusion coefficient D was calculated applying the Jaqaman algorithm. The indicated error is the calculated error of the resulting slope (with 95% confidence bounds). d Intensity profile analysis of SifA-HaloTag trajectories on sm and dm SIF. The intensity profiles of trajectories tracked on SIF were analyzed using the FIJI plot profile tool. SIF from various infected cells were processed and the resulting pixel range of the profile was determined. e HeLa cells stably expressing LAMP1-GFP were infected with STM sseF mutant strain expressing sseF::HaloTag::HA and labeled with HTL-TMR as described above. The transition leading to trailing SIF was imaged with 488 nm laser excitation for 1 frame (frame rate: 32 frames per second) following 561 nm laser excitation for 150 frames in 4 cycles. Shown are representative SRM images acquired using 15% laser power at the focal plane, rendered from SML within each of the 150 consecutive frames. High local concentration of effector protein on leading SIF is indicated by arrowheads. The sequences of 5 frames of LAMP1-GFP are shown in. Scale bars: 10 and 1 µm in overviews and details, respectively.
Fig. 6
Fig. 6. Distribution of PipB2-HaloTag in the early phase of infection.
HeLa LAMP1-GFP cells were infected with STM pipB2 mutant strain expressing pipB2::HaloTag::HA. a LCI was performed directly after cells were stained with 1 µM HTL-TMR at 3.5 h p.i. for 30 min. For infected cells with PipB2-HaloTag-positive vesicles, the phenotypes of PipB2-HaloTag localization on vesicles and SIT were determined. Blue arrowheads indicate vesicles double-positive for LAMP1-GFP and HTL-TMR-labeled PipB2-HaloTag. Red arrowheads indicate vesicles negative for LAMP1-GFP and positive for PipB2-HaloTag. At least 100 infected cells from four independent experiments were analyzed. Scale bars: 10 and 2 µm in overviews and details, respectively. b Quantification of distinct PipB2-HaloTag distributions in infected HeLa LAMP1-GFP cells.
Fig. 7
Fig. 7. Tracking of vesicles positive for LAMP1-GFP and PipB2-HaloTag.
HeLa LAMP1-GFP cells were either not treated, treated with nocodazole to inhibit vesicle movement, or infected with STM ΔpipB2 strain expressing pipB2::HaloTag::HA. a An infected HeLa LAMP1-GFP cell with LAMP1-GFP (green) and PipB2-HaloTag-TMR (red) was imaged for 200 frames (0.39 frames/sec) by SDM in dual camera streaming mode. Vesicle tracking analysis was done with the Imaris spot detection tool and co-motion analysis is shown at different time points (Supplementary Movie 12). Blue arrowheads indicate vesicles positive for LAMP1-GFP and effector protein fused to HaloTag and labeled with TMR. Red arrowheads indicate vesicles negative for LAMP1-GFP and positive for effector protein. b Trajectories of single vesicles labeled with LAMP1-GFP and PipB2-HaloTag. Scale bars: 10 and 5 µm in overviews and details, respectively in a, 2 µm in b. c Quantification of at least 858 trajectories from five individual cells per condition. Box plot analysis of mean track displacement length (MTDL) and mean track speed (MTS) of vesicles under various conditions. Boxes indicate 25th and 75th percentiles, the lines within boxes mark medians, whiskers above and below boxes indicate the 90th and 10th percentiles, and dots indicate outliers. Statistical analyses were performed by two-sided Rank Sum test and significances are indicated as follows: n.s., not significant, *p < 0.05, ***p < 0.001.
Fig. 8
Fig. 8. Conversion of vesicular to tubular distribution of translocated effector proteins.
HeLa LAMP1-GFP cells were infected with STM ΔpipB2 strain expressing pipB2::HaloTag::HA. Cells were either not treated (a), or treated with nocodazole (5 µg ml−1) 2 h p.i. b The inhibitor was removed after HaloTag staining and cells were washed twice. LCI was performed using SDM directly after cells were stained with 1 µM HTL-TMR for 30 min. The cells were imaged over a period of 8 h every 30 min (Supplementary Movie 15, Supplementary Movie 16). Representative STM are labeled (S), and PipB2-HaloTag-positive vesicles or SIF are indicated by yellow or blue arrowheads, respectively. Micrographs representative for infected cells at indicated time points from three independent experiments are shown in a, b. Scale bars: 5 µm. c The Imaris surface analysis tool was used to determine in an infected cell at 5 h and 12 h p.i. the amounts of either vesicles (orange), or SIF tubular structures (blue) positive for PipB2-HaloTag. The analysis was performed for events in a cell representative of infected cells in three independent experiments.

References

    1. Weber MM, Faris R. Subversion of the endocytic and secretory pathways by bacterial effector proteins. Front. Cell. Dev. Biol. 2018;6:1. doi: 10.3389/fcell.2018.00001. - DOI - PMC - PubMed
    1. LaRock DL, Chaudhary A, Miller SI. Salmonellae interactions with host processes. Nat. Rev. Microbiol. 2015;13:191–205. doi: 10.1038/nrmicro3420. - DOI - PMC - PubMed
    1. Schroeder N, Mota LJ, Meresse S. Salmonella-induced tubular networks. Trends Microbiol. 2011;19:268–277. doi: 10.1016/j.tim.2011.01.006. - DOI - PubMed
    1. Garcia-del Portillo F, Zwick MB, Leung KY, Finlay BB. Salmonella induces the formation of filamentous structures containing lysosomal membrane glycoproteins in epithelial cells. Proc. Natl Acad. Sci. USA. 1993;90:10544–10548. doi: 10.1073/pnas.90.22.10544. - DOI - PMC - PubMed
    1. Krieger V, et al. Reorganization of the endosomal system in Salmonella-infected cells: the ultrastructure of Salmonella-induced tubular compartments. PLoS Pathog. 2014;10:e1004374. doi: 10.1371/journal.ppat.1004374. - DOI - PMC - PubMed

Publication types

Substances

LinkOut - more resources