. 2023 Mar 4;14(1):1247.
doi: 10.1038/s41467-023-36892-4.

CDK4/6 inhibition triggers ICAM1-driven immune response and sensitizes LKB1 mutant lung cancer to immunotherapy

Affiliations

CDK4/6 inhibition triggers ICAM1-driven immune response and sensitizes LKB1 mutant lung cancer to immunotherapy

Xue Bai et al. Nat Commun. .

Abstract

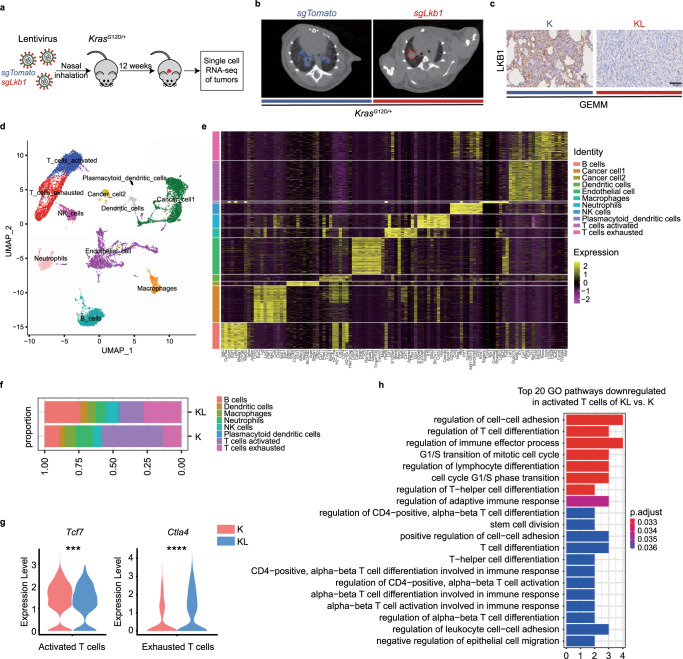
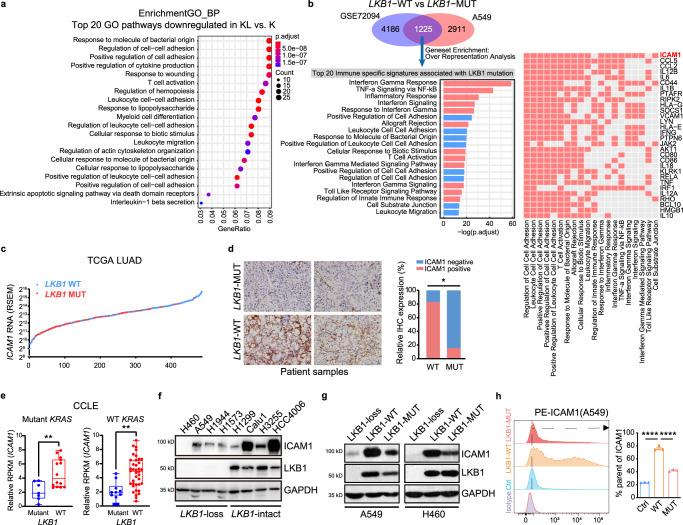
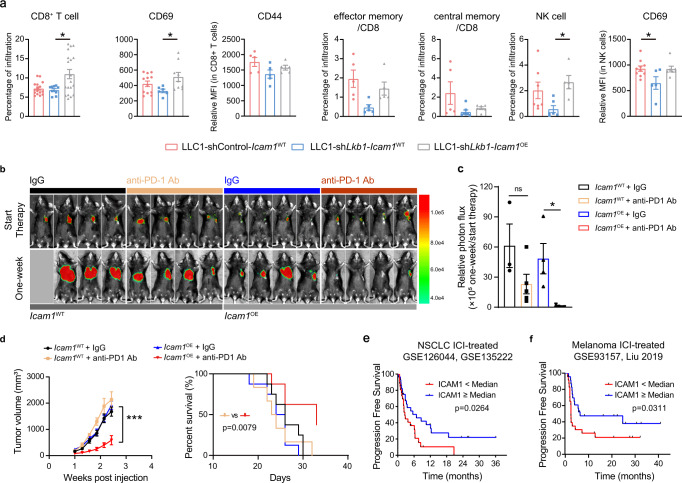
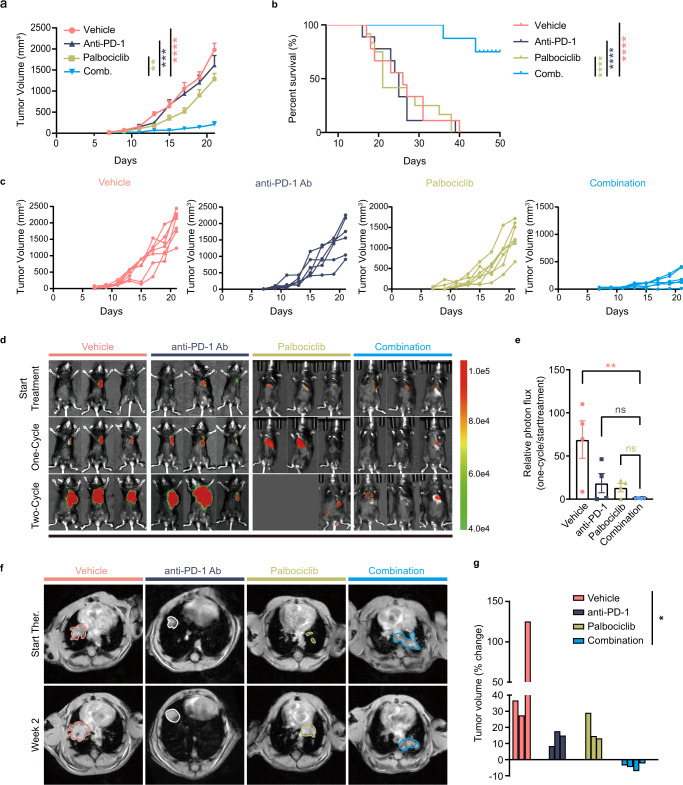
Liver kinase B1 (LKB1) mutation is prevalent and a driver of resistance to immune checkpoint blockade (ICB) therapy for lung adenocarcinoma. Here leveraging single cell RNA sequencing data, we demonstrate that trafficking and adhesion process of activated T cells are defected in genetically engineered Kras-driven mouse model with Lkb1 conditional knockout. LKB1 mutant cancer cells result in marked suppression of intercellular adhesion molecule-1 (ICAM1). Ectopic expression of Icam1 in Lkb1-deficient tumor increases homing and activation of adoptively transferred SIINFEKL-specific CD8+ T cells, reactivates tumor-effector cell interactions and re-sensitises tumors to ICB. Further discovery proves that CDK4/6 inhibitors upregulate ICAM1 transcription by inhibiting phosphorylation of retinoblastoma protein RB in LKB1 deficient cancer cells. Finally, a tailored combination strategy using CDK4/6 inhibitors and anti-PD-1 antibodies promotes ICAM1-triggered immune response in multiple Lkb1-deficient murine models. Our findings renovate that ICAM1 on tumor cells orchestrates anti-tumor immune response, especially for adaptive immunity.


Conflict of interest statement

The authors declare no competing interests.

Figures

Fig. 1
Fig. 1. Mutant Kras/Lkb1 driven lung cancer cell atlas was established.
a Schematic illustration for generation of the genetically engineered Kras-driven mouse model to establish KrasG12D/+ mice with conditional knockout of Lkb1. b Micro-CT scan of the mouse lung. Left: KrasG12D/+ sgTomato (K) mouse. Right: KrasG12D/+ sgLkb1 (KL) mouse. c IHC staining of LKB1 in mouse lung tumor sections in K and KL mouse. Scale bar, 50 μm (40×). n = 1 experiment with n = 5 mice. d UMAP plot of 14,260 cells from lung tumor samples of K (n = 1) and KL (n = 1) mouse, colored by their 11 major cell types. e Heatmap of canonical cell-type markers of 11 major cell types. f Immune cell-type composition of each sample. g Expression level of Tcf7 in activated T cells and that of Ctla4 in exhausted T cells from lung tumor samples of K and KL mouse. ***p = 0.001, ****p < 0.0001. h Enrichment analysis on differentially expressed genes (DEGs) in KL versus K along the activated T cells using clusterProfiler for gene sets in GO terms. (Data were presented as violin plot (median, 25–75%, range). Statistical significance was tested with a two-tailed Mann–Whitney U test. ns, not significant; ***p < 0.001; ****p < 0.0001. Source data are provided as a Source Data file.).
Fig. 2
Fig. 2. LKB1 regulates ICAM1 expression in non-small cell lung cancer.
a Enrichment analysis on DEGs in the cancer cells between KL (n = 701 cells) versus K (n = 662 cells) using clusterProfiler for gene sets in GO terms. b Venn diagram showing the overlap of DEGs between LKB1 wild-type and mutated groups both in tissues (GSE72094, n = 374 for LKB1-WT, n = 68 for LKB1-MUT) and cells (A549 cells, n = 3 for LKB1-WT, n = 3 for LKB1-MUT). Overrepresentation analysis was performed using these overlap genes, and the top 20 immune-specific signatures were revealed. Ranking of the genes among these enriched signatures according to their frequency. c Plot displays ICAM1 expression level in lung adenocarcinoma patient samples with (n = 73) and without (n = 437) LKB1 mutation. d Representative images and corresponding quantification of IHC staining of ICAM1 in human LUAD tumor sections in LKB1 wild-type and mutated groups. Scale bar, 50 μm (40×). n = 11 (WT) or n = 7 (MUT) biologically independent samples examined over 1 independent experiment. **p = 0.0128. e Relative RPKM values of ICAM1 in LKB1 mutant versus LKB1 wild-type lung cancer cells from CCLE, with or without KRAS co-mutations. Mutant KRAS: n = 7 with mutant LKB1, n = 14 with WT LKB1. WT KRAS: n = 10 with mutant LKB1, n = 38 with WT LKB1. Middle line: median; box edges: 25th and 75th percentiles; whiskers: the upper and lower ends of the whiskers signify the maxima and minima, respectively. Most extreme points that do not exceed ± interquartile range × 1.5; further outliers are marked individually. **p = 0.0066, **p = 0.0011. f Immunoblot (IB) of the indicated proteins in lung cancer cells with LKB1-loss or LKB1-intact. n = 3 experiments. g, h A549 and H460 lung cancer cells were transfected with lentivirus expressing the indicated genes (Ctrl, LKB1-WT, and LKB1-Mut). ICAM1 expression was analyzed by immunoblot (g, n = 3 experiments.) and flow cytometry (h; left, representative images; right, quantification of results. n = 3 biologically independent samples examined over 1 independent experiment. ****p < 0.0001, ****p < 0.0001.) (Results are presented as mean ± SEM. One-way ANOVA followed by Tukey’s multiple comparisons test, two-tailed Student’s t-test or two-tailed Fisher’s exact test was used to analyze the data. **p < 0.01; ***p < 0.001; ****p < 0.0001. Source data are provided as a Source Data file.).
Fig. 3
Fig. 3. ICAM1 is important for the homing and activation of tumor-specific T cells in LKB1 deficient lung cancer.
a LLC1-OVA tumor cells (LLC1-control-Icam1WT-OVA; LLC1-shLkb1-Icam1WT-OVA; LLC1-shLkb1-Icam1OE-OVA) were implanted. Congenitally-marked (APC+) and stimulated CD8+ T cells expressing the OT-I were transferred on day 7 and analyzed on day 12. b Infiltration of OT-I CD8+ T cells (left) and expression of CD69 on OT-I cells (right) were analyzed by flow cytometry. For CD8+ T cells, n = 12, n = 12 and n = 13 in control-Icam1WT, shLkb1-Icam1WT and shLkb1-Icam1OE groups, respectively. ****p < 0.0001, ****p < 0.0001. For CD69, n = 12, n = 11 and n = 12 in control-Icam1WT, shLkb1-Icam1WT and shLkb1-Icam1OE groups, respectively. ***p = 0.0003. c Flow cytometry analysis of CD69 and PD-1 expression on activated T cells with or without co-culturing with LLC1 tumor cells (shLkb1-Icam1WT, shLkb1-Icam1OE) for 24 h. The E:T ratio (effector to target) was 1:1, 5:1, and 10:1 respectively. n = 3 biologically independent samples examined over 1 independent experiment. CD69, *p = 0.038, **p = 0.0012, ***p = 0.0009; PD-1, **p = 0.0036, ***p = 0.0007, ***p = 0.0009. d Flow cytometry analysis of CD69 expression on activated T cells co-culturing with LLC1 tumor cells (control-Icam1WT, n = 9; shLkb1-Icam1WT, n = 9; control-Icam1OE, n = 6; shLkb1-Icam1OE, n = 9) for 24 h. The E:T ratio (effector to target) was 10:1. ****p < 0.0001, ****p < 0.0001. e Flow cytometry analysis of CD69 and CD44 expression on activated T cells with co-culturing of LLC1 tumor cells (LLC1-shLkb1-Icam1OE), with or without LFA-1 antibody blockade therapy for 24 h. The E:T ratio (effector to target) was 10:1. n = 6 biologically independent samples examined over 1 independent experiment. ****p < 0.0001, ***p = 0.0006. f Correlation analysis of ICAM1 expression and cytolytic activity (CYT) patient samples (TCGA) with or without LKB1 mutations. LKB1 wild-type, n = 374 samples, p < 0.0001; LKB1 mutation, n = 68 samples, p = 0.257. g Correlation analysis of IHC staining with anti-CD8a and anti-ICAM1 antibodies on a tissue microarray (TMA) of lung adenocarcinoma patients (n = 152 TMA elements). p < 0.0001. h IHC of ICAM1 and CD8 expression in LKB1-WT and LKB1-mutant lung cancer patients. Scale bar, 20 μm (40×), 50 μm (20×). n = 11 (LKB1-WT) or n = 7 (LKB1-mutant) biologically independent samples examined over 1 independent experiment. (Results were presented as mean ± SEM. One-way ANOVA followed by Tukey’s multiple comparisons test or two-tailed Student’s t-test was used to analyze the data. ns, not significant; *p < 0.05; **p < 0.01; ***p < 0.001; ****p < 0.0001. Source data are provided as a Source Data file.).
Fig. 4
Fig. 4. ICAM1 overexpression reactivated the TME and sensitized anti-PD-1 immunotherapy in Lkb1 deficient lung tumors.
a Total CD8+ T cells relative to CD45+ cells in tumor tissue, relative mean fluorescence intensity (MFI) of CD69 and CD44 on CD8+ T cells, percentage of CD62L+CD44+ (central memory T cells) and CD62LCD44+ (effector memory T cells) in CD8+ T cells, and total NK cells relative to CD45+ cells in tumor tissue and relative MFI of CD69 on NK cells from mice bearing LLC1 tumors (LLC1-shControl-Icam1WT, LLC1-shLkb1-Icam1WT, LLC1-shLkb1-Icam1OE) were analyzed by flow cytometry. n = 1 independent experiment. CD8+ T-cell, n = 13 in shControl-Icam1WT, n = 8 in shLkb1-Icam1WT, n = 16 in shLkb1-Icam1OE; *p = 0.0193. CD69, n = 12 in shControl-Icam1WT, n = 6 in shLkb1-Icam1WT, n = 9 in shLkb1-Icam1OE; *p = 0.0436. CD44, n = 5 samples in each group. Effector memory, n = 5 samples in each group. Central memory, n = 5 in shControl-Icam1WT, n = 7 in shLkb1-Icam1WT, n = 6 in shLkb1-Icam1OE. NK cells, n = 7 in shControl-Icam1WT, n = 6 in shLkb1-Icam1WT, n = 5 in shLkb1-Icam1OE; *p = 0.0415. CD69, n = 10 in shControl-Icam1WT, n = 5 in shLkb1-Icam1WT, n = 7 in shLkb1-Icam1OE; *p = 0.0333. b LLC1-shLkb1-Icam1WT or LLC1-shLkb1-Icam1OE luc cells were injected into the left chest of mice and tumor formation was detected using a bioluminescence imager every week. Bioluminescent images in mice bearing lung tumors treated with isotype and anti-PD-1. c Quantification of bioluminescence results. n = 3 in Icam1WT receiving IgG, n = 5 in Icam1WT receiving anti-PD-1 Ab, n = 4 in Icam1OE receiving IgG, n = 5 in Icam1OE receiving anti-PD-1 Ab. *p = 0.0477. d C57BL/6 mice were subcutaneously inoculated with Lewis lung cancer cells with Lkb1 knockdown and stably Icam1 overexpression (Icam1OE) or its parental (Icam1WT) cell line. They were administered with different treatments (control immunoglobulin G (IgG), or anti-PD-1 Ab). Tumor size (left, n = 6 in Icam1WT receiving IgG, n = 5 in Icam1WT receiving anti-PD-1 Ab, n = 9 in Icam1OE receiving IgG, and n = 8 in Icam1OE receiving anti-PD-1 Ab. ***p = 0.0006.) and survival (right, n = 8 in Icam1WT receiving IgG, n = 6 in Icam1WT receiving anti-PD-1 Ab, n = 8 in Icam1OE receiving IgG, and n = 8 in Icam1OE receiving anti-PD-1 Ab. p = 0.0079) in different treatment arms were monitored. Kaplan–Meier curves of progression-free survival according to the expression level of ICAM1 in lung adenocarcinoma patients (e GSE126044 and GSE135222, n = 56 in total.) and melanoma patients (f GSE93157 and Liu et al., n = 46 in total.) following immune checkpoint inhibitor therapy. (Results are presented as mean ± SEM. Mixed-effects model followed by Tukey’s multiple comparison test or log-rank test was used to analyze the data. ns, not significant; *p < 0.05; ***p < 0.001. Source data are provided as a Source Data file.).
Fig. 5
Fig. 5. CDK4/6 inhibitors were carefully selected for LKB1 mutant lung cancer based on the mechanistic link between LKB1-RB-CDK4 interaction.
a Combined drug screening using drugs from both the Genomics of Drug Sensitivity in Cancer (GDSC) database based on sensitivity to LKB1 mutation and an FDA-approved immunology compound library. b Quantitative RT-qPCR of relative ICAM1 expression in A549 and H460 cells treated with 5 selected drugs (cyclophosphamide monohydrate; vinorelbine tartrate; vorinostat; rapamycin; palbociclib). n = 4 biologically independent samples examined over 1 independent experiment. ****p < 0.0001, ****p < 0.0001. A549 cells transfected with lentivirus expressing the indicated genes (LV-Ctrl, LV-LKB1-WT, LV-LKB1-Mut), treated ± 500 nM palbociclib were harvested for quantitative RT-qPCR (c) and flow cytometry analysis (d). n = 3 biologically independent samples examined over 1 independent experiment. ***p = 0.0002, ****p < 0.0001, ***p = 0.007 (c). n = 4 biologically independent samples examined over 1 independent experiment. *p = 0.023, *p = 0.0378 (d). e, f Impact of CDK4/6i on LKB1 mutant lung cell line profiles. e Expression of immune resistance program genes (columns) that were most differentially expressed in palbociclib-treated (green) versus control (pink) cell lines (rows). Expression is normalized in each cell line. f Immune resistance scores in cell lines (A549, H460, and H2030) treated with palbociclib (“Pal”) or with DMSO vehicle (“con”) (GSE110397). Middle line: median; box edges: 25th and 75th percentiles. n = 2 biologically independent samples. g A549 cells transfected with lentivirus expressing the indicated genes (LV-Ctrl, LV-LKB1-WT, LV-LKB1-Mut), treated ± 500 nM palbociclib, transfected ± siRB were harvested for immunoblot. n = 3 independent experiments. h Immunoprecipitation analysis of the interaction among LKB1, RB, and CDK4 performed in H1299 cells expressing intact LKB1. n = 3 independent experiments. i Immunoblot analysis of the indicated proteins performed in A549 or H460 cells expressing the indicated genes in plasmids. n = 3 independent experiments. j ChIP assay was performed with cell lysates from A549/vector, A549/LKB1-OE, A549/CDK4-OE and A549/vector-palbociclib cells. A pair of primers flanking the p65 binding site within the ICAM1 promoter were used in PCR. Real-time PCR was employed to the ChIP assay. n = 4 biologically independent samples examined over 1 independent experiment. **p = 0.0015, *p = 0.0249, ****p < 0.0001. (Results are presented as mean ± SEM. One-way ANOVA followed by Tukey’s multiple comparisons test or two-tailed Student’s t-test was used to analyze the data. *p < 0.05; **p < 0.01; ***p < 0.001. Source data are provided as a Source Data file.).
Fig. 6
Fig. 6. CDK4/6i sensitizes LKB1-deficient tumors to anti-PD-1 therapy.
a, b C57BL/6 mice were subcutaneously inoculated with Lewis lung cancer cells with Lkb1 knockdown (LLC1-shLkb1) and administered different treatments (control immunoglobulin G (Vehicle), palbociclib or anti-PD-1 Ab, or co-treatment with palbociclib and anti-PD-1 Ab). Tumor size (a, n = 7 for vehicle, n = 7 for palbociclib, n = 6 for anti-PD-1 Ab, n = 6 for combination. Two-way ANOVA followed by Tukey’s multiple comparisons test was performed to compare the tumor growth curves in different treatment groups, **p = 0.0022, ***p = 0.0003, ****p < 0.0001) and survival (b, n = 9 for vehicle, n = 12 for palbociclib, n = 9 for anti-PD-1 Ab, n = 8 for combination. Log-rank test was used to analyze the survival data, ****p < 0.0001, ****p < 0.0001, ****p < 0.0001) in different treatment arms were monitored. c Tumor volumes were measured beginning on day 7 and continuing every two days until day 21. d, e LLC1-shLkb1-luc cell line was constructed and injected into the left chest of mice. Tumor formation was detected. Mice harboring lung tumors were administered different treatments (control immunoglobulin G (Vehicle), palbociclib or anti-PD-1 Ab, or co-treatment with palbociclib and anti-PD-1 Ab). Representative bioluminescent images (d) and quantification of results (e). n = 4 biologically independent mice examined over 1 independent experiment. One-way ANOVA followed by Tukey’s multiple comparisons test was performed. **p = 0.0097. f, g Genetically engineered Kras-driven mouse model with conditional deletion of Lkb1 (KL GEMM) Representative MRI images (f) of KL GEMM lung tumors prior to treatment and after two weeks of treatment. n = 3, n = 3, n = 3 and n = 4 in vehicle, anti-PD-1 Ab, palbociclib and co-treatment groups, respectively. The contours of lung tumors were sketched. Waterfall plot (g) shows tumor volume response to the treatment. Each column represents one mouse. One-way ANOVA followed by Tukey’s multiple comparisons test was performed. *p = 0.0312. (Results are presented as mean ± SEM. A mixed-effects model followed by Tukey’s multiple comparisons was performed to compare the tumor growth curves in different treatment groups. Log-rank test was used to analyze the survival data. ns, not significant; *p < 0.05; **p < 0.01; ***p < 0.001; ****p < 0.0001. Source data are provided as a Source Data file.).
Fig. 7
Fig. 7. Using CDK4/6 inhibitor and anti-PD-1 antibody triggers an active tumor immune microenvironment.
ac RNA-sequencing of murine tumor specimens after receiving different treatments was performed and analyzed. a Heatmap of stimulatory Immunomodulators (IMs) and inhibitory IM in different treatment arms (n = 3 samples in each groups). b Murine Microenvironment Cell Population counter (mMCPcounter) analysis of immune cell infiltration level in different treatment arms (n = 3 samples in each groups). c Cell–cell interactions by calculating the scores of communication signatures in different cell types across different treatment arms (n = 2 samples in each groups). d Total CD8+ T cells relative to cells in tumor tissue (left), MFI of IFN-γ in CD8+ T cells (middle), and MFI of PD-1 in CD8+ T cells (right) from mice bearing LLC1-shLkb1 tumors receiving the indicated treatments. For CD8+ T cells, n = 8 samples in each group; **p = 0.0016, **p = 0.0025, ***p = 0.0003. For IFN-γ, n = 6 (vehicle), n = 8 (palbociclib), n = 7 (anti-PD-1 Ab), and n = 7 (combination), respectively; *p = 0.0165, **p = 0.0027, **p = 0.0099. For PD-1, n = 7 samples in each group; *p = 0.0422, **p = 0.0081. e Total NK cells relative to cells in tumor tissue (left, n = 7 samples in each group) and MFI of CD107a in NK cells (right, n = 7 in vehicle, n = 9 in palbociclib, n = 6 in anti-PD-1 Ab and n = 8 in combination group) from mice bearing LLC1-shLkb1 tumors receiving the indicated treatments. NK cells, *p = 0.019, **p = 0.0052. CD107a, *p = 0.0351. f MFI of ICAM1 in tumor cells (middle, n = 10) and MFI of PD-L1 in tumor cells (right, n = 10) from mice bearing LLC1/shLkb1 tumors receiving the indicated treatments. ICAM1, *p = 0.0119, **p = 0.0039. PD-L1, *p = 0.0399. (Results are presented as mean ± SEM. One-way ANOVA followed by Tukey’s multiple comparisons test was used to analyze the data. ns, not significant; *p < 0.05; **p < 0.01; ***p < 0.001; ****p < 0.0001. Source data are provided as a Source Data file.).
Fig. 8
Fig. 8. In situ analyses and blocking treatment unveiled mechanism of synergistic effect of combined CDK4/6-PD-1 targeting therapy.
a IHC staining using anti-pRB, anti-ICAM1, and anti-CD8a antibodies on resected mouse samples following different arms of treatment in subcutaneous tumor models. n = 5 biologically independent mice examined over 1 independent experiment. b IHC staining using anti-ICAM1, and anti-CD8a antibodies on resected mouse samples following vehicle and combination treatment in GEMM KL models. Scale bar, 200 μm. n = 5 biologically independent mice examined over 1 independent experiment. c Immunofluorescence (IF) analysis of ICAM1+cells (green), CD8+ T cells (red) in resected KL GEMM samples (upper) and orthotopic mouse models (underneath) following different arms of treatment. Scale bar, 100 μm. n = 5 biologically independent mice examined over 1 independent experiment. d Lysates of mouse lung tumor tissues having received different treatments (vehicle, palbociclib, anti-PD-1 Ab, or combination of palbociclib with anti-PD-1 Ab) were mixed with a cocktail of biotinylated detection antibodies, and then incubated with the Mouse Cytokine Array. Array images were detected using X-ray films. n = 1 experiment with n = 3 mice. e, f C57BL/6 mice were inoculated with LLC1-shLkb1 cells and received the indicated depletion treatments (CD8-depleted, NK1.1-depleted, or ICAM1-depleted treatment). Tumor size (e n = 9 for vehicle, n = 10 for combination, n = 8 for ICAM1-depleted, n = 6 for CD8-depleted, and n = 7 for NK1.1-depleted. ****p < 0.0001, ***p = 0.0009, **p = 0.0069, *p = 0.0113.) and survival (f n = 8 for vehicle, n = 7 for combination, n = 10 for ICAM1-depleted, n = 6 for CD8-depleted, and n = 6 for NK1.1-depleted. ***p = 0.0003, **p = 0.0018, **p = 0.0059, *p = 0.0108.) were monitored. g C57BL/6 mice were inoculated with LLC1/shLkb1 with or without Icam1 knockout cells and received the combination treatments versus vehicle. Tumor size were monitored. n = 5, n = 7, n = 7, and n = 6, respectively. **p = 0.0053. h Total CD8+ T cells relative to CD45+ cells in tumor tissue, relative MFI of CD44 on CD8+ T cells from mice bearing LLC1-shLkb1 tumors with or without Icam1 knockout and receiving the indicated treatments were analyzed by flow cytometry. CD8+ T cells, n = 15 for sgCon with CDKi treatment, n = 9 for sgIcam1 with CDKi treatment, n = 18 for sgCon with combination treatment, and n = 12 for sgIcam1 with combination treatment; **p = 0.0095. CD44, n = 9 for sgCon with CDKi treatment, n = 12 for sgIcam1 with CDKi treatment, n = 9 for sgCon with combination treatment, n = 9 for sgIcam1 with combination treatment; **p = 0.0015. (Results are presented as mean ± SEM. A mixed-effects model followed by Tukey’s multiple comparisons was performed to compare the tumor growth curves in different treatment groups. Log-rank test was used to analyze the survival data. One-way ANOVA followed by Tukey’s multiple comparisons test was used to analyze the flow cytometry data. n.s., not significant; *p < 0.05; **p < 0.01; ***p < 0.001; ****p < 0.0001. Source data are provided as a Source Data file.).

References

    1. Borghaei H, et al. Nivolumab versus docetaxel in advanced nonsquamous non-small-cell lung cancer. N. Engl. J. Med. 2015;373:1627–1639. doi: 10.1056/NEJMoa1507643. - DOI - PMC - PubMed
    1. Brahmer J, et al. Nivolumab versus docetaxel in advanced squamous-cell non-small-cell lung cancer. N. Engl. J. Med. 2015;373:123–135. doi: 10.1056/NEJMoa1504627. - DOI - PMC - PubMed
    1. Reck M, et al. Pembrolizumab versus chemotherapy for PD-L1-positive non-small-cell lung cancer. N. Engl. J. Med. 2016;375:1823–1833. doi: 10.1056/NEJMoa1606774. - DOI - PubMed
    1. Socinski MA, et al. Atezolizumab for first-line treatment of metastatic nonsquamous NSCLC. N. Engl. J. Med. 2018;378:2288–2301. doi: 10.1056/NEJMoa1716948. - DOI - PubMed
    1. Gandhi L, et al. Pembrolizumab plus chemotherapy in metastatic non-small-cell lung cancer. N. Engl. J. Med. 2018;378:2078–2092. doi: 10.1056/NEJMoa1801005. - DOI - PubMed

Publication types

Substances