. 2023 Mar 4;13(1):3666.
doi: 10.1038/s41598-023-30675-z.

Denser forests across the USA experience more damage from insects and pathogens

Affiliations

Denser forests across the USA experience more damage from insects and pathogens

Christopher Asaro et al. Sci Rep. .

Abstract

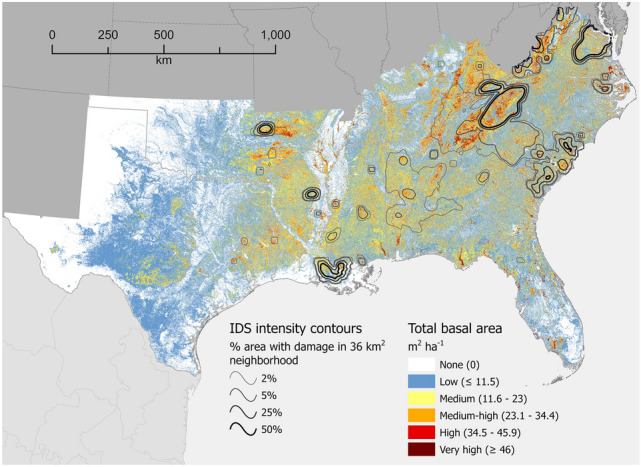
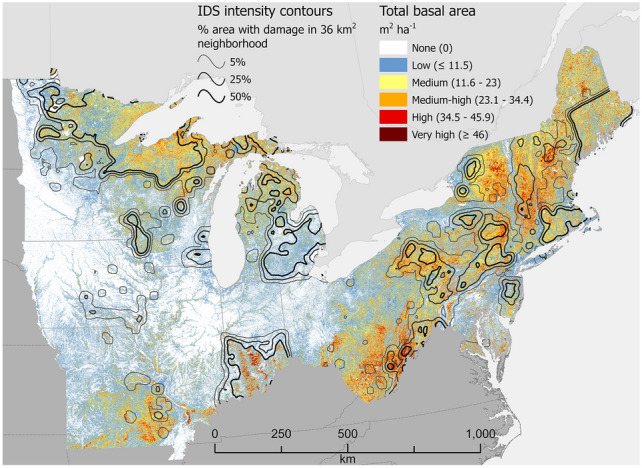
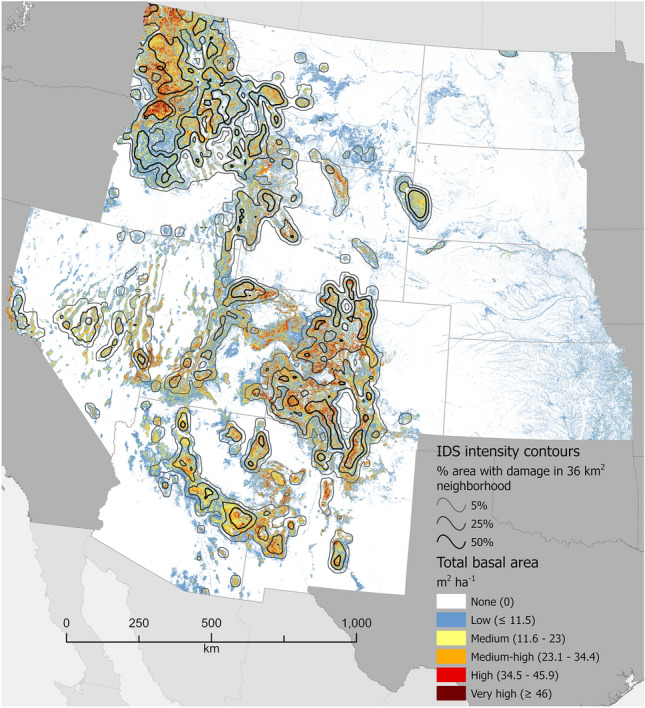
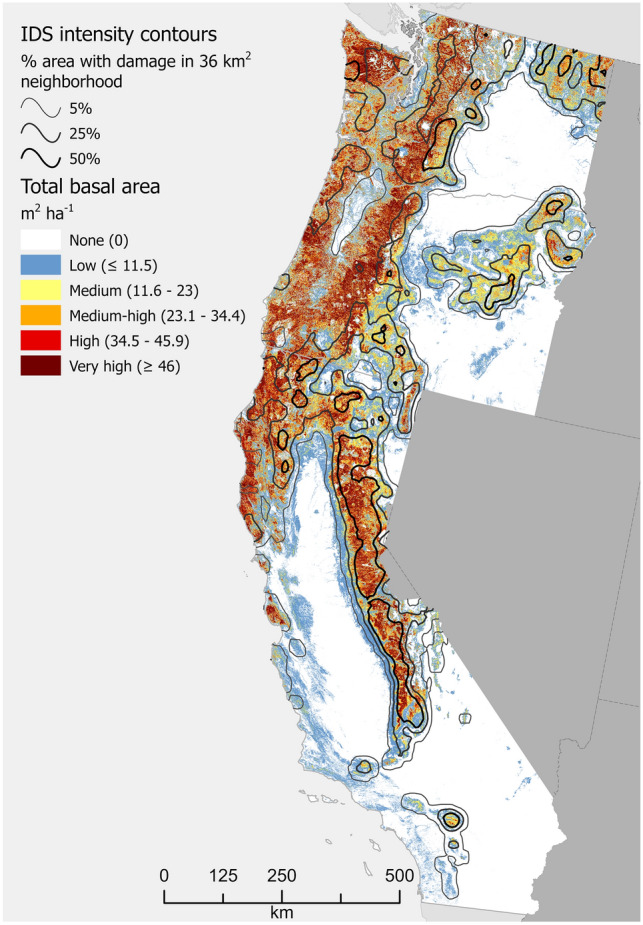
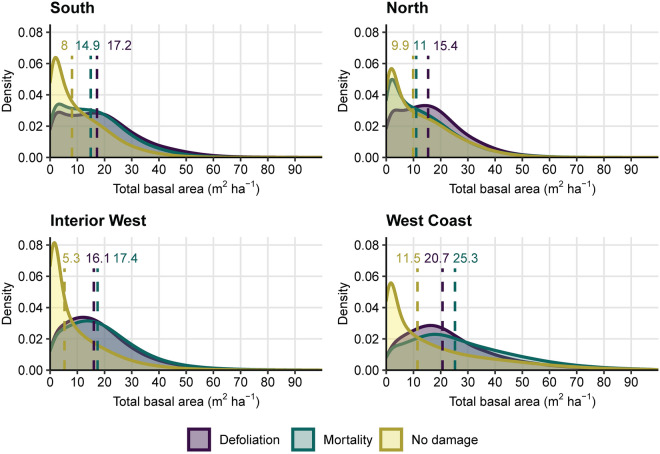
Forests across much of the United States are becoming denser. Trees growing in denser stands experience more competition for essential resources, which can make them more vulnerable to disturbances. Forest density can be expressed in terms of basal area, a metric that has been used to assess vulnerability of some forests to damage by certain insects or pathogens. A raster map of total tree basal area (TBA) for the conterminous United States was compared with annual (2000-2019) survey maps of forest damage due to insects and pathogens. Across each of four regions, median TBA was significantly higher within forest areas defoliated or killed by insects or pathogens than in areas without recorded damage. Therefore, TBA may serve as a regional-scale indicator of forest health and a first filter for identifying areas that merit finer-scale analysis of forest conditions.


Conflict of interest statement

The authors declare no competing interests.

Figures

Figure 1
Figure 1
Total basal area (TBA), m2 ha−1, of forestland across the South region of the conterminous USA. Values represent averages across 240-m resolution map cells. Many cells contain areas of non-forest, which causes their values to be lower than TBA values typical of the constituent forest stands. Cells with a complete lack of tree cover are shown in white. Contour intervals depict relative concentrations of forest damage (defoliation or mortality) as recorded in Insect and Disease Survey (IDS) data. For example, the 50% contour line defines places where at least half of the area within a 36 km2 neighborhood experienced damage at least once during the analytical period, 2000–2019. See “Methods” for analytical details. Map created using Esri ArcGIS Pro 2.9.5, https://www.esri.com/en-us/arcgis/products/arcgis-pro/overview.
Figure 2
Figure 2
Total basal area (TBA), m2 ha−1, of forestland across the North region of the conterminous USA. Values represent averages across 240-m resolution map cells. Many cells contain areas of non-forest, which causes their values to be lower than TBA values typical of the constituent forest stands. Cells with a complete lack of tree cover are shown in white. Contour intervals depict relative concentrations of forest damage (defoliation or mortality) as recorded in Insect and Disease Survey (IDS) data. For example, the 50% contour line defines places where at least half of the area within a 36 km2 neighborhood experienced damage at least once during the analytical period, 2000–2019. See “Methods” for analytical details. Map created using Esri ArcGIS Pro 2.9.5, https://www.esri.com/en-us/arcgis/products/arcgis-pro/overview.
Figure 3
Figure 3
Total basal area (TBA), m2 ha−1, of forestland across the Interior West region of the conterminous USA. Values represent averages across 240-m resolution map cells. Many cells contain areas of non-forest, which causes their values to be lower than TBA values typical of the constituent forest stands. Cells with a complete lack of tree cover are shown in white. Contour intervals depict relative concentrations of forest damage (defoliation or mortality) as recorded in Insect and Disease Survey (IDS) data. For example, the 50% contour line defines places where at least half of the area within a 36 km2 neighborhood experienced damage at least once during the analytical period, 2000–2019. See “Methods” for analytical details. Map created using Esri ArcGIS Pro 2.9.5, https://www.esri.com/en-us/arcgis/products/arcgis-pro/overview.
Figure 4
Figure 4
Total basal area (TBA), m2 ha−1, of forestland across the West Coast region of the conterminous USA. Values represent averages across 240-m resolution map cells. Many cells contain areas of non-forest, which causes their values to be lower than TBA values typical of the constituent forest stands. Cells with a complete lack of tree cover are shown in white. Contour intervals depict relative concentrations of forest damage (defoliation or mortality) as recorded in Insect and Disease Survey (IDS) data. For example, the 50% contour line defines places where at least half of the area within a 36 km2 neighborhood experienced damage at least once during the analytical period, 2000–2019. See “Methods” for analytical details. Map created using Esri ArcGIS Pro 2.9.5, https://www.esri.com/en-us/arcgis/products/arcgis-pro/overview.
Figure 5
Figure 5
Probability density plots, by region. Shaded plots depict the distributions of total basal area (TBA) values for three groups of observations (map cells): Defoliation = all forested (i.e. TBA > 0) cells where defoliation was recorded at least once from Insect and Disease Survey (IDS) data in the analysis period, 2000–2019; Mortality = all forested cells where mortality was recorded at least once in the period; No damage = all forested cells where neither defoliation nor mortality was recorded during the period. Median TBA values for the three groups are indicated by vertical dotted lines, each of which is labeled in the corresponding color.

References

    1. Teale SA, Castello JD. The past as key to the future: a new perspective on forest health. In: Castello JD, Teale SA, editors. Forest Health: An Integrated Perspective. Cambridge University Press; 2011. pp. 3–16.
    1. Jactel H, Koricheva J, Castagneyrol B. Responses of forest insect pests to climate change: Not so simple. Curr. Opin. Insect Sci. 2019;35:103–108. doi: 10.1016/j.cois.2019.07.010. - DOI - PubMed
    1. Trumbore S, Brando P, Hartmann H. Forest health and global change. Science. 2015;349:814–818. doi: 10.1126/science.aac6759. - DOI - PubMed
    1. North MP, et al. Operational resilience in western US frequent-fire forests. For. Ecol. Manag. 2022;507:120004. doi: 10.1016/j.foreco.2021.120004. - DOI
    1. Raffa KF, et al. A literal use of “forest health” safeguards against misuse and misapplication. J. For. 2009;107:276–277.

Publication types