. 2023 May;35(21):e2205709.
doi: 10.1002/adma.202205709. Epub 2023 Mar 31.

Lipid Deposition Profiles Influence Foreign Body Responses

Affiliations

Lipid Deposition Profiles Influence Foreign Body Responses

Christian C Schreib et al. Adv Mater. 2023 May.

Abstract

Fibrosis remains a significant cause of failure in implanted biomedical devices and early absorption of proteins on implant surfaces has been shown to be a key instigating factor. However, lipids can also regulate immune activity and their presence may also contribute to biomaterial-induced foreign body responses (FBR) and fibrosis. Here it is demonstrated that the surface presentation of lipids on implant affects FBR by influencing reactions of immune cells to materials as well as their resultant inflammatory/suppressive polarization. Time-of-flight secondary ion mass spectroscopy (ToF-SIMS) is employed to characterize lipid deposition on implants that are surface-modified chemically with immunomodulatory small molecules. Multiple immunosuppressive phospholipids (phosphatidylcholine, phosphatidylinositol, phosphatidylethanolamine, and sphingomyelin) are all found to deposit preferentially on implants with anti-FBR surface modifications in mice. Significantly, a set of 11 fatty acids is enriched on unmodified implanted devices that failed in both mice and humans, highlighting relevance across species. Phospholipid deposition is also found to upregulate the transcription of anti-inflammatory genes in murine macrophages, while fatty acid deposition stimulated the expression of pro-inflammatory genes. These results provide further insights into how to improve the design of biomaterials and medical devices to mitigate biomaterial material-induced FBR and fibrosis.

Keywords: biomaterials; foreign body responses; immune responses; lipids; medical devices; surface analyses; tof-sims.


Conflict of interest statement

Conflicts of interest

C. Schreib, O. Veiseh, and S. Mukherjee declare interests via a patent filed by Rice University by the technologies developed in this manuscript. O. Veiseh declares conflict of interest through equity stake and is a paid consultant of Sigilon Therapeutics. The authors declare that they have no other competing interests.

Figures

Figure 1
Figure 1. Fabrication and characterization of immunogenic and immune-evasive PDMS disks.
(a) Chemical structures of the different small molecules used for surface functionalization. (b) Carpet plots of the spatial distribution of CN ion on the functionalized surface via SIMS Image Analysis. These ions are indicative of the Z2-Y12A, Z2-Y12, and Z1-Y15 small molecule surface functionalization. Area presented in 300 μm x 300 μm. (c) Disks were removed at 28 days post-implantation and imaged using a stereoscope microscope to detect gross levels of fibrosis. Each replicate came from a different mouse (n=5). Scale bar represents 5 mm. (d) Histology of tissue around 28-day implants. Arrow highlights where the tissue interfaced with the implanted PDMS. Scale bar represents 1 mm.
Figure 2.
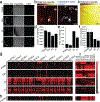
Figure 2.. Specific lipids deposit on implant surfaces depending on the materials’ immunogenicity
(a) Post-explant images of PDMS disks after being implanted in mice for 24 hours. Whole disk images were taken on a stereoscope, transmitted and DAPI-stained images were taken on a confocal microscope. Z2A, Z2, and Z1 stand for PDMS functionalized with those molecules Z2-Y12A, Z2-Y12, and Z1-Y15, respectively. Scale bar in whole disk images represents 1 mm, scale bar in transmitted and DAPI stained images represent 200 μm (b) ToF-SIMS images of a select region of a PDMS explanted disk containing cells. Red highlights total ion intensity, blue highlights the sum of ions associated with lipids in the membranes of cells (C3H4NO2, C2H4NO, C7H17, C12H21, C13H25, C15H27), green highlights the sum of ions associated with the amino acid alanine (C2HN, C2H2N, C2H4N, C2H2NO2, C3H6NO2). ECV stands to extracellular vesicle. Scale bar represents 50 μm. (c) ToF-SIMS images of a select region of a PDMS explanted disk without cells. Red highlights total ion intensity. Scale bar represents 50 μm. (d-f) Comparison of ion intensities associated with proteins (d, C2H6N), phospholipids (e, PO2), and fatty acids (f, C3H6O2) on the PDMS disks implanted for 24 hours. Each replicate from a condition came from a different mouse (n=4). Ion intensities are normalized to total ion intensity of the spectrum they are from. Bar graphs represent mean ± SD. (g) Heatmap of specific lipid species identified from the ToF-SIMS standard library identified on PDMS, PDMS-Z2-Y12A, PDMS-Z2-Y12, and PDMS-Z1-Y15 disks. Rows represent replicates, each replicate in a condition came from a different mouse (n=6). Columns represent ions associated with lipids, grouped by the lipids they are associated with. The ion that each column represents can be found in Supplementary Tables 1 and 2. Colors are scaled across columns with max value set to 1 and min value set to 0. Phospholipids were identified from ToF-SIMS reference spectra, fatty acids were identified from LIPID MAPS. (h) Lipids found on human IP catheters that were explanted from patients due to failure from fibrosis. Each row represents a catheter from a different human. Color scale used is the same from Figure 1g. Acronyms used are as follows: PDMS-Z2-Y12 (Z2), PDMS-Z2-Y12A (Z2A), PDMS-Z1-Y15 (Z1), phosphatidylinositol (PI), phosphatidylethanolamine (PE), phosphatidylcholine (PC), sphingomyelin (SM), and fatty acid (FA). Specific species that each column is associated with can be found in Supplementary Tables 1.
Figure 3.
Figure 3.. Immune cells localized to 2-week implants display similar transcriptome differences observed to be caused by lipids ex vivo
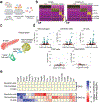
(a) Schematic of single-cell RNA sequencing (scRNA-seq) study performed. PDMS and PDMS-Z2-Y12 disks were implanted into the IP space of mice for 2 weeks. Cells localized to the implant were extracted and used to scRNA-seq (b) Single cell transcriptome profiles clustered into groups by k-means clustering for cell identification. T/NK refer to T and natural killer cells, D to dendritic cells, and N to neutrophils. (c) UMAP visualization of cells localized to PDMS and PDMS-Z2-Y12 pooled together. Cell type of clusters are determined by expression of cell-specific markers. (d) Volcano plots showing changes in gene expression of the identified cell types in the PDMS and PDMS-Z2-Y12 samples. (e) Heatmap showing relative expression of various cytokines across the different cell types. A full list can be found at Supplementary Fig. 7.
Figure 4.
Figure 4.. Lipids modulate the RNA profile in macrophages cultured on PDMS ex vivo.
(a) Confocal images of macrophages cultured on PDMS and PDMS-Z2-Y12 stained with NucBlue (blue) and vinculin antibodies (green). Scale bar represents 25 μm. (b) Heatmap comparing transcript levels of select genes from RNAseq of macrophages cultured in the listed conditions. Rows represent biological replicates (n=3), columns represent different transcripts. Heatmap normalized by column with z-score. (c) Transcript level comparison plots of Arg1, Il1rn, Fcer2a and Fos from RNA-seq of macrophages cultured in the listed conditions.
Figure 5.
Figure 5.. Phosphatidylinositol, phosphatidylethanolamine, phosphatidylcholine, and sphingomyelin follow the same deposition pattern on different implant locations.
(a) CAD of PDMS implant used in the brain studies. (b) Histology (H&E staining) of the brain tissue. Note that the semi-linear streak seen in the PDMS image represents an organized clot that formed due to slight bleeding at the pial surface when the implant was withdrawn, just prior to placing the brain in fixative. c) Immunohistochemistry further defines the CNS foreign body responses with nuclei labeled in blue (DAPI), microglia/macrophages labeled in red (CD68), and astrocytes label in green (GFAP). (d) Heatmap of specific lipid species identified from the ToF-SIMS standard library (phospholipids) and LIPID MAPS (fatty acids) identified on PDMS, PDMS-Z1-Y15, and PDMS-Z2-Y12 pillars implanted in mice brains space for 2 weeks. Rows represent replicates, each from a different mouse (n=4). Columns represent ions associated with lipids, grouped by the lipids they are associated with. The ion that each column represents can be found in Supplementary Tables 1 and 2. Colors are scaled across columns with max value set to 1 and min value set to 0. Acronyms used are as follows: PDMS-Z1-Y15 (Z1), PDMS-Z2-Y12 (Z2), phosphatidylinositol (PI), phosphatidylethanolamine (PE), phosphatidylcholine (PC), sphingomyelin (SM), and fatty acid (FA).
Figure 6.
Figure 6.. Phosphatidylinositol, phosphatidylethanolamine, phosphatidylcholine, sphingomyelin and fatty acids follow the same deposition pattern on different materials.
(a) Histology of tissue around PTFE implants in the subcutaneous space for 28-days. Scale bar represents 100 μm. (b) Quantification of thickness of fibrotic capsule that formed on the PTFE subcutaneous implants after 28 days (n=3). Bar graph represents mean ± SD. (c) Heatmap of specific lipid species identified from the ToF-SIMS standard library (phospholipids) and LIPID MAPS (fatty acids) on PTFE and PTFE-Z2-Y12 disks implanted in the subcutaneous space for 24 hours. Rows represent replicates. Each replicate in a condition came from a different mouse (n=5). Columns represent ions associated with lipids, grouped by the lipids they are associated with. The ion that each column represents can be found in Supplementary Tables 1 and 2. Colors are scaled across columns with max value set to 1 and min value set to 0. Acronyms used are as follows: PTFE-Z2-Y12 (Z2), phosphatidylinositol (PI), phosphatidylethanolamine (PE), phosphatidylcholine (PC), sphingomyelin (SM), and fatty acid (FA).

References

    1. McKeen LW, in Handbook of Polymer Applications in Medicine and Medical Devices, Elsevier Inc., 2014, pp. 21–53.
    1. Saini M, World J Clin Cases 2015, 3, 52. - PMC - PubMed
    1. Rolfe B, Mooney J, Zhang B, Jahnke S, Le S-J, Chau Y-Q, Huang Q, Wang H, Campbell G, Campbell J, Regenerative Medicine and Tissue Engineering - Cells and Biomaterials 2011, DOI 10.5772/21790. - DOI
    1. Someya T, Bao Z, Malliaras GG, Nature 2016, 540, 379. - PubMed
    1. Foggia MJ, Quevedo RV, Hansen MR, Laryngoscope Investig Otolaryngol 2019, 4, 678. - PMC - PubMed