. 2023 Jun;164(7):1137-1151.e15.
doi: 10.1053/j.gastro.2023.02.030. Epub 2023 Mar 4.

Stiffness Restricts the Stemness of the Intestinal Stem Cells and Skews Their Differentiation Toward Goblet Cells

Affiliations

Stiffness Restricts the Stemness of the Intestinal Stem Cells and Skews Their Differentiation Toward Goblet Cells

Shijie He et al. Gastroenterology. 2023 Jun.

Abstract

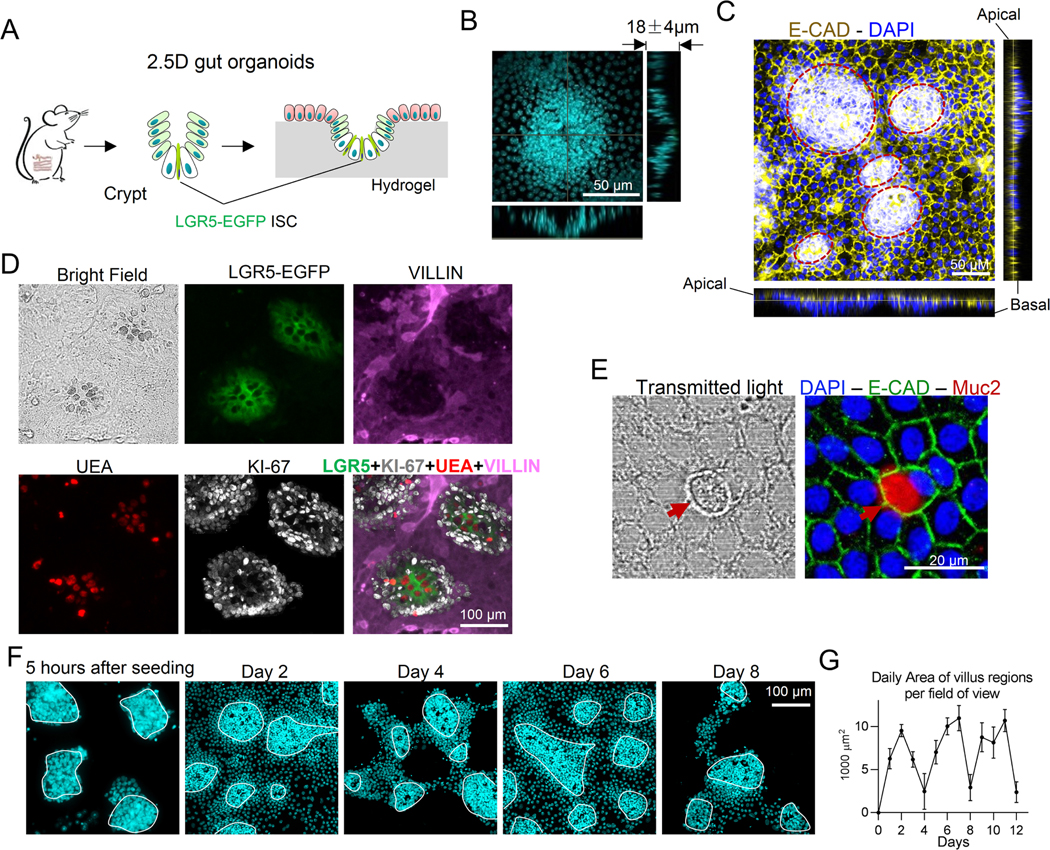
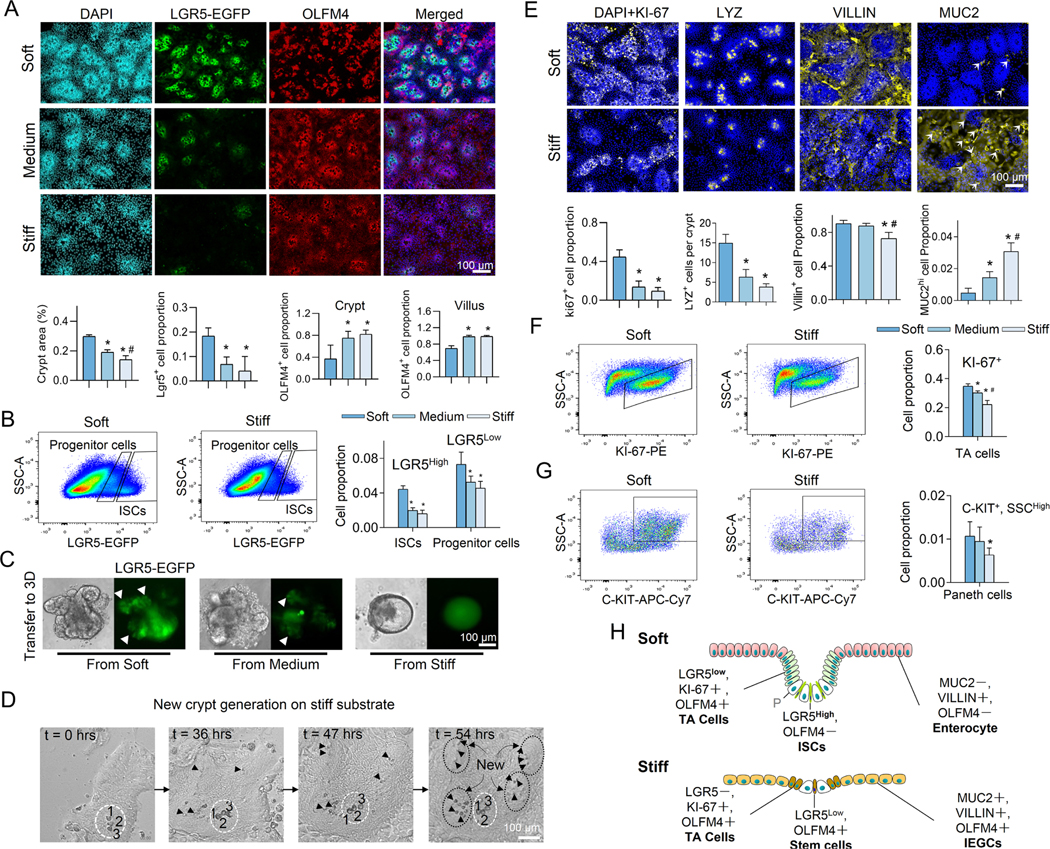
Background & aims: Fibrosis and tissue stiffening are hallmarks of inflammatory bowel disease (IBD). We have hypothesized that the increased stiffness directly contributes to the dysregulation of the epithelial cell homeostasis in IBD. Here, we aim to determine the impact of tissue stiffening on the fate and function of the intestinal stem cells (ISCs).

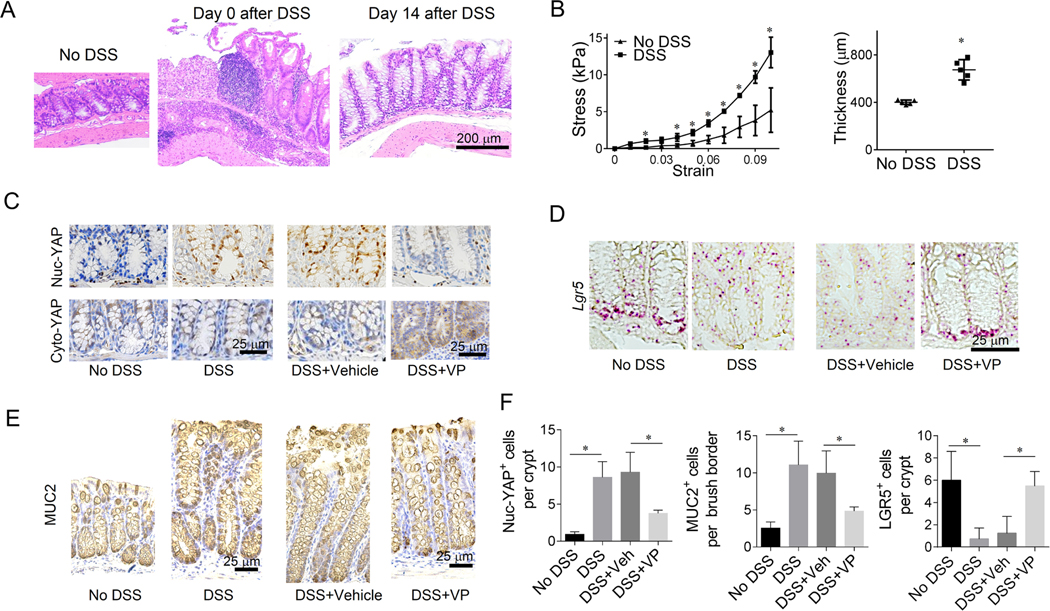
Methods: We developed a long-term culture system consisting of 2.5-dimensional intestinal organoids grown on a hydrogel matrix with tunable stiffness. Single-cell RNA sequencing provided stiffness-regulated transcriptional signatures of the ISCs and their differentiated progeny. YAP-knockout and YAP-overexpression mice were used to manipulate YAP expression. In addition, we analyzed colon samples from murine colitis models and human IBD samples to assess the impact of stiffness on ISCs in vivo.

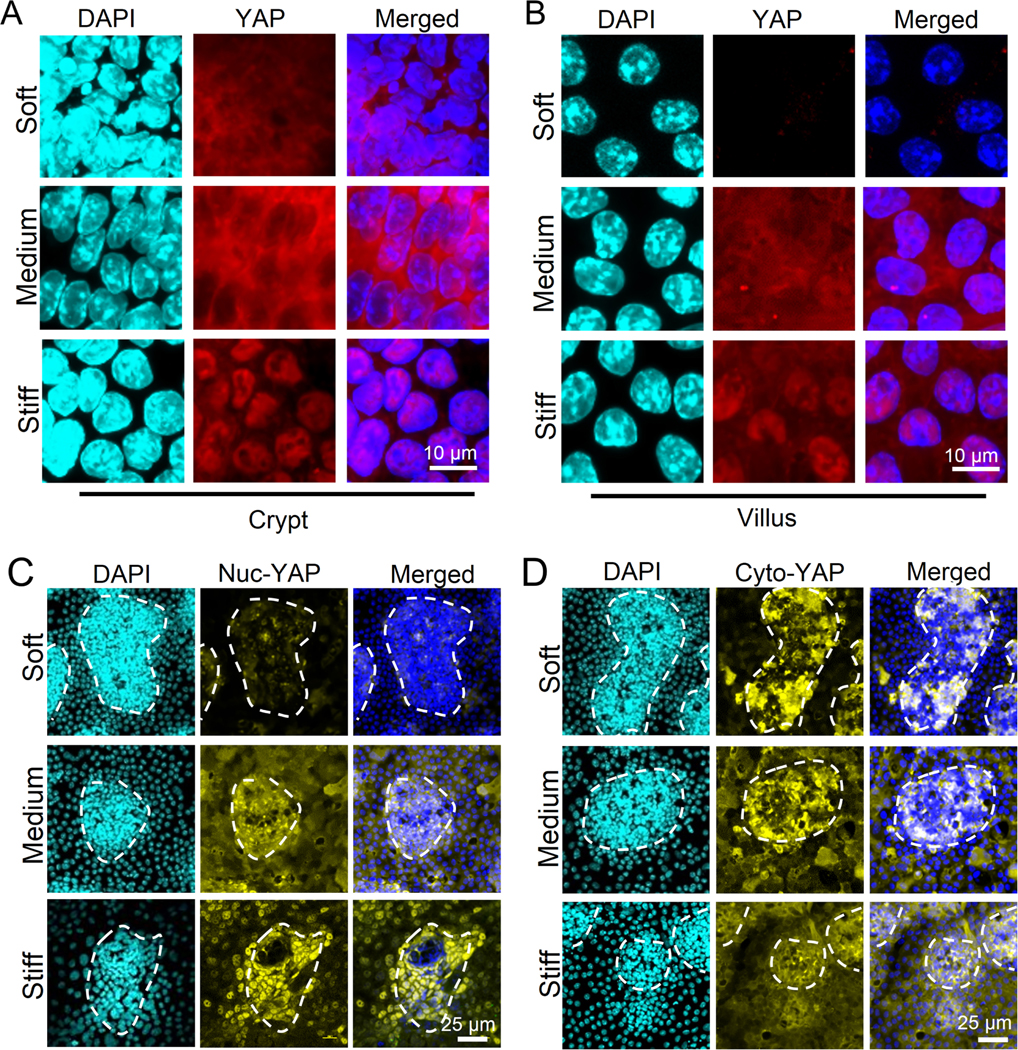
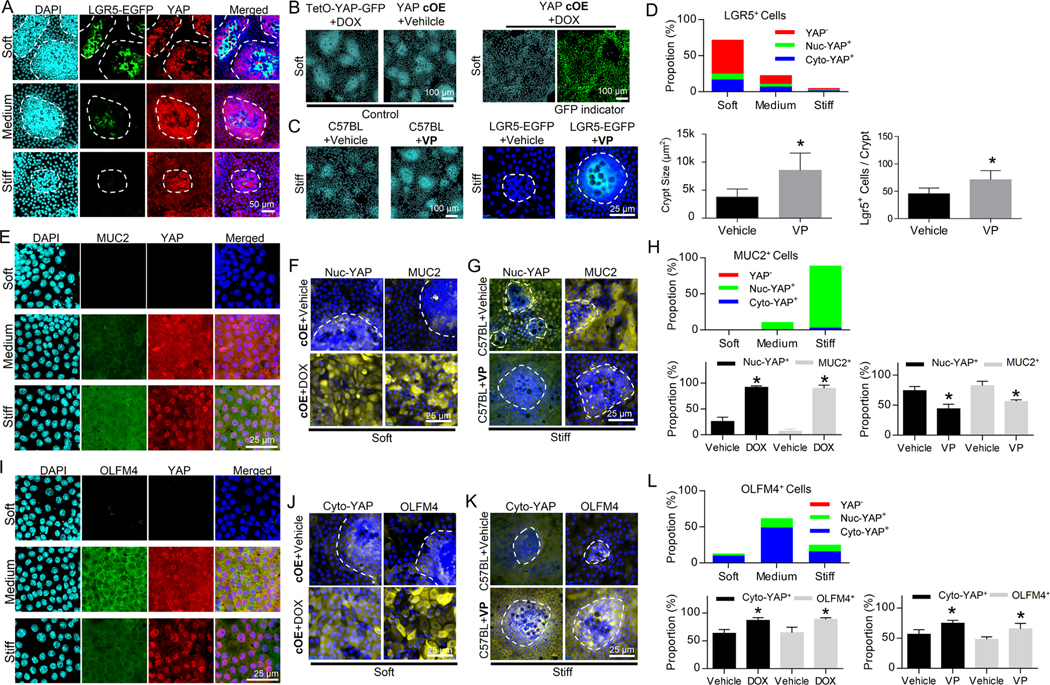
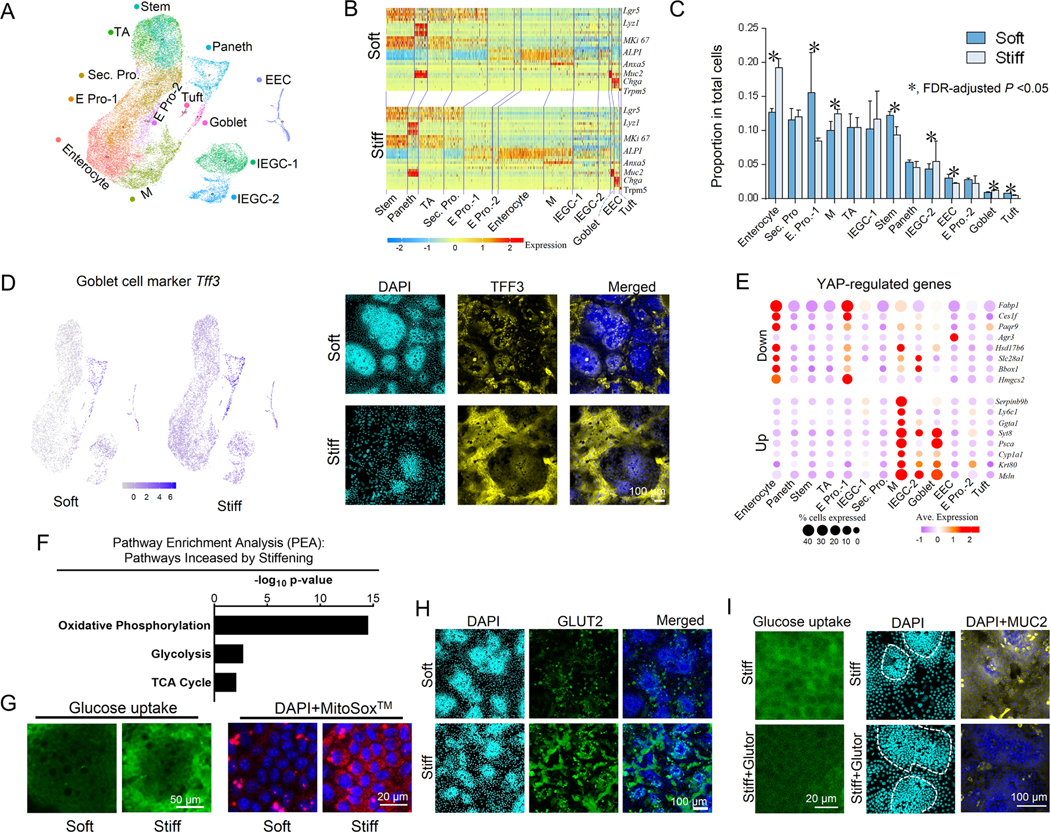
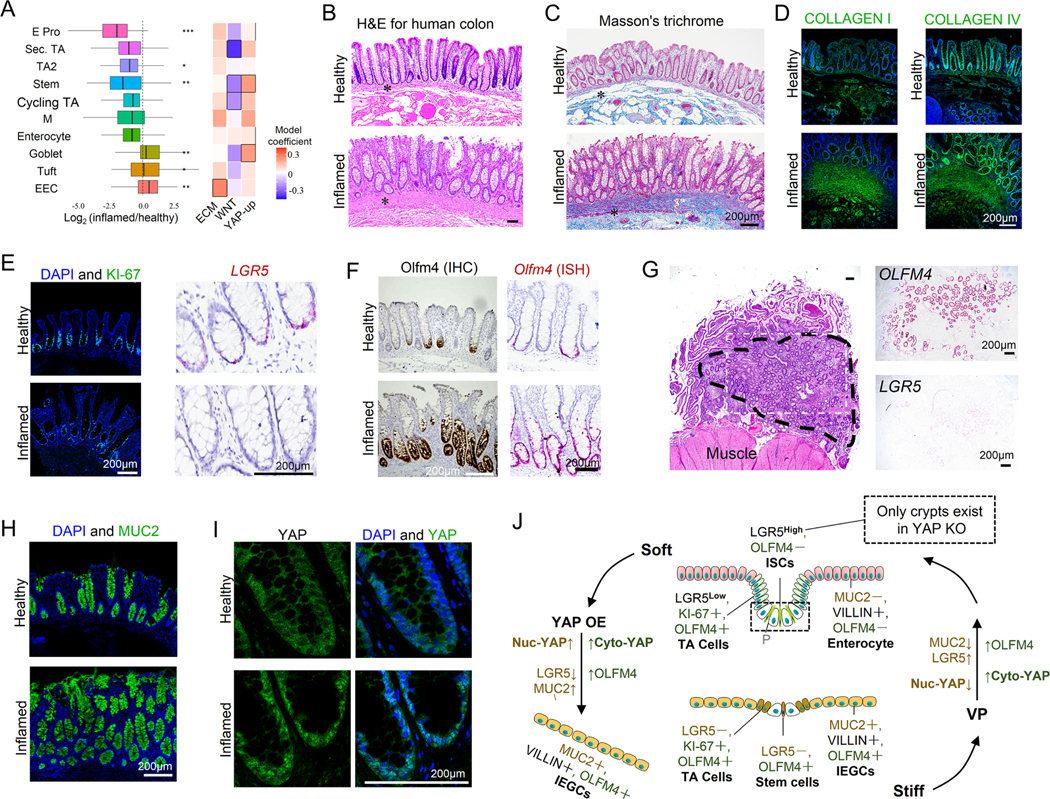
Results: We demonstrated that increasing the stiffness potently reduced the population of LGR5+ ISCs and KI-67+-proliferating cells. Conversely, cells expressing the stem cell marker, olfactomedin-4, became dominant in the crypt-like compartments and pervaded the villus-like regions. Concomitantly, stiffening prompted the ISCs to preferentially differentiate toward goblet cells. Mechanistically, stiffening increased the expression of cytosolic YAP, driving the extension of olfactomedin-4+ cells into the villus-like regions, while it induced the nuclear translocation of YAP, leading to preferential differentiation of ISCs toward goblet cells. Furthermore, analysis of colon samples from murine colitis models and patients with IBD demonstrated cellular and molecular remodeling reminiscent of those observed in vitro.

Conclusions: Collectively, our findings highlight that matrix stiffness potently regulates the stemness of ISCs and their differentiation trajectory, supporting the hypothesis that fibrosis-induced gut stiffening plays a direct role in epithelial remodeling in IBD.

Keywords: Fibrosis; IBD; Intestinal Organoids; Intestinal Stem Cells; Stiffening.


Figures

Figure 1.
Figure 1.. 2.5D gut organoids cultured on soft hydrogel matrices.
(A) Illustration of the experimental system. (B) Orthogonal projection of DAPI staining showing the invagination of crypt-like region with dense nuclei. Scale bar, 50 μm. (C) Orthogonal projection of E-cadherin staining showing a concentrated expression at the apical surfaces (n=3). The red dashed lines indicate crypt regions. Scale bar, 50 μm. (D) LGR5-EGFP+ ISCs were intermixed with the optically dark and UEA+ Paneth cells, which were surrounded by KI-67+ TA cells in the crypt-like regions. The villus-like regions were populated by villin+ differentiated cells (n=3). Scale bar, 100 μm. (E) The confocal transmitted light image showed distinguishable morphology of MUC2+ goblet cells (n=3). Scale bar, 20 μm. (F) DAPI staining showed that the villus-like regions exhibited a turnover rate of 3–4 days (n=5). The white contour lines indicate the crypt regions. Scale bar, 100 μm. (G) The area of villus regions was quantified daily. The error bars denote standard deviation.
Figure 2.
Figure 2.. Stiffness determines the fate of ISCs.
(A) Increasing the matrix stiffness from soft (0.6kPa) to medium (2.4kPa) to stiff (9.6kPa) reduced the size of the crypt-like regions with dense nuclei and decreased the expression of LGR5. Stiffening also extended the OLFM4+ cells into villus-like regions. Scale bar, 100 μm. The crypt surface area was quantified as a proportion of total area, the number of LGR5+ cells as a proportion of total cells, and the number of OLFM4+ cells as a proportion of total cells in the crypt regions and in the villus regions. (n=3–5). (B) Flow cytometry analysis showed that stiffening decreased LGR5high ISCs and LGR5low progenitor cells (n=3). (C) The 3D organoids derived from the soft and medium matrix budded with LGR5-EGFP+ ISCs (white arrows). The 3D organoids derived from the stiff matrix grew more like LGR5-EGFP cysts (n=3). Scale bar, 100 μm. (D) Live-cell imaging demonstrates the generation of new crypts in the villus-like region of the stiff substrate (Movie S2). At t=0 hrs, only one crypt is visible (labeled with a white dashed ellipse) surrounded by the villus region. The large and optically dark Paneth cells (enumerated by 1, 2 and 3) are used as a point of reference. At t=36 hrs, new Paneth cells (marked by black arrows) appear within the villus region. At t=47 hrs, more Paneth cells are visible within newly formed crypts. At t=54 hrs, four new, fully formed crypts (labeled with black dashed ellipses) are visible. Scale bar, 100 μm. (E) Stiffening decreased the expression of KI-67, LYZ, and VILLIN, but increased MUC2 (n=3–5). Scale bar, 100 μm. KI-67+, and VILLIN+ cells, and MUC2high cells (indicated by arrows) were respectively quantified as their proportion of total cells. LYZ+ cells is quantified as cell number per crypt. Flow cytometry analysis showed that stiffening decreased KI-67+ TA cells (F, n=3) and Paneth cells (G, n=6). (H) Schematic summarizing the impact of stiffening on all cell types. ‘P’, Paneth cell. * vs. Soft and # vs. Medium, P<0.05 (One-way ANOVA analysis). The error bars denote standard deviation.
Figure 3.
Figure 3.. Influence of stiffness on YAP expression and sequestration in crypt-like and villus-like regions.
On the stiff gel, nuclear localization of YAP was shown on both crypt (A) and villus (B) regions. In villus regions, cyto-YAP expression was absent on the soft matrix and highly expressed on the medium matrix (B). (n=3). Scale bar in (A) and (B), 10 μm. (C) The non-phosphorylated nuclear (nuc-) YAP was increased by stiffening and showed clear nuclear localization on the stiff matrix (n=5). Scale bar, 25 μm. (D) The Ser 127 phosphorylated cytoplasmic (cyto-) YAP was decreased by stiffening in the crypt-like regions, but increased in the villus-like regions (n=5). Scale bar, 25 μm.
Figure. 4
Figure. 4. Stiffness regulates ISC fate via YAP. The fate of ISCs was manipulated via conditional YAP knockout (cKO), conditional YAP overexpression (cOE), and Verteporfin (VP).
(A) Lgr5-EGFP+ ISCs were YAP and disappeared when YAP expression was positive. The white dashed lines trace the crypt-like regions (n=3). Scale bar, 50 μm. (B) YAP cOE led to the loss of the crypt-like regions on the soft matrix. TetO-YAP-GFP cells with DOX and YAP cOE cells without DOX served as control groups. Scale bar, 100 μm. (C) VP administration increased the size of the crypt-like regions and restored LGR5-EGFP expression on the stiff matrix. Scale bars, 100 μm for the C57BL mouse group and 25 μm for the LGR5-EGFP mouse group. (D) Quantification of (A, B and C) shows the proportions of YAP, nuc-YAP+ and cyto-YAP+ cells in LGR5+ cells as well as impacts of VP on crypt size and number of LGR5+ cells per crypt. (E) MUC2 was highly expressed in cells with intense YAP nuclear localization in villus regions (n=3). Scale bar, 25 μm. (F) YAP cOE on soft substrate increased both nuc-YAP and MUC2. Scale bar, 25 μm. (G) VP administration on stiff substrate decreased both nuc-YAP and MUC2. Scale bar, 25 μm. (H) Quantification of (E, F and G) shows the proportions of YAP, nuc-YAP+ and cyto-YAP+ cells in MUC2+ cells and the impacts of YAP OE and VP on the proportions of nuc-YAP+ and MUC2+ cells in total cells. (I) OLFM4 expression was highly correlated with cytoplasmic YAP stained with total YAP in villus regions (n=3). Scale bar, 25 μm. Both YAP cOE on soft substrate (J) and VP administration on stiff substrate (K) persistently increased cyto-YAP and OLFM4. Cyto-YAP was stained with Ser 127 phosphorylated YAP. Scale bar in (J) and (K), 25 μm. (L) Quantification of (I, J and K) shows that the proportions of YAP, nuc-YAP+ and cyto-YAP+ cells in OLFM4+ cells and the impacts of YAP OE and VP on the proportions of cyto-YAP+ and OLFM4+ cells in total cells. *, P<0.05 (Student’s t-test). The error bars denote standard deviation.
Figure 5.
Figure 5.. Single cell RNA sequencing of 2.5D gut organoids.
(A) UMAP plot with cell clusters (marked by color) including ISCs and differentiated cells. ‘Sec’, secretory; ‘Pro’, progenitor; ‘E’, enterocyte; ‘M’, microfold. (B) Heat map for marker genes of each cell type (Figure. S5). (C) The differences of the proportions of each cell type between the soft and stiff matrices analyzed using the scProportionTest tool. (D) Differential expression analysis and immunofluorescence showed that expression of Tff3 gene was higher on the stiff matrix compared to the soft matrix. Scale bar, 100 μm. (E) Genes downregulated by YAP were highly expressed in the enterocyte and E pro-1 clusters; genes upregulated by YAP were highly expressed in goblet cells, IEGC-1, and M cells. (F) Pathway enrichment analysis (PEA) demonstrates that the metabolic pathways involved in glucose uptake and catabolism, including oxidative phosphorylation, glycolysis, and TCA cycle, are more enriched on the stiff substrate. (G) Glucose uptake and mitochondrial activity assays, using 2-NBDG Administration and Mitosox measurement, respectively, demonstrate that stiffening increases glucose uptake and catabolism. Scale bars, 50 μm for the glucose uptake images and 20 μm for the Mitosox images. (H) GLUT2 expression was greater on stiff matrix compared to soft matrix. Scale bar, 100 μm. (I) On stiff matrix, the administration of the pan-class I GLUT inhibitor, Glutor, inhibited the uptake of glucose analog 2-NBDG, increased the crypt size, and decreased MUC2 expression. Scale bars, 20 μm for the glucose uptake images and 100 μm for the MUC2 staining images. n=3 for A-I.
Figure 6.
Figure 6.. Stiffness regulates ISC fate in chronic colitis mouse model.
(A) H&E staining shows that the colon epithelium with severe damage on Day 0 was significantly regenerated on Day 14. Scale bars, 200 μm. (B) Colon stiffened (n=3) and thickened (n=6) in the DSS-induced colitis group compared with the control group without DSS. Methods for the Measurement of colon stiffness and thickness are in Method. (C) As shown in immunohistochemistry (IHC), nuc-YAP stained with non-phosphorylated YAP increased in the DSS groups compared with No DSS control. VP treatment caused a reduction of nuc-YAP and increased cyto-YAP expression. Scale bars, 25 μm. (D) In situ hybridization (ISH) showed that Lgr5 expression was suppressed in DSS ground and was recovered after VP treatment. Scale bars, 25 μm. (E) MUC2 expression (IHC) was augmented in colon brush border of DSS groups, and was decreased after VP administration. Scale bars, 25 μm. (F) Quantification of nuc-YAP+ cells and LGR5+ cells per crypt and MUC2+ cells per colon brush border. n=3–6. *, P<0.05 (Student’s t-test). The error bars denote standard deviation.
Figure 7.
Figure 7.. Stiffness regulates ISC fate in human IBD patients.
(A) scRNAseq analysis showed a decrease in ISC population and an increase of goblet cell population in human IBD colon. *P<0.05, **P<0.01, ***P<0.001. Pathway enrichment analysis showed that in IBD samples, WNT signaling is suppressed in ISCs, YAP up-regulated genes are highly expressed in ISCs and goblet cells, and ECM biosynthesis is activated in EECs. Boxes outlined in Black represent P<0.05 for the linear mixed model and P<0.05 for pathway enrichment (Method). (B) H&E staining of human colon tissues shows thickening of the BM and lamina propria (labelled with asterisks). Masson’s trichrome staining (C) and staining of COLLAGEN I and IV (D) reveal fibrosis of lamina propria. Scale bars in (C) and (D), 200 μm. (E) KI-67+ proliferating cells and LGR5+ ISCs were decreased, and (F) OLFM4+ cells were increased in the IBD samples. Scale bars in (E) and (F), 200 μm. (G) In a large area (outside the dashed line) of the strictured ileum (extreme fibrosis), the invaginated ISC niche-crypts nearly disappear and only pieces of the villi remain. Numerous ectopic crypts (inside black dashed line) have formed and expressed strong OLFM4 and weak LGR5. Scale bar, 200 μm. (H) MUC2+ goblet cells increased in the inflamed colon. (I) YAP showed greater expression and nuclear localization in the IBD colon. n=6. Scale bar, 200 μm. (J) Schematic describing the stiffening-dependent ISC fate, showing that stiffness regulates ISC fate via YAP, and YAP OE transforms the soft-matrix phenotypes into the stiff-matrix phenotypes, and VP does the reverse. ‘Yellow’ indicates regulation by nuc-YAP. ‘Green’, regulation by cyto-YAP.

References

    1. Bloemendaal AL, Buchs NC, George BD, et al. Intestinal stem cells and intestinal homeostasis in health and in inflammation: a review. Surgery 2016;159:1237–1248. - PubMed
    1. Schmitt M, Schewe M, Sacchetti A, et al. Paneth cells respond to inflammation and contribute to tissue regeneration by acquiring stem-like features through SCF/c-Kit signaling. Cell reports 2018;24:2312–2328. e7. - PubMed
    1. Wang Y, Chiang I-L, Ohara TE, et al. Long-term culture captures injury-repair cycles of colonic stem cells. Cell 2019;179:1144–1159. e15. - PMC - PubMed
    1. Yui S, Azzolin L, Maimets M, et al. YAP/TAZ-dependent reprogramming of colonic epithelium links ECM remodeling to tissue regeneration. Cell Stem Cell 2018;22:35–49. e7. - PMC - PubMed
    1. Stewart DC, Berrie D, Li J, et al. Quantitative assessment of intestinal stiffness and associations with fibrosis in human inflammatory bowel disease. PloS one 2018;13. - PMC - PubMed

Publication types